概述
该策略使用Supertrend指标来捕捉市场趋势。Supertrend指标结合了价格和波动率,当指标线为绿色时表示上升趋势,为红色时表示下降趋势。策略通过检测指标线的颜色变化来产生买卖信号,同时利用指标线作为动态止损位。策略还引入了移动止损和固定止盈逻辑,以优化策略表现。
策略原理
- 计算Supertrend指标的上轨(up)和下轨(dn),并根据收盘价与上下轨的关系判断当前趋势方向(trend)。
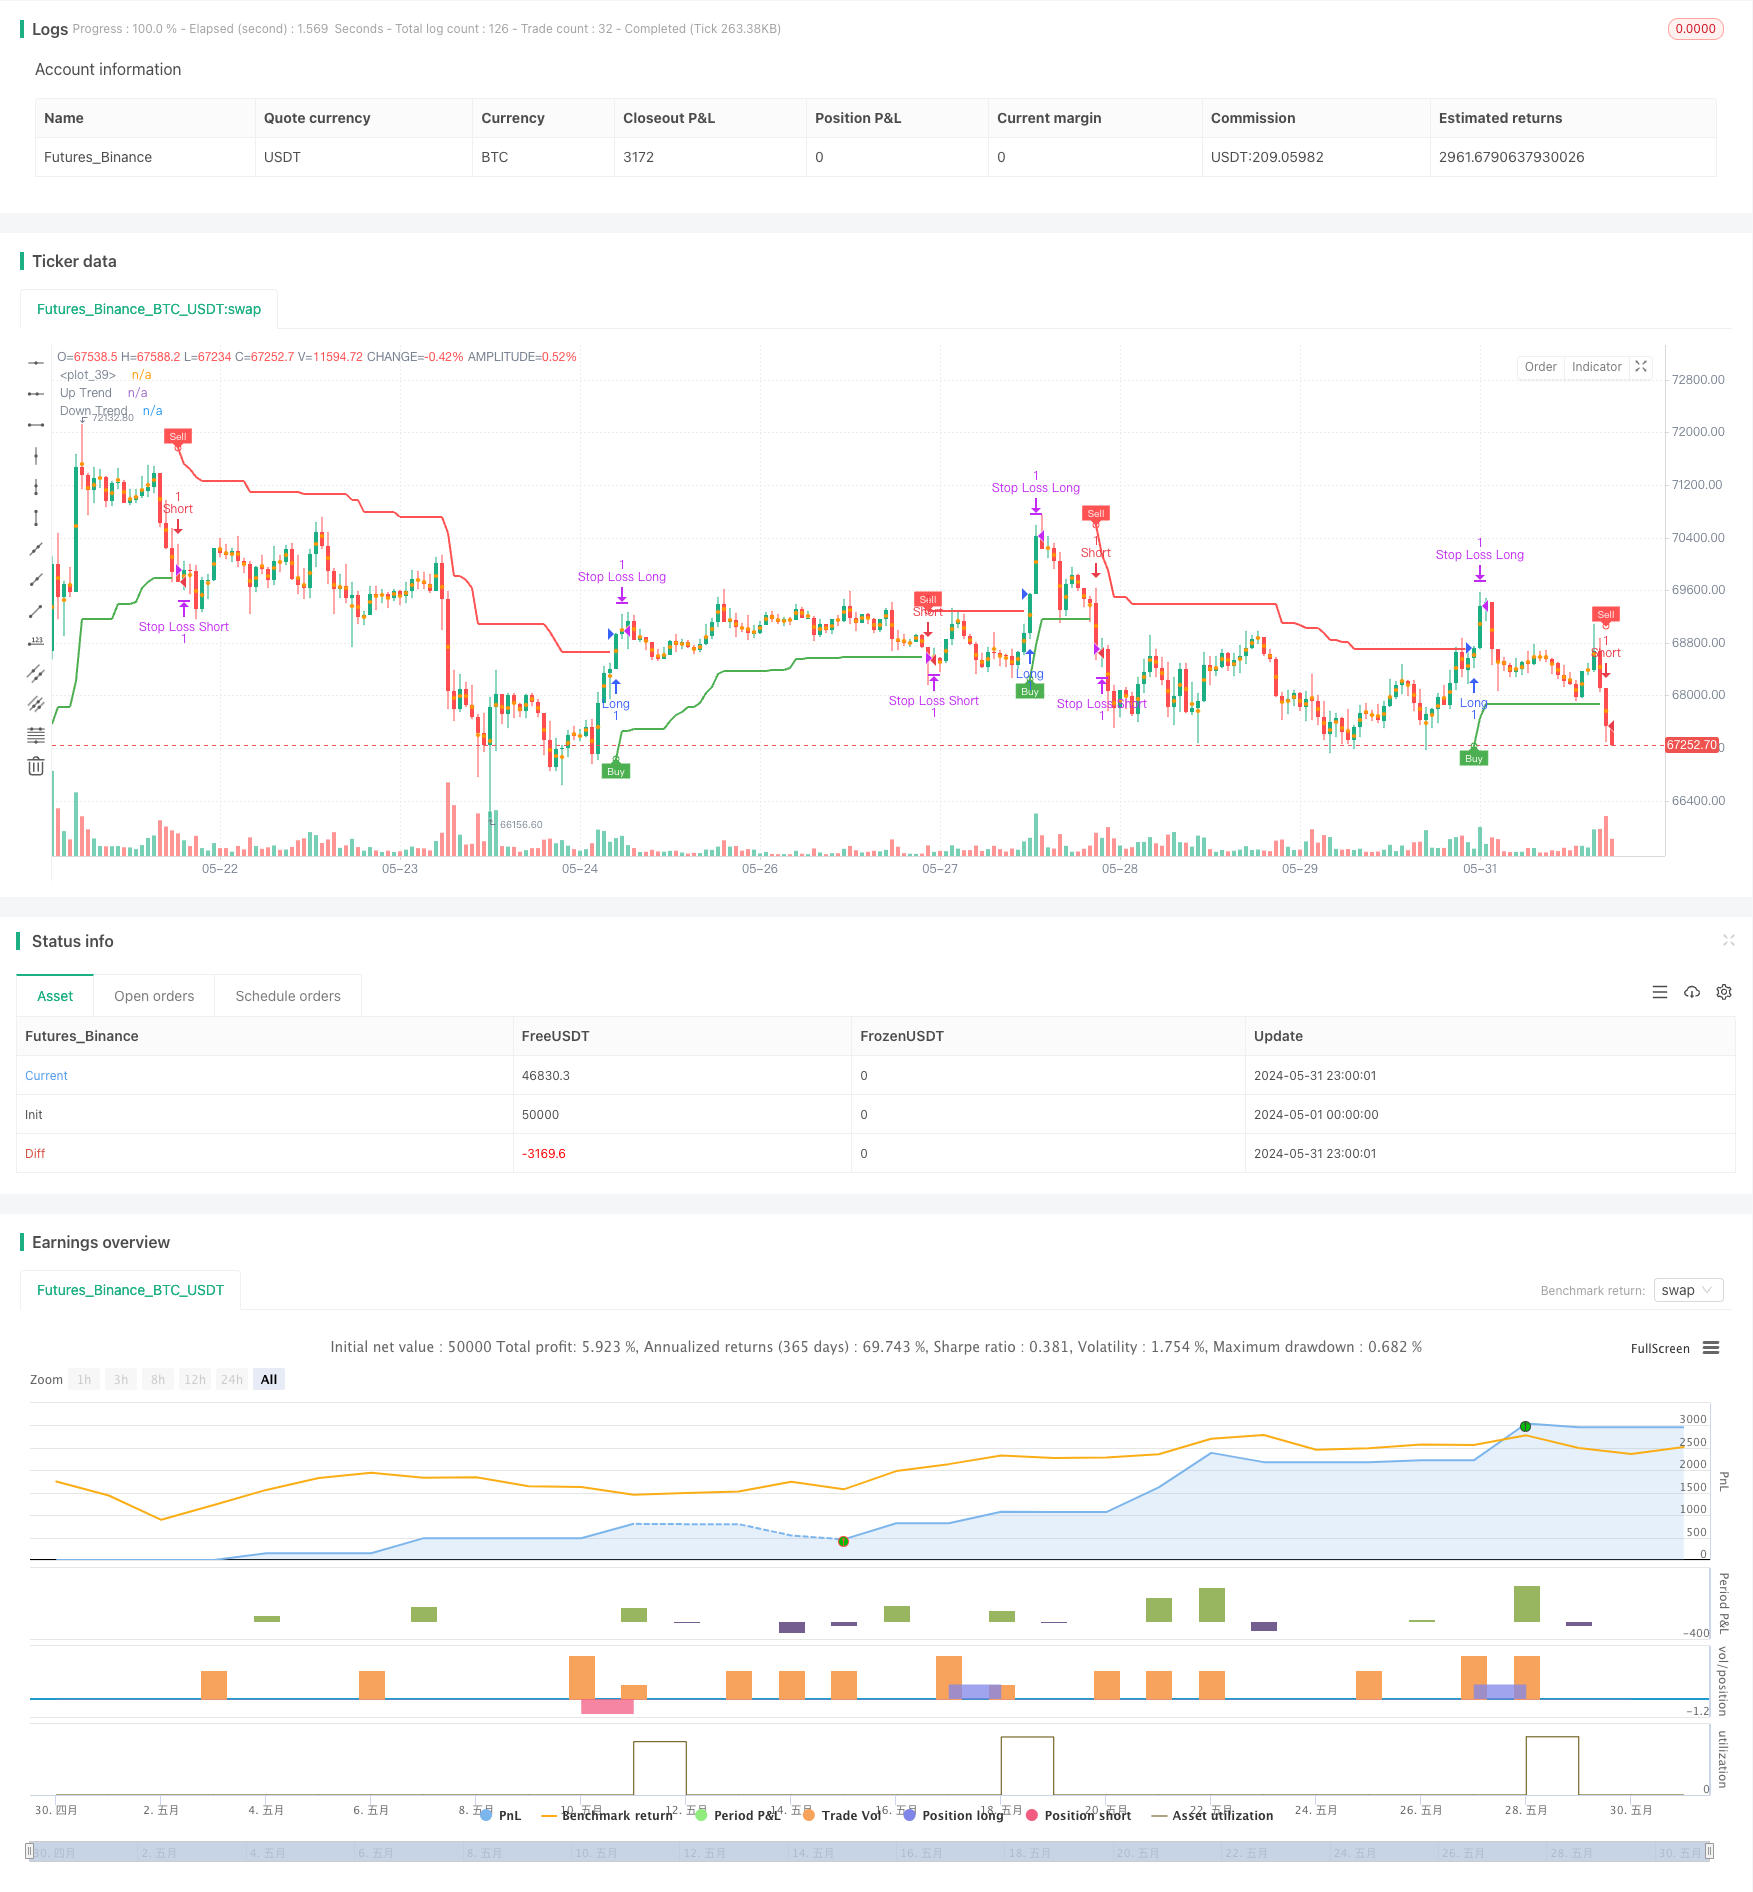
- 当趋势由下降(-1)转为上升(1)时,产生买入信号(buySignal);当趋势由上升(1)转为下降(-1)时,产生卖出信号(sellSignal)。
- 在产生买入信号时,开仓做多,并将下轨(dn)设为止损位;在产生卖出信号时,开仓做空,并将上轨(up)设为止损位。
- 引入移动止损逻辑,当价格上涨/下跌一定点数(trailingValue)时,将止损位上移/下移,实现止损保护。
- 引入固定止盈逻辑,当趋势发生变化时,平仓获利了结。
策略优势
- 适应性强:Supertrend指标结合价格和波动率,能够适应不同的市场状态和交易品种。
- 动态止损:利用指标线作为动态止损位,可以有效控制风险,减少损失。
- 移动止损:引入移动止损逻辑,可以在趋势持续时保护利润,提高策略盈利能力。
- 明确信号:策略产生的买卖信号清晰明了,易于操作和执行。
- 参数灵活:策略的参数(如ATR周期、ATR乘数等)可以根据市场特点和交易风格进行调整,提高适应性。
策略风险
- 参数风险:不同参数设置可能导致策略表现差异较大,需要进行充分的回测和参数优化。
- 震荡市风险:在震荡市场中,频繁的趋势变化可能导致策略产生较多的交易信号,增加交易成本和滑点风险。
- 趋势突变风险:当市场趋势突然发生变化时,策略可能来不及及时调整仓位,导致损失加大。
- 过度优化风险:对策略进行过度优化可能导致曲线拟合,在未来市场中表现不佳。
策略优化方向
- 引入多时间框架分析,确认趋势的稳健性,减少震荡市中的频繁交易。
- 结合其他技术指标或基本面因素,提高趋势判断的准确性。
- 优化止损和止盈逻辑,如引入动态止盈或风险收益比等,提高策略的盈亏比。
- 对参数进行稳健性测试,选择在不同市场状态下都能保持良好表现的参数组合。
- 引入仓位管理和资金管理规则,控制单笔交易风险和总体风险。
总结
动态趋势跟踪策略利用Supertrend指标捕捉市场趋势,通过动态止损和移动止损控制风险,同时利用固定止盈锁定利润。该策略适应性强,信号明确,易于操作。但在实际应用中,需要注意参数优化、震荡市风险和趋势突变风险等问题。通过引入多时间框架分析、优化止损止盈逻辑、参数稳健性测试等措施,可以进一步提升策略的表现和稳定性。
策略源码
/*backtest
start: 2024-05-01 00:00:00
end: 2024-05-31 23:59:59
period: 1h
basePeriod: 15m
exchanges: [{"eid":"Futures_Binance","currency":"BTC_USDT"}]
*/

//@version=5
strategy('Supertrend Strategy', overlay=true, format=format.price, precision=2)
Periods = input.int(title='ATR Period', defval=10)
src = input.source(hl2, title='Source')
Multiplier = input.float(title='ATR Multiplier', step=0.1, defval=3.0)
changeATR = input.bool(title='Change ATR Calculation Method ?', defval=true)
showsignals = input.bool(title='Show Buy/Sell Signals ?', defval=true)
highlighting = input.bool(title='Highlighter On/Off ?', defval=true)

// ATR calculation
atr2 = ta.sma(ta.tr, Periods)
atr = changeATR ? ta.atr(Periods) : atr2

// Supertrend calculations
up = src - Multiplier * atr
up1 = nz(up[1], up)
up := close[1] > up1 ? math.max(up, up1) : up
dn = src + Multiplier * atr
dn1 = nz(dn[1], dn)
dn := close[1] < dn1 ? math.min(dn, dn1) : dn

// Trend direction
trend = 1
trend := nz(trend[1], trend)
trend := trend == -1 and close > dn1 ? 1 : trend == 1 and close < up1 ? -1 : trend

// Plotting
upPlot = plot(trend == 1 ? up : na, title='Up Trend', style=plot.style_linebr, linewidth=2, color=color.new(color.green, 0))
buySignal = trend == 1 and trend[1] == -1
plotshape(buySignal ? up : na, title='UpTrend Begins', location=location.absolute, style=shape.circle, size=size.tiny, color=color.new(color.green, 0))
plotshape(buySignal and showsignals ? up : na, title='Buy', text='Buy', location=location.absolute, style=shape.labelup, size=size.tiny, color=color.new(color.green, 0), textcolor=color.new(color.white, 0))

dnPlot = plot(trend == 1 ? na : dn, title='Down Trend', style=plot.style_linebr, linewidth=2, color=color.new(color.red, 0))
sellSignal = trend == -1 and trend[1] == 1
plotshape(sellSignal ? dn : na, title='DownTrend Begins', location=location.absolute, style=shape.circle, size=size.tiny, color=color.new(color.red, 0))
plotshape(sellSignal and showsignals ? dn : na, title='Sell', text='Sell', location=location.absolute, style=shape.labeldown, size=size.tiny, color=color.new(color.red, 0), textcolor=color.new(color.white, 0))

// Highlighting
mPlot = plot(ohlc4, title='', style=plot.style_circles, linewidth=0)
longFillColor = highlighting ? trend == 1 ? color.green : color.white : color.white
shortFillColor = highlighting ? trend == -1 ? color.red : color.white : color.white
fill(mPlot, upPlot, title='UpTrend Highligter', color=longFillColor, transp=90)
fill(mPlot, dnPlot, title='DownTrend Highligter', color=shortFillColor, transp=90)

// Alerts
alertcondition(buySignal, title='SuperTrend Buy', message='SuperTrend Buy!')
alertcondition(sellSignal, title='SuperTrend Sell', message='SuperTrend Sell!')
changeCond = trend != trend[1]
alertcondition(changeCond, title='SuperTrend Direction Change', message='SuperTrend has changed direction!')

// Pip and trailing stop calculation
pips = 50
pipValue = syminfo.mintick * pips
trailingPips = 10
trailingValue = syminfo.mintick * trailingPips

// Strategy
if (buySignal)
    strategy.entry("Long", strategy.long, stop=dn, comment="SuperTrend Buy")
if (sellSignal)
    strategy.entry("Short", strategy.short, stop=up, comment="SuperTrend Sell")

// Take profit on trend change
if (changeCond and trend == -1)
    strategy.close("Long", comment="SuperTrend Direction Change")
if (changeCond and trend == 1)
    strategy.close("Short", comment="SuperTrend Direction Change")

// Initial Stop Loss
longStopLevel = up - pipValue
shortStopLevel = dn + pipValue

// Trailing Stop Loss
var float longTrailStop = na
var float shortTrailStop = na

if (strategy.opentrades > 0)
    if (strategy.position_size > 0)  // Long position
        if (longTrailStop == na or close > strategy.position_avg_price + trailingValue)
            longTrailStop := high - trailingValue
        strategy.exit("Stop Loss Long", from_entry="Long", stop=longTrailStop)
    if (strategy.position_size < 0)  // Short position
        if (shortTrailStop == na or close < strategy.position_avg_price - trailingValue)
            shortTrailStop := low + trailingValue
        strategy.exit("Stop Loss Short", from_entry="Short", stop=shortTrailStop)

// Initial Exit
strategy.exit("Initial Stop Loss Long", from_entry="Long", stop=longStopLevel)
strategy.exit("Initial Stop Loss Short", from_entry="Short", stop=shortStopLevel)
相关推荐