MACD Moving Average Cross Trend Strategi Henti Kerugian

Gambaran keseluruhan
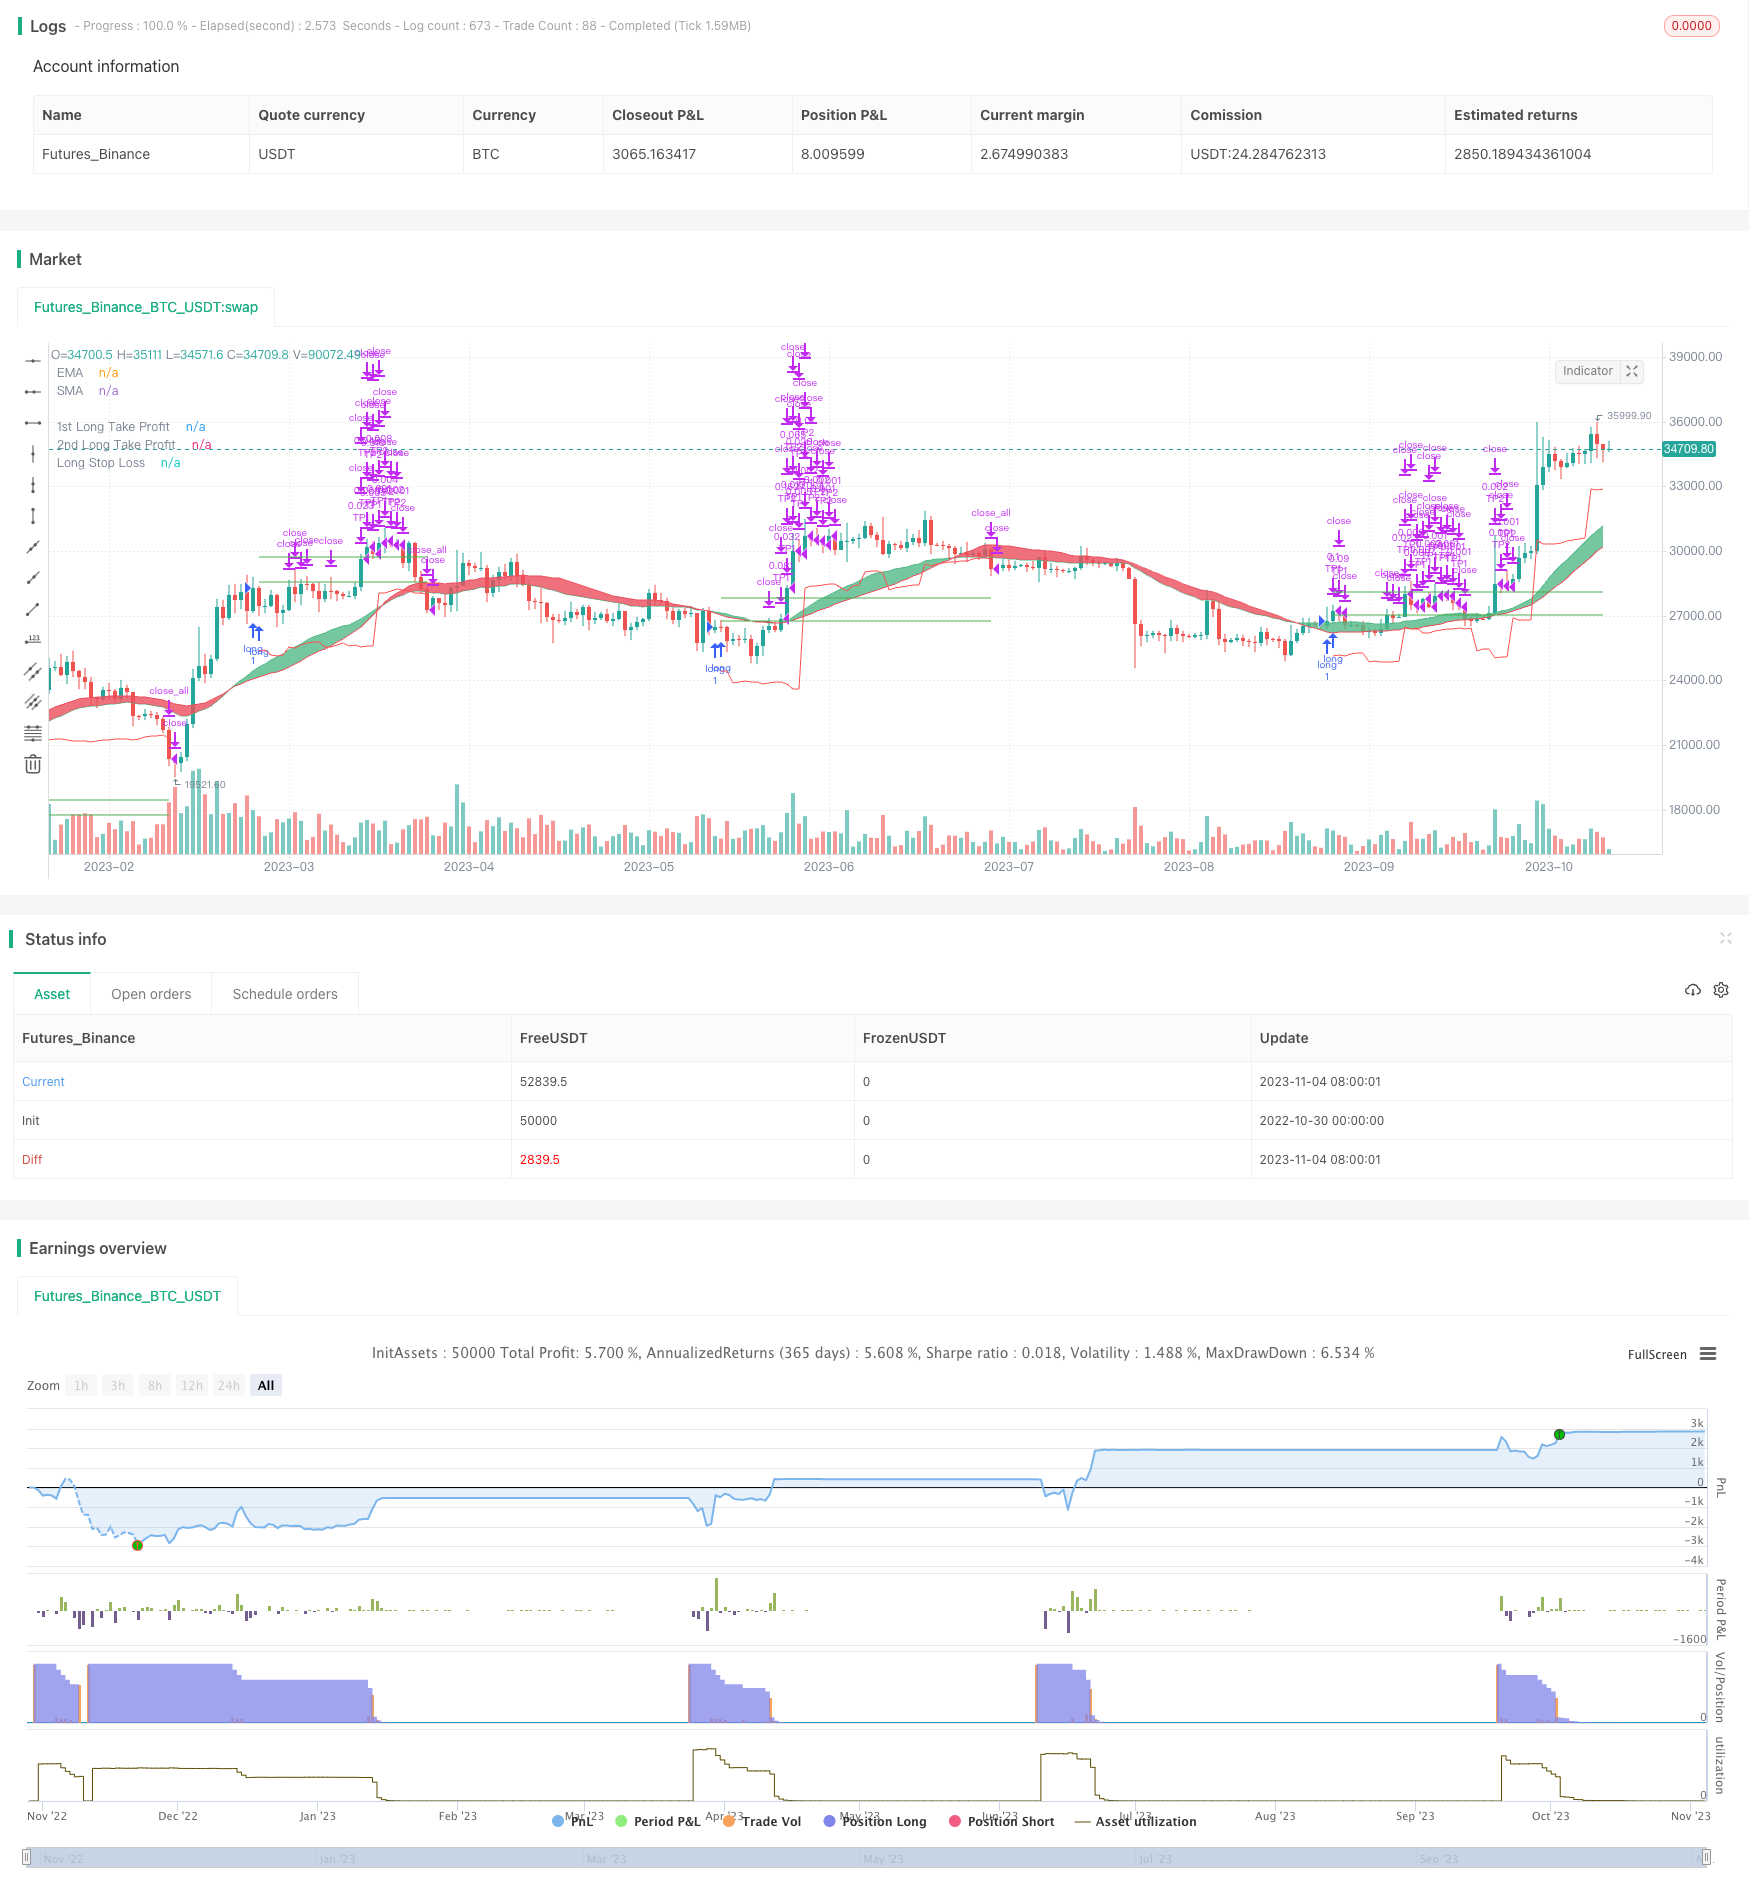
Strategi ini menggunakan indikator MACD untuk menentukan arah trend, digabungkan dengan EMA rata-rata dan persilangan rata-rata SMA sebagai penilaian tambahan. Isyarat masuk melintasi garis isyarat pada garis lurus MACD dan trend ke atas, dan hentikan untuk harga jatuh ke atas garis hentikan harga yang dikira oleh ATR. Strategi ini juga menetapkan keluar secara berturut-turut, terlebih dahulu meratakan sebahagian daripada kedudukan untuk mendapatkan keuntungan, kemudian meratakan bahagian apabila harga mencapai kenaikan yang lebih besar dan memastikan keuntungan yang besar, dan akhirnya mengikuti kedudukan sehingga berhenti.
Prinsip
Isyarat masuk
Apabila EMA dalam talian cepat melintasi EMA dalam talian perlahan, ia menunjukkan bahawa perubahan harga dalam jangka pendek lebih baik daripada trend jangka panjang, dan ia dianggap sebagai isyarat untuk membeli. Pada masa yang sama, SMA dalam talian cepat melintasi SMA dalam talian perlahan juga menunjukkan bahawa kenaikan harga dalam jangka pendek lebih baik daripada jangka panjang. Oleh itu, gabungan antara EMA & SMA dalam talian lurus MACD dan isyarat silang EMA & SMA dalam arah trend, dapat menentukan masa masuk yang lebih kuat.
Cara untuk menghentikan kerugian
Menggunakan ATR untuk mengira titik berhenti. ATR dapat mencerminkan rentang turun naik harga dengan berkesan. Apabila harga jatuh ke dalam rentang turun naik itu, keluar dari penangguhan. ATR boleh disesuaikan, pengurangan kitaran dapat membuat penangguhan lebih tepat tetapi lebih mudah ditembusi, dan pembesaran penangguhan secara berkala akan lebih luas tetapi tidak mudah ditembusi.
Permulaan
Pergi dalam kumpulan, mula-mula selepas kenaikan kecil, anda akan melonggarkan sebahagian daripada wang yang diperoleh dari kedudukan tersebut. Kemudian, apabila harga meningkat dengan ketara, anda akan melonggarkan sebahagian daripada keuntungan. Akhirnya, anda akan menjejaki sebahagian daripada kedudukan dan memegangnya sehingga titik berhenti anda mencetuskan berhenti.
Kelebihan
- Menggunakan MACD untuk menentukan arah trend, ditambah dengan isyarat silang EMA dan SMA, anda boleh menentukan masa masuk dengan lebih tepat
- Stop loss yang dikira oleh ATR membolehkan anda menghentikan kerugian dan mengikut trend.
- Berkongsi, dapatkan wang balik, kunci keuntungan dan simpan untuk sementara waktu
Risiko dan tindakan
- Risiko bahawa MACD dan indikator trend menghantar isyarat yang salah. Parameter boleh disesuaikan dengan sewajarnya, atau menambah indikator lain untuk penilaian tambahan.
- Risiko ATR terhalang oleh penembusan. Anda boleh memperluaskan kitaran ATR atau meningkatkan faktor terhalang dengan sewajarnya.
- Risiko terkurung semasa mengikuti sebahagian kedudukan. Anda boleh mengurangkan peratusan kedudukan yang dikesan dan menghentikan kerugian tepat pada masanya.
Arah pengoptimuman
Mengoptimumkan parameter MACD untuk membuat penilaian trend yang lebih tepat
Mengoptimumkan parameter kitaran ATR untuk membuat hentian lebih sesuai
Mengoptimumkan peratusan keluar dan kawalan kedudukan, mengurangkan risiko terikat
Tambah Hentian Bergerak atau pertimbangkan Stop Loss Pengoptimuman Indeks Fluktuasi
ringkaskan
Strategi ini menggabungkan penggunaan pelbagai petunjuk untuk menentukan arah trend, seperti MACD, EMA / SMA, untuk mendapatkan masa masuk yang tepat. Pada masa yang sama, ATR berhenti untuk mengunci keuntungan dan mengikuti trend untuk mencapai kesan yang lebih baik.
/*backtest
start: 2022-10-30 00:00:00
end: 2023-11-05 00:00:00
period: 1d
basePeriod: 1h
exchanges: [{"eid":"Futures_Binance","currency":"BTC_USDT"}]
*/

// This source code is subject to the terms of the Mozilla Public License 2.0 at https://mozilla.org/MPL/2.0/
// © Deobald

//@version=4
strategy("MACD Strategy", overlay=true)

// FUNCTIONS

Ema(src,p) =>
    ema = 0.
    sf = 2/(p+1)
    ema := nz(ema[1] + sf*(src - ema[1]),src)

Sma(src,p) => a = cum(src), (a - a[max(p,0)])/max(p,0)

Atr(p) =>
    atr = 0.
    Tr = max(high - low, max(abs(high - close[1]), abs(low - close[1])))
    atr := nz(atr[1] + (Tr - atr[1])/p,Tr)

/// TREND
ribbon_period = input(34, "Period", step=1)

leadLine1 = ema(close, ribbon_period)
leadLine2 = sma(close, ribbon_period)

p3 = plot(leadLine1, color= #53b987, title="EMA", transp = 50, linewidth = 1)
p4 = plot(leadLine2, color= #eb4d5c, title="SMA", transp = 50, linewidth = 1)
fill(p3, p4, transp = 60, color = leadLine1 > leadLine2 ? #53b987 : #eb4d5c)


// MACD
fast_length = input(title="Fast Length", type=input.integer, defval=3)
slow_length = input(title="Slow Length", type=input.integer, defval=5)
src = input(title="Source", type=input.source, defval=close)
signal_length = input(title="Signal Smoothing", type=input.integer, minval = 1, maxval = 50, defval = 2)
sma_source = input(title="Simple MA(Oscillator)", type=input.bool, defval=false)
sma_signal = input(title="Simple MA(Signal Line)", type=input.bool, defval=true)

// Plot colors
col_grow_above = #26A69A
col_grow_below = #FFCDD2
col_fall_above = #B2DFDB
col_fall_below = #EF5350
col_macd = #0094ff
col_signal = #ff6a00

// Calculating
fast_ma = sma_source ? Sma(src, fast_length) : Ema(src, fast_length)
slow_ma = sma_source ? Sma(src, slow_length) : Ema(src, slow_length)
macd = fast_ma - slow_ma
signal = sma_signal ? Sma(macd, signal_length) : Ema(macd, signal_length)
hist = macd - signal

//plot(hist, title="Histogram", style=plot.style_columns, color=(hist>=0 ? (hist[1] < hist ? col_grow_above : col_fall_above) : (hist[1] < hist ? col_grow_below : col_fall_below) ), transp=0 )
// plot(macd, title="MACD", color=col_macd, transp=0)
// plot(signal, title="Signal", color=col_signal, transp=0)


// TAKE PROFIT AND STOP LOSS
long_tp1_inp = input(1, title='Long Take Profit 1 %', step=0.1)/100
long_tp1_qty = input(10, title="Long Take Profit 1 Qty", step=1)

long_tp2_inp = input(5, title='Long Take Profit 2%', step=0.1)/100
long_tp2_qty = input(50, title="Long Take Profit 2 Qty", step=1)

long_take_level_1 = strategy.position_avg_price * (1 + long_tp1_inp)
long_take_level_2 = strategy.position_avg_price * (1 + long_tp2_inp)


// Stop Loss
multiplier = input(2.2, "SL Mutiplier", minval=1, step=0.1)
ATR_period=input(17,"ATR period", minval=1, step=1)

// Strategy
entry_long=crossover(macd,signal) and leadLine2 < leadLine1
entry_price_long=valuewhen(entry_long,close,0)
SL_floating_long = entry_price_long - multiplier*Atr(ATR_period)
exit_long= close < SL_floating_long

///// BACKTEST PERIOD ///////
testStartYear = input(2018, "Backtest Start Year")
testStartMonth = input(1, "Backtest Start Month")
testStartDay = input(1, "Backtest Start Day")
testPeriodStart = timestamp(testStartYear, testStartMonth, testStartDay, 0, 0)

testStopYear = input(2020, "Backtest Stop Year")
testStopMonth = input(12, "Backtest Stop Month")
testStopDay = input(31, "Backtest Stop Day")
testPeriodStop = timestamp(testStopYear, testStopMonth, testStopDay, 0, 0)

testPeriod() => true

if testPeriod()
    strategy.entry("long", strategy.long, comment="Long", when=entry_long)
    strategy.exit("TP1","long", qty_percent=long_tp1_qty, limit=long_take_level_1)//, trail_points=entry_price_long * long_trailing / syminfo.mintick, trail_offset=entry_price_long * long_trailing / syminfo.mintick)
    strategy.exit("TP2", qty_percent=long_tp2_qty, limit=long_take_level_2) //, trail_points=entry_price_long * long_trailing / syminfo.mintick, trail_offset=entry_price_long * long_trailing / syminfo.mintick)
    strategy.close_all("long", when=exit_long, comment="exit long" )


// LONG POSITION
plot(strategy.position_size > 0 ? long_take_level_1 : na, style=plot.style_linebr, color=color.green, linewidth=1, title="1st Long Take Profit")
plot(strategy.position_size > 0 ? long_take_level_2 : na, style=plot.style_linebr, color=color.green, linewidth=1, title="2nd Long Take Profit")
plot(strategy.position_size > 0 ? SL_floating_long : na, style=plot.style_linebr, color=color.red, linewidth=1, title="Long Stop Loss")