Stochastic Supertrend Trailing Stop Strategi Dagangan

Gambaran keseluruhan
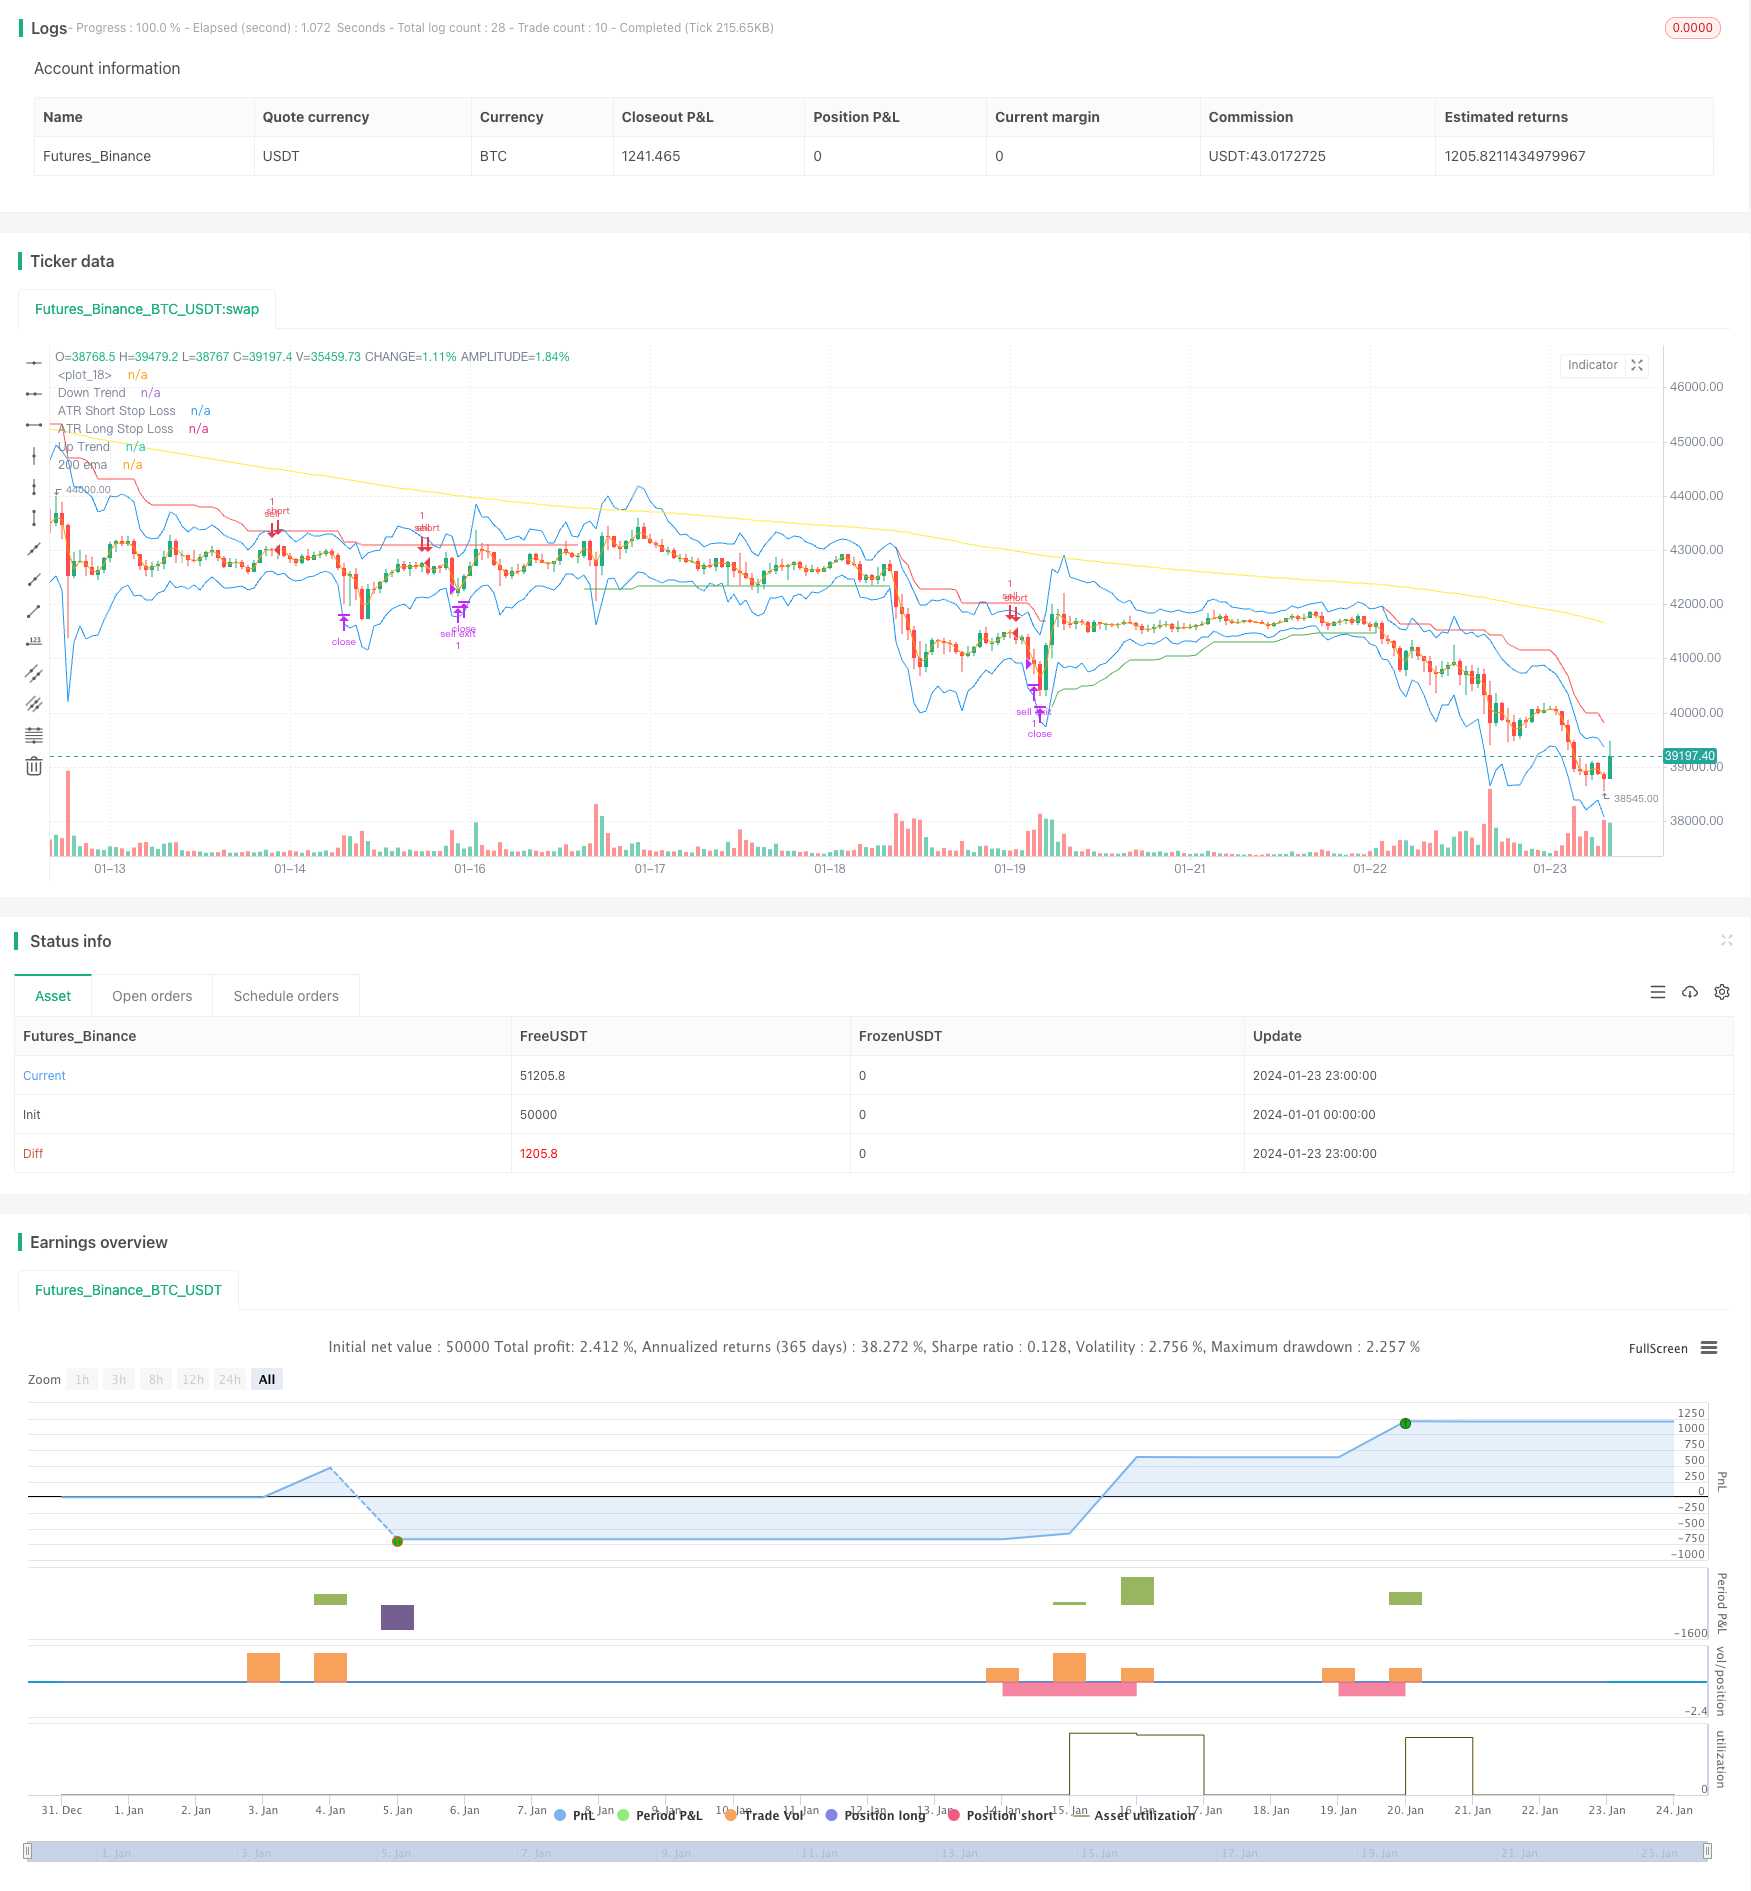
Ini adalah strategi perdagangan stop loss yang menggabungkan pelbagai petunjuk teknikal. Ia menggunakan indikator Supertrend, Stochastic, 200-day moving average dan ATR stop loss untuk mengenal pasti isyarat perdagangan dan menetapkan stop loss.
Prinsip Strategi
Apabila garis Stochastic K turun dari kawasan overbuy, Supertrend menunjukkan trend ke atas, dan harga memecahkan purata bergerak 200 hari, buat lebih banyak; apabila garis Stochastic K naik dari kawasan oversell, Supertrend menunjukkan trend ke bawah, dan harga jatuh di bawah purata bergerak 200 hari, buat kosong.
Khususnya, apabila Stochastic K melebihi 80 nilai, ia dianggap sebagai isyarat beli; apabila Stochastic K melebihi 20 nilai, ia dianggap sebagai isyarat jual. Indikator Supertrend menentukan arah trend harga, apabila Supertrend menunjukkan ke atas, harga berada dalam trend naik, apabila Supertrend menunjukkan ke bawah, harga berada dalam trend menurun. Indikator ATR digunakan untuk mengira gelombang sebenar.
Syarat pemicu pelbagai isyarat: Garis Stochastic K turun dari zon superbeli (<80); Supertrend menunjukkan ke atas; harga melebihi purata bergerak 200 hari.
Syarat isyarat isyarat isyarat isyarat isyarat isyarat isyarat isyarat isyarat isyarat isyarat isyarat isyarat isyarat isyarat isyarat isyarat isyarat isyarat isyarat isyarat isyarat isyarat isyarat isyarat isyarat isyarat isyarat isyarat isyarat isyarat isyarat isyarat isyarat isyarat isyarat isyarat isyarat isyarat isyarat isyarat isyarat isyarat isyarat isyarat isyarat isyarat isyarat isyarat isyarat isyarat isyarat isyarat isyarat isyarat isyarat isyarat isyarat isyarat isyarat isyarat isyarat isyarat isyarat isyarat isyarat isyarat isyarat isyarat isyarat isyarat isyarat isyarat isyarat isyarat isyarat isyarat isyarat isyarat isyarat isyarat isyarat isyarat isyarat isyarat isyarat isyarat isyarat isyarat isyarat isyarat isyarat isyarat isyarat isyarat isyarat isyarat isyarat isaysaysaysaysaysaysaysaysaysaysaysaysaysaysaysaysaysaysaysaysaysaysaysaysaysaysaysaysaysaysaysaysaysaysaysaysaysaysaysaysaysaysaysaysaysaysaysaysaysaysaysaysaysaysaysays
Selepas masuk, set ATR berhenti untuk mengesan risiko kawalan turun naik harga. Stop ganda adalah harga minimum tolak ATR nilai kali faktor; Stop kosong adalah harga tertinggi ditambah ATR nilai kali faktor.
Kelebihan Strategik
Strategi ini digabungkan dengan pelbagai petunjuk untuk menentukan arah trend dan masa masuk, yang dapat menyaring isyarat palsu dengan berkesan. Pada masa yang sama, penggunaan ATR dinamik untuk mengesan hentikan kerugian dapat mengawal risiko dan memaksimumkan simpanan wang berdasarkan keadaan pasaran yang bergolak.
Strategi ini dapat menangkap titik-titik perubahan dengan lebih baik daripada strategi mengikuti trend seperti purata bergerak sederhana. ATR ini mempunyai lebih banyak fleksibiliti daripada stop loss tunggal. Oleh itu, strategi ini secara keseluruhan mempunyai nisbah keuntungan risiko yang lebih baik.
Risiko Strategik
Strategi ini bergantung kepada penilaian penunjuk, jika penunjuk menghantar isyarat yang salah, ia boleh menyebabkan kerugian akibat operasi terbalik. Selain itu, dalam keadaan gegaran, hentian mungkin sering dipicu, membawa kerugian.
Di samping itu, walaupun ATR Stop boleh menyesuaikan kedudukan Stop mengikut turun naik, ia tidak dapat sepenuhnya mengelakkan kemungkinan Stop akan ditembusi. Jika harga melompat, Stop Order mungkin akan dicetuskan secara langsung.
Pengoptimuman Strategi
Strategi ini boleh dioptimumkan dari segi berikut:
Menyesuaikan parameter penunjuk untuk mengoptimumkan ketepatan isyarat beli dan jual. Sebagai contoh, penunjuk Stochastic yang boleh menguji parameter yang berbeza, atau menyesuaikan kitaran ATR dan parameter penggandaan untuk penunjuk Supertrend.
Uji keserasian kaedah-kaedah lain untuk menghentikan kerugian. Sebagai contoh, anda boleh mencuba algoritma berhenti pintar yang lebih fleksibel daripada ATR, atau pertimbangkan untuk menghentikan kerugian dengan berhenti bergerak.
Menambah syarat penapisan, kemasukan dalam keadaan yang lebih dipercayai. Sebagai contoh, penapis seperti penunjuk tenaga jumlah urus niaga dapat ditambahkan, untuk mengelakkan masuk secara salah berdasarkan penunjuk apabila jumlah tidak mencukupi.
Mengoptimumkan strategi pengurusan wang, seperti penyesuaian dinamika kedudukan.
ringkaskan
Stochastic Supertrend mengesan strategi perdagangan stop loss yang komprehensif menggunakan pelbagai petunjuk untuk menentukan arah trend, dan menggunakan penjejakan pintar ATR untuk mengawal risiko. Strategi ini dapat menyaring bunyi masuk secara berkesan, dengan nisbah keuntungan risiko yang lebih baik. Kita boleh terus mengoptimumkan strategi ini dengan cara menyesuaikan parameter, mengubah cara berhenti, dan menambah syarat penapisan, supaya dapat menyesuaikan diri dengan persekitaran pasaran yang lebih kompleks.
/*backtest
start: 2024-01-01 00:00:00
end: 2024-01-24 00:00:00
period: 1h
basePeriod: 15m
exchanges: [{"eid":"Futures_Binance","currency":"BTC_USDT"}]
*/

// This source code is subject to the terms of the Mozilla Public License 2.0 at https://mozilla.org/MPL/2.0/
// © araamas

//@version=5
strategy("stoch supertrd atr 200ma", overlay=true, process_orders_on_close=true)
var B = 0
if strategy.position_size > 0 //to figure out how many bars away did buy order happen
    B += 1

if strategy.position_size == 0
    B := 0

atrPeriod = input(10, "ATR Length")
factor = input.float(3.0, "Factor", step = 0.01)

[supertrend, direction] = ta.supertrend(factor, atrPeriod)

bodyMiddle = plot((open + close) / 2, display=display.none)
upTrend = plot(direction < 0 ? supertrend : na, "Up Trend", color = color.green, style=plot.style_linebr)
downTrend = plot(direction < 0? na : supertrend, "Down Trend", color = color.red, style=plot.style_linebr)

ema = ta.ema(close, 200)
plot(ema, title="200 ema", color=color.yellow)

b = input.int(defval=14, title="length k%")
d = input.int(defval=3, title="smoothing k%")
s = input.int(defval=3, title="smoothing d%")
smooth_k = ta.sma(ta.stoch(close, high, low, b), d)
smooth_d = ta.sma(smooth_k, s)

////////////////////////////////////////////////////////////////////////////////
length = input.int(title="Length", defval=12, minval=1)
smoothing = input.string(title="Smoothing", defval="SMA", options=["RMA", "SMA", "EMA", "WMA"])
m = input(1.5, "Multiplier")
src1 = input(high)
src2 = input(low)
pline = input(true, "Show Price Lines")
col1 = input(color.blue, "ATR Text Color")
col2 = input(color.teal, "Low Text Color",inline ="1")
col3 = input(color.red, "High Text Color",inline ="2")

collong = input(color.teal, "Low Line Color",inline ="1")
colshort = input(color.red, "High Line Color",inline ="2")

ma_function(source, length) =>
	if smoothing == "RMA"
		ta.rma(source, length)
	else
		if smoothing == "SMA"
			ta.sma(source, length)
		else
			if smoothing == "EMA"
				ta.ema(source, length)
			else
				ta.wma(source, length)

a = ma_function(ta.tr(true), length) * m
x = ma_function(ta.tr(true), length) * m + src1
x2 = src2 - ma_function(ta.tr(true), length) * m

p1 = plot(x, title = "ATR Short Stop Loss", color=color.blue)
p2 = plot(x2, title = "ATR Long Stop Loss", color= color.blue)


///////////////////////////////////////////////////////////////////////////////////////////////

shortCondition = high < ema and direction == 1 and smooth_k > 80
if (shortCondition) and strategy.position_size == 0
    strategy.entry("sell", strategy.short)

longCondition = low > ema and direction == -1 and smooth_k < 20
if (longCondition) and strategy.position_size == 0
    strategy.entry("buy", strategy.long)

g = (strategy.opentrades.entry_price(0)-x2) * 2
k = (x - strategy.opentrades.entry_price(0)) * 2

if strategy.position_size > 0
    strategy.exit(id="buy exit", from_entry="buy",limit=strategy.opentrades.entry_price(0) + g, stop=x2)

if strategy.position_size < 0
    strategy.exit(id="sell exit", from_entry="sell",limit=strategy.opentrades.entry_price(0) - k, stop=x)

//plot(strategy.opentrades.entry_price(0) - k, color=color.yellow)
//plot(strategy.opentrades.entry_price(0) + g, color=color.red)