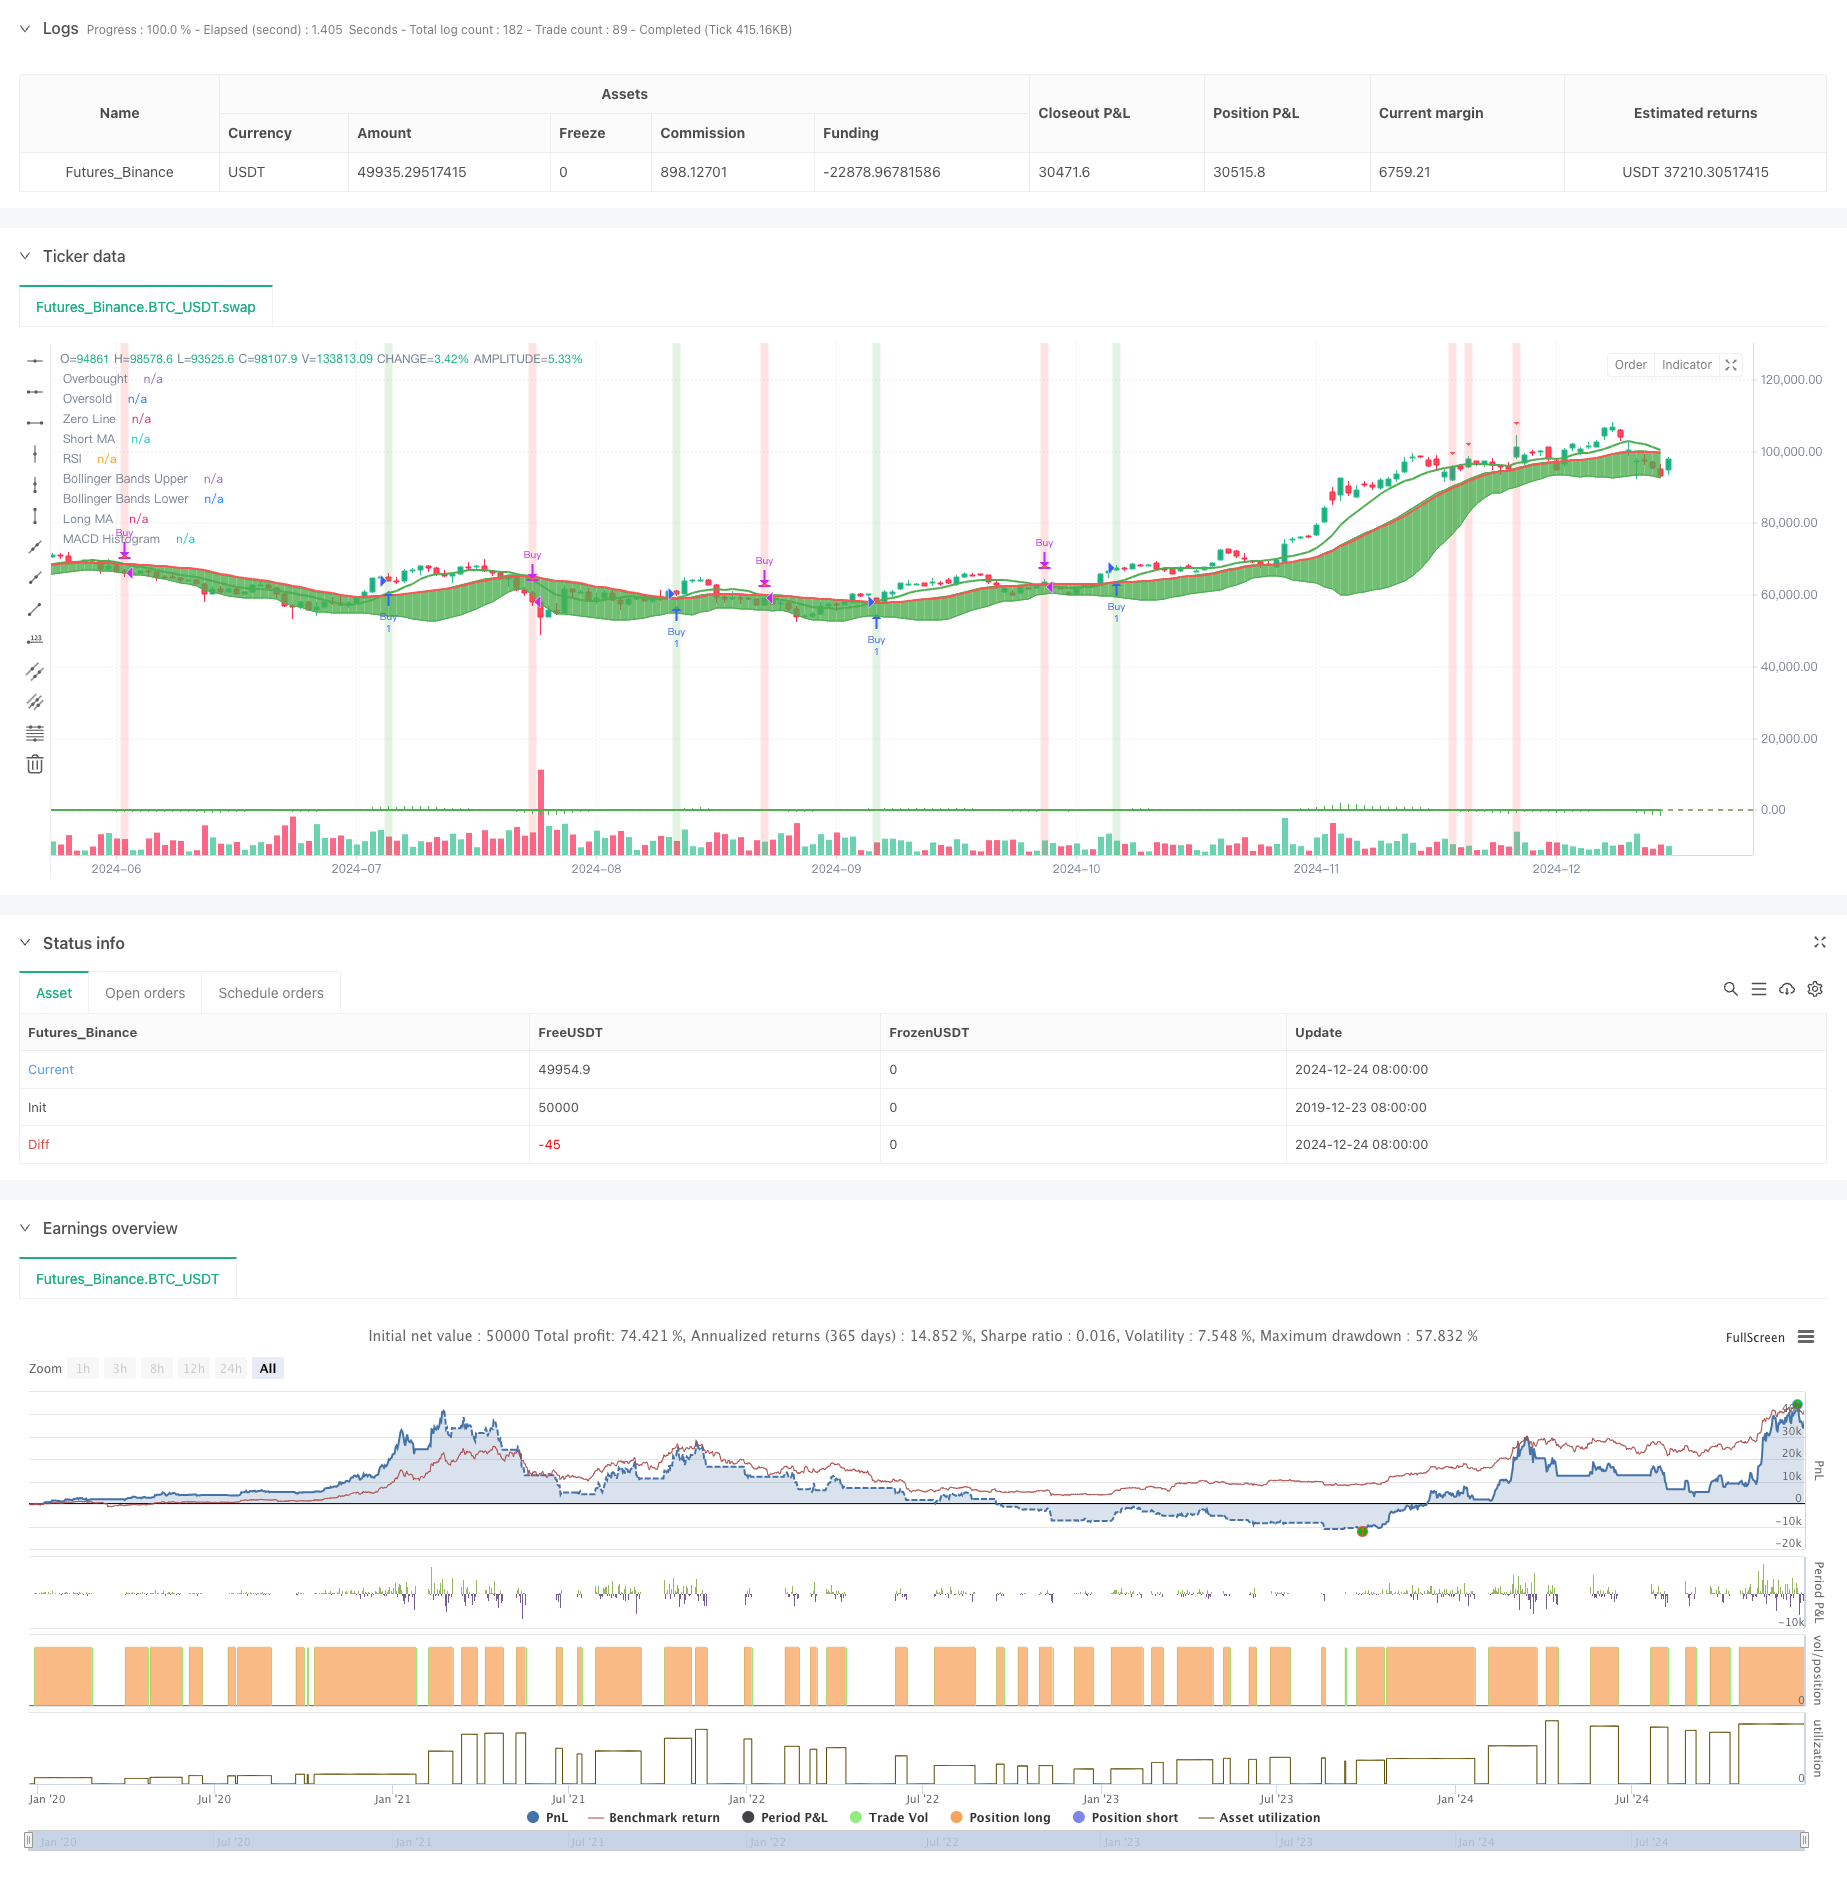
Gambaran keseluruhan
Strategi ini ialah sistem perdagangan komprehensif yang menggabungkan berbilang penunjuk teknikal klasik, termasuk purata bergerak (MA), indeks kekuatan relatif (RSI), perbezaan penumpuan purata bergerak (MACD) dan Bollinger Bands (BB). Sistem ini menggunakan kerjasama terkoordinasi penunjuk ini untuk mencari isyarat beli dan jual yang lebih tepat di pasaran, dengan itu meningkatkan kadar kejayaan urus niaga.
Prinsip Strategi
Strategi ini menggunakan mekanisme pengesahan isyarat berbilang lapisan, yang merangkumi aspek berikut:
- Tentukan arah aliran asas dengan menggunakan silang bagi purata bergerak jangka pendek (9 hari) dan jangka panjang (21 hari)
- Gunakan RSI (14 hari) untuk mengenal pasti kawasan terlebih beli dan terlebih jual, menetapkan 70 dan 30 sebagai tahap utama
- Gunakan MACD (12, 26, 9) untuk mengesahkan kekuatan arah aliran dan kemungkinan titik perubahan
- Gunakan Bollinger Bands (20 hari, 2 sisihan piawai) untuk menentukan julat turun naik harga dan potensi titik pembalikan
Sistem menjana isyarat dagangan di bawah syarat berikut:
- Isyarat beli utama: MA jangka pendek melintasi MA jangka panjang
- Isyarat jualan utama: MA jangka pendek melintasi di bawah MA jangka panjang
- Isyarat belian tambahan: RSI di bawah 30 dan histogram MACD adalah positif dan harga menyentuh Bollinger Band yang lebih rendah
- Isyarat jualan tambahan: RSI melebihi 70 dan histogram MACD adalah negatif dan harga menyentuh Bollinger Band atas
Kelebihan Strategik
- Analisis pelbagai dimensi: Dengan menyepadukan berbilang penunjuk teknikal, perspektif analisis pasaran yang lebih komprehensif disediakan
- Mekanisme pengesahan isyarat: gabungan isyarat utama dan tambahan boleh mengurangkan kesan isyarat palsu
- Kawalan risiko yang sempurna: Gunakan gabungan Bollinger Bands dan RSI untuk mengawal risiko pintu masuk
- Keupayaan menjejak trend: Melalui kerjasama MA dan MACD, kita bukan sahaja dapat memahami arah aliran utama, tetapi juga mengenal pasti titik perubahan arah aliran
- Kesan visualisasi yang kuat: Sistem ini menyediakan antara muka grafik yang jelas, termasuk gesaan warna latar belakang dan penanda bentuk
Risiko Strategik
- Histeresis isyarat: Purata bergerak itu sendiri mempunyai histeresis, yang mungkin membawa kepada titik masuk yang tidak optimum
- Risiko pasaran tidak menentu: Isyarat palsu yang kerap mungkin berlaku dalam pasaran mendatar dan tidak menentu
- Penunjuk bercanggah: Penunjuk berbilang mungkin menghasilkan isyarat bercanggah pada masa tertentu
- Kepekaan parameter: Kesan strategi adalah sensitif kepada tetapan parameter dan memerlukan pengoptimuman parameter yang mencukupi.
Arah pengoptimuman strategi
- Pelarasan parameter dinamik: Parameter setiap penunjuk boleh dilaraskan secara automatik mengikut turun naik pasaran
- Klasifikasi persekitaran pasaran: Tambah mekanisme pengiktirafan untuk persekitaran pasaran yang berbeza dan gunakan kombinasi isyarat yang berbeza di bawah keadaan pasaran yang berbeza
- Mekanisme henti rugi yang dipertingkatkan: Tambahkan skim henti rugi yang lebih fleksibel, seperti henti rugi mengekor atau henti rugi berasaskan ATR
- Pengoptimuman pengurusan kedudukan: laraskan saiz kedudukan secara dinamik berdasarkan kekuatan isyarat dan turun naik pasaran
- Penyelarasan rangka masa: Pertimbangkan untuk menambah analisis rangka masa berbilang untuk meningkatkan kebolehpercayaan isyarat
ringkaskan
Ini adalah sistem strategi perdagangan berbilang dimensi yang direka dengan baik yang menyediakan isyarat dagangan melalui sinergi pelbagai penunjuk teknikal. Kelebihan utama strategi terletak pada rangka kerja analisis yang komprehensif dan mekanisme pengesahan isyarat yang ketat, tetapi ia juga perlu memberi perhatian kepada isu seperti pengoptimuman parameter dan kebolehsuaian kepada persekitaran pasaran. Melalui arahan pengoptimuman yang disyorkan, strategi ini masih mempunyai banyak ruang untuk penambahbaikan.
/*backtest
start: 2019-12-23 08:00:00
end: 2024-12-25 08:00:00
period: 1d
basePeriod: 1d
exchanges: [{"eid":"Futures_Binance","currency":"BTC_USDT"}]
*/

//@version=5
strategy("Ultimate Buy/Sell Indicator", overlay=true)

// Inputs for Moving Averages
shortMaLength = input.int(9, title="Short MA Length", minval=1)
longMaLength = input.int(21, title="Long MA Length", minval=1)

// Inputs for RSI
rsiLength = input.int(14, title="RSI Length", minval=1)
rsiOverbought = input.int(70, title="RSI Overbought Level", minval=1, maxval=100)
rsiOversold = input.int(30, title="RSI Oversold Level", minval=1, maxval=100)

// Inputs for MACD
macdShortLength = input.int(12, title="MACD Short EMA Length", minval=1)
macdLongLength = input.int(26, title="MACD Long EMA Length", minval=1)
macdSignalSmoothing = input.int(9, title="MACD Signal Smoothing", minval=1)

// Inputs for Bollinger Bands
bbLength = input.int(20, title="Bollinger Bands Length", minval=1)
bbMultiplier = input.float(2.0, title="Bollinger Bands Multiplier", minval=0.1)

// Calculate Moving Averages
shortMa = ta.sma(close, shortMaLength)
longMa = ta.sma(close, longMaLength)

// Calculate RSI
rsi = ta.rsi(close, rsiLength)

// Calculate MACD
[macdLine, signalLine, _] = ta.macd(close, macdShortLength, macdLongLength, macdSignalSmoothing)
macdHist = macdLine - signalLine

// Calculate Bollinger Bands
[bbUpper, bbBasis, bbLower] = ta.bb(close, bbLength, bbMultiplier)

// Define colors
colorPrimary = color.new(color.green, 0)
colorSecondary = color.new(color.red, 0)
colorBackgroundBuy = color.new(color.green, 80)
colorBackgroundSell = color.new(color.red, 80)
colorTextBuy = color.new(color.green, 0)
colorTextSell = color.new(color.red, 0)

// Plot Moving Averages
plot(shortMa, color=colorPrimary, linewidth=2, title="Short MA")
plot(longMa, color=colorSecondary, linewidth=2, title="Long MA")

// Plot Bollinger Bands
bbUpperLine = plot(bbUpper, color=colorPrimary, linewidth=1, title="Bollinger Bands Upper")
bbLowerLine = plot(bbLower, color=colorPrimary, linewidth=1, title="Bollinger Bands Lower")
fill(bbUpperLine, bbLowerLine, color=color.new(colorPrimary, 90))

// Buy/Sell Conditions based on MA cross
buySignal = ta.crossover(shortMa, longMa)
sellSignal = ta.crossunder(shortMa, longMa)

// Execute Buy/Sell Orders
if buySignal
    strategy.entry("Buy", strategy.long, 1)
    strategy.close("Sell", qty_percent=1) // Close all positions when selling

if sellSignal
    strategy.close("Sell", qty_percent=1) // Close all positions when selling
    strategy.close("Buy") // Close any remaining buy positions

// Plot Buy/Sell Signals for MA crossovers
plotshape(series=buySignal, location=location.belowbar, color=colorTextBuy, style=shape.triangleup, size=size.small, title="Buy Signal")
plotshape(series=sellSignal, location=location.abovebar, color=colorTextSell, style=shape.triangledown, size=size.small, title="Sell Signal")

// Background Color based on Buy/Sell Signal for MA crossovers
bgcolor(buySignal ? colorBackgroundBuy : na, title="Buy Signal Background")
bgcolor(sellSignal ? colorBackgroundSell : na, title="Sell Signal Background")

// Plot RSI with Overbought/Oversold Levels
hline(rsiOverbought, "Overbought", color=colorSecondary, linestyle=hline.style_dashed, linewidth=1)
hline(rsiOversold, "Oversold", color=colorPrimary, linestyle=hline.style_dashed, linewidth=1)
plot(rsi, color=colorPrimary, linewidth=2, title="RSI")

// Plot MACD Histogram
plot(macdHist, color=colorPrimary, style=plot.style_histogram, title="MACD Histogram", linewidth=2)
hline(0, "Zero Line", color=color.new(color.gray, 80))

// Additional Buy/Sell Conditions based on RSI, MACD, and Bollinger Bands
additionalBuySignal = rsi < rsiOversold and macdHist > 0 and close < bbLower
additionalSellSignal = rsi > rsiOverbought and macdHist < 0 and close > bbUpper

// Plot Additional Buy/Sell Signals
plotshape(series=additionalBuySignal and not buySignal, location=location.belowbar, color=colorTextBuy, style=shape.triangleup, size=size.small, title="Additional Buy Signal")
plotshape(series=additionalSellSignal and not sellSignal, location=location.abovebar, color=colorTextSell, style=shape.triangledown, size=size.small, title="Additional Sell Signal")

// Background Color based on Additional Buy/Sell Signal
bgcolor(additionalBuySignal and not buySignal ? colorBackgroundBuy : na, title="Additional Buy Signal Background")
bgcolor(additionalSellSignal and not sellSignal ? colorBackgroundSell : na, title="Additional Sell Signal Background")