Negociação Quantitativa de Criptomoedas para iniciantes - Levá-lo mais perto da Criptomoeda Quantitativa (5)
Autora:FMZ~Lydia, Criado: 2022-08-03 16:08:50, Atualizado: 2023-09-21 21:07:02
No artigo anterior, explicamos a análise lógica de negociação de uma estratégia de grade simples.
-
Análise da lógica de negociação Como mencionamos no artigo anterior, você pode desencadear uma ação comercial atravessando cada linha da grade e julgando a passagem do preço atual acima ou abaixo.
O primeiro detalhe que temos que considerar é o projeto da grade infinita.
createNetEsta função gera uma estrutura de dados de grade com um número finito de linhas de grade. Então, e se o preço vai além dos limites desta estrutura de dados de grade (além da linha de grade superior onde o preço é o mais alto, e a linha de grade inferior onde o preço é o mais baixo) quando a estratégia está sendo executada? Então precisamos adicionar um mecanismo de extensão à estrutura de dados da grade primeiro.Vamos começar a escrever a função principal da estratégia, que é o código onde a estratégia começa a ser executada
var diff = 50                                 // Global variables and grid spacing can be designed as parameters for easy explanation. We write this parameter into the code.
function main() {
    // After the real bot starts running, execute the strategy code from here
    var ticker = _C(exchange.GetTicker)       // To get the latest market data ticker, please refer to the FMZ API documentation for the structure of the ticker data: https://www.fmz.com/api#ticker
    var net = createNet(ticker.Last, diff)    // The function we designed in the previous article to construct the grid data structure initially, here we construct a grid data structure net

    while (true) {                            // Then the program logic enters this while infinite loop, and the strategy execution will continue to execute the code within the {} symbol here.
        ticker = _C(exchange.GetTicker)       // The first line of the infinite loop code section, get the latest market data and update it to the ticker variable
        // Check the grid range
        while (ticker.Last >= net[net.length - 1].price) {
            net.push({
                buy : false,
                sell : false,
                price : net[net.length - 1].price + diff,
            })
        }
        while (ticker.Last <= net[0].price) {
            var price = net[0].price - diff
            if (price <= 0) {
                break
            }
            net.unshift({
                buy : false,
                sell : false,
                price : price,
            })
        }

        // There are other codes...
    }
}
Para tornar a estrutura de dados de rede extensivel, é necessário este código (extraído do código acima):
      // Check the grid range
      while (ticker.Last >= net[net.length - 1].price) {   // If the price exceeds the grid line of the highest price of the grid
          net.push({                                       // Just add a new grid line after the grid line with the highest price of the grid
              buy : false,                                 // Initialize sell marker
              sell : false,                                // Initialize buy marker
              price : net[net.length - 1].price + diff,    // dd a grid spacing to the previous highest price
          })
      }
      while (ticker.Last <= net[0].price) {                // If the price is lower than the grid line of the lowest price of the grid
          var price = net[0].price - diff                  // Different from adding upwards, it should be noted that the price of adding new grid lines downwards cannot be less than or equal to 0, so it is necessary to judge here
          if (price <= 0) {                                // Less than or equal to 0 will not be added, jump out of this loop
              break
          }
          net.unshift({                                    // Add a new grid line just before the grid line with the lowest price of the grid
              buy : false,
              sell : false,
              price : price,
          })
      }
O próximo passo é considerar como implementar especificamente o gatilho de negociação.
var diff = 50
var amount = 0.002       // Add a global variable, which can also be designed as a parameter. Of course, for the sake of simplicity, we also write it in the strategy code.
                         // This parameter controls the trade volume each time a trade is triggered on the grid line
function main() {
    var ticker = _C(exchange.GetTicker)
    var net = createNet(ticker.Last, diff)
    var preTicker = ticker       // Before the main loop (fixed loop) starts, set a variable to record the last market data
    while (true) {
        ticker = _C(exchange.GetTicker)
        // Check the grid range
        while (ticker.Last >= net[net.length - 1].price) {
            net.push({
                buy : false,
                sell : false,
                price : net[net.length - 1].price + diff,
            })
        }
        while (ticker.Last <= net[0].price) {
            var price = net[0].price - diff
            if (price <= 0) {
                break
            }
            net.unshift({
                buy : false,
                sell : false,
                price : price,
            })
        }

        // Retrieve grid
        for (var i = 0 ; i < net.length ; i++) {     // Iterate over all grid lines in the grid data structure
            var p = net[i]
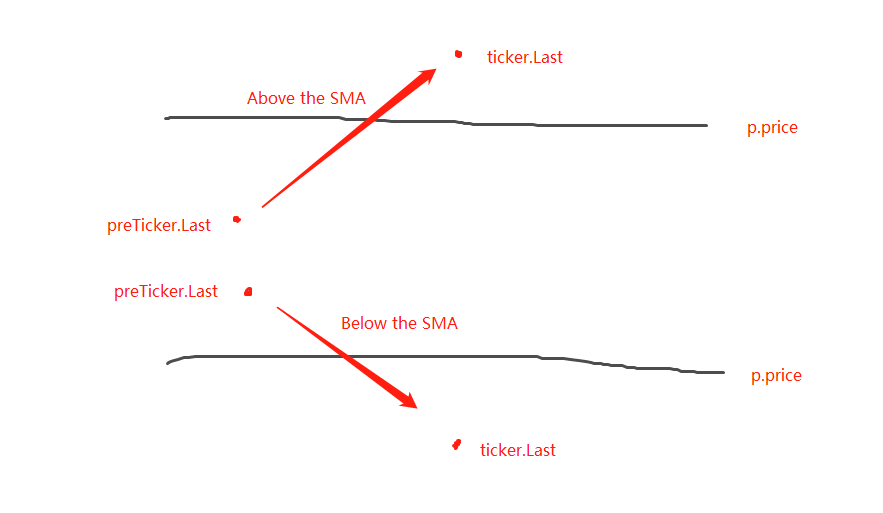
            if (preTicker.Last < p.price && ticker.Last > p.price) {         // Above the SMA, sell, the current node has already traded, regardless of SELL BUY, it will no longer be traded
                if (i != 0) {
                    var downP = net[i - 1]
                    if (downP.buy) {
                        exchange.Sell(-1, amount, ticker)
                        downP.buy = false
                        p.sell = false
                        continue
                    }
                }
                if (!p.sell && !p.buy) {
                    exchange.Sell(-1, amount, ticker)
                    p.sell = true
                }
            } else if (preTicker.Last > p.price && ticker.Last < p.price) {  // Below the SMA, buy
                if (i != net.length - 1) {
                    var upP = net[i + 1]
                    if (upP.sell) {
                        exchange.Buy(-1, amount * ticker.Last, ticker)
                        upP.sell = false
                        p.buy = false
                        continue
                    }
                }
                if (!p.buy && !p.sell) {
                    exchange.Buy(-1, amount * ticker.Last, ticker)
                    p.buy = true
                }
            }
        }
        preTicker = ticker    // Record the current market data in preTicker, and in the next cycle, use it as a comparison between the "previous" market data and the latest one to judge whether to be above the SMA or below the SMA.
        Sleep(500)
    }
}
Pode-se observar que:
- Condição para a travessia acima das linhas da grade:
preTicker.Last < p.price && ticker.Last > p.price - Condição para a travessia abaixo das linhas da grade:
preTicker.Last > p.price && ticker.Last < p.price
Isto é o que dissemos no post anterior:
- Condição para a travessia acima das linhas da grade:

Julgar se deve estar acima ou abaixo da SMA é apenas o primeiro passo para julgar se uma ordem pode ser colocada, e também é necessário julgar as marcas nos dados da linha da rede.
Se estiver acima da SMA, julga-se que o preço é menor do que a linha de rede atual e a marca de compra na linha de rede mais próxima.
Depois de julgar as condições, se não houver gatilho, continue a julgar. Se as marcas de compra/venda na linha da grade atual forem ambas falsas, isso significa que a linha da grade atual pode ser negociada. Uma vez que está acima da SMA, realizaremos uma operação de venda aqui. Após a execução, marque a marca de venda da linha da grade atual como verdadeira.
A lógica de processamento é a mesma para estar abaixo da SMA (esquerda para os iniciantes a pensar sobre aqui).
Backtesting da estratégia completa
A fim de ver alguns dados durante backtesting, uma funçãoshowTblé escrito para exibir os dados.
function showTbl(arr) {
    var tbl = {
        type : "table",
        title : "grid",
        cols : ["grid information"],
        rows : []
    }
    var arrReverse = arr.slice(0).reverse()
    _.each(arrReverse, function(ele) {
        var color = ""
        if (ele.buy) {
            color = "#FF0000"
        } else if (ele.sell) {
            color = "#00FF00"
        }
        tbl.rows.push([JSON.stringify(ele) + color])
    })
    LogStatus(_D(), "\n`" + JSON.stringify(tbl) + "`", "\n account Information:", exchange.GetAccount())
}
Código completo da estratégia:
/*backtest
start: 2021-04-01 22:00:00
end: 2021-05-22 00:00:00
period: 1d
basePeriod: 1m
exchanges: [{"eid":"OKEX","currency":"ETH_USDT","balance":100000}]
*/

var diff = 50
var amount = 0.002
function createNet(begin, diff) {
    var oneSideNums = 10
    var up = []
    var down = []
    for (var i = 0 ; i < oneSideNums ; i++) {
        var upObj = {
            buy : false,
            sell : false,
            price : begin + diff / 2 + i * diff,
        }
        up.push(upObj)

        var j = (oneSideNums - 1) - i
        var downObj = {
            buy : false,
            sell : false,
            price : begin - diff / 2 - j * diff,
        }
        if (downObj.price <= 0) {  // The price cannot be less than or equal to 0
            continue
        }
        down.push(downObj)
    }

    return down.concat(up)
}

function showTbl(arr) {
    var tbl = {
        type : "table",
        title : "grid",
        cols : ["grid Information"],
        rows : []
    }
    var arrReverse = arr.slice(0).reverse()
    _.each(arrReverse, function(ele) {
        var color = ""
        if (ele.buy) {
            color = "#FF0000"
        } else if (ele.sell) {
            color = "#00FF00"
        }
        tbl.rows.push([JSON.stringify(ele) + color])
    })
    LogStatus(_D(), "\n`" + JSON.stringify(tbl) + "`", "\n account Information:", exchange.GetAccount())
}

function main() {
    var ticker = _C(exchange.GetTicker)
    var net = createNet(ticker.Last, diff)
    var preTicker = ticker
    while (true) {
        ticker = _C(exchange.GetTicker)
        // Check the grid range
        while (ticker.Last >= net[net.length - 1].price) {
            net.push({
                buy : false,
                sell : false,
                price : net[net.length - 1].price + diff,
            })
        }
        while (ticker.Last <= net[0].price) {
            var price = net[0].price - diff
            if (price <= 0) {
                break
            }
            net.unshift({
                buy : false,
                sell : false,
                price : price,
            })
        }

        // Retrieve grid
        for (var i = 0 ; i < net.length ; i++) {
            var p = net[i]
            if (preTicker.Last < p.price && ticker.Last > p.price) {         // Being above the SMA, sell, the current node has already traded, regardless of SELL BUY, it will no longer be traded
                if (i != 0) {
                    var downP = net[i - 1]
                    if (downP.buy) {
                        exchange.Sell(-1, amount, ticker)
                        downP.buy = false
                        p.sell = false
                        continue
                    }
                }
                if (!p.sell && !p.buy) {
                    exchange.Sell(-1, amount, ticker)
                    p.sell = true
                }
            } else if (preTicker.Last > p.price && ticker.Last < p.price) {  // Being below the SMA, buy
                if (i != net.length - 1) {
                    var upP = net[i + 1]
                    if (upP.sell) {
                        exchange.Buy(-1, amount * ticker.Last, ticker)
                        upP.sell = false
                        p.buy = false
                        continue
                    }
                }
                if (!p.buy && !p.sell) {
                    exchange.Buy(-1, amount * ticker.Last, ticker)
                    p.buy = true
                }
            }
        }

        showTbl(net)
        preTicker = ticker
        Sleep(500)
    }
}
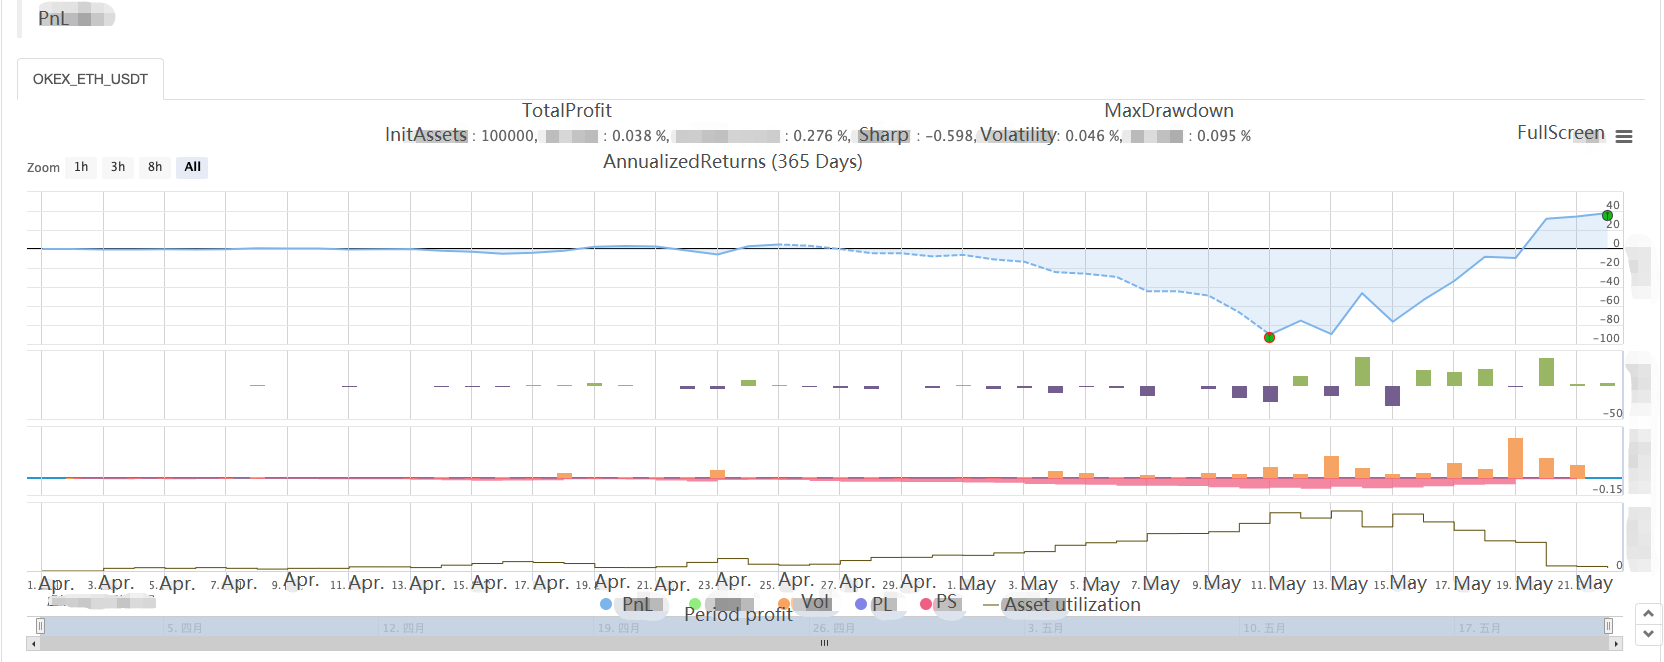
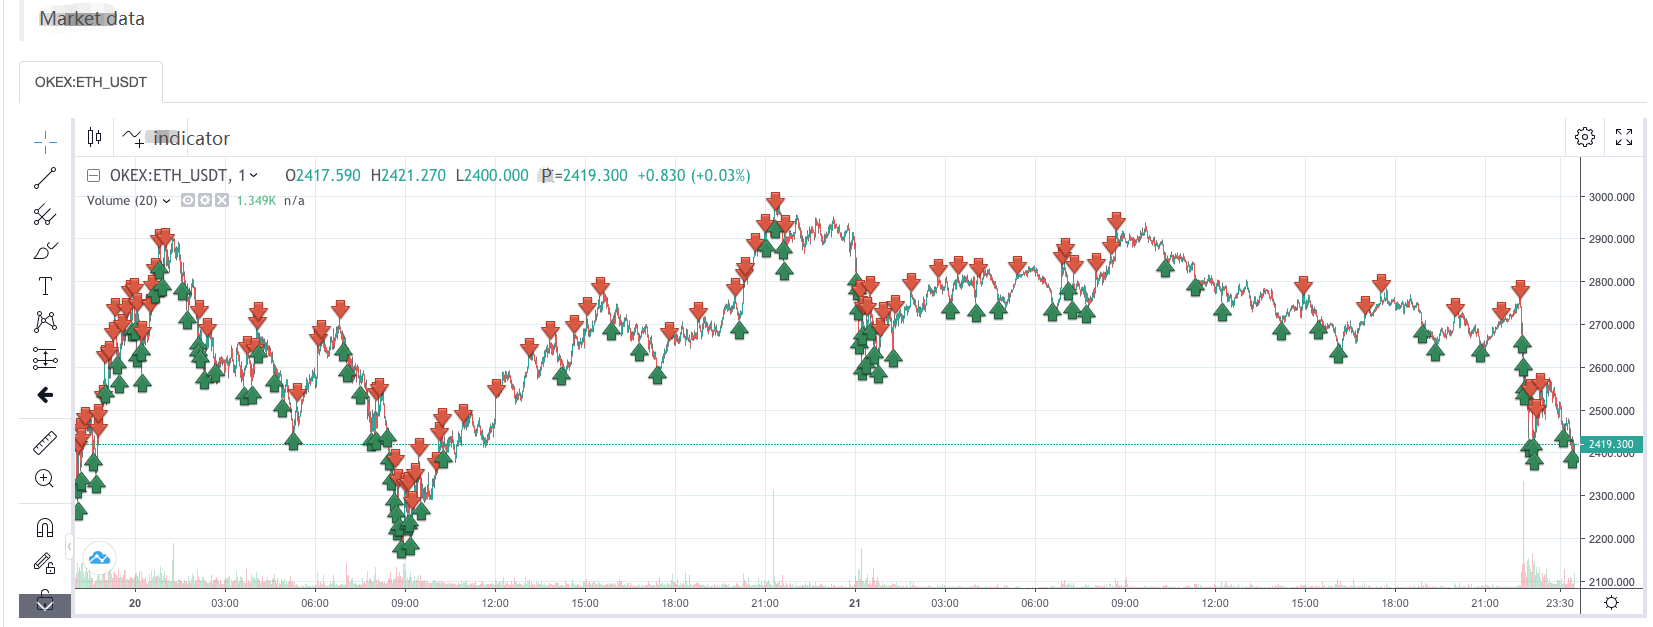
Estratégia de backtesting:


Podemos ver as características da estratégia da rede, quando há um mercado em tendência, haverá uma grande perda flutuante, e o lucro vai se recuperar em um mercado volátil.
Por conseguinte, a estratégia de rede não é isenta de risco. A estratégia spot ainda pode ser
- Introdução ao conjunto de Lead-Lag na moeda digital (3)
- Introdução à arbitragem de lead-lag em criptomoedas (2)
- Introdução ao suporte de Lead-Lag na moeda digital (2)
- Discussão sobre a recepção de sinais externos da plataforma FMZ: uma solução completa para receber sinais com serviço HTTP em estratégia
- Discussão da recepção de sinais externos da plataforma FMZ: estratégias para o sistema completo de recepção de sinais do serviço HTTP embutido
- Introdução à arbitragem de lead-lag em criptomoedas (1)
- Introdução ao suporte de Lead-Lag na moeda digital
- Discussão sobre a recepção de sinais externos da plataforma FMZ: API estendida VS estratégia Serviço HTTP integrado
- Exploração da recepção de sinais externos da plataforma FMZ: API de extensão vs estratégia de serviços HTTP embutidos
- Discussão sobre o método de teste de estratégia baseado no gerador de tickers aleatórios
- Métodos de teste de estratégias baseados em geradores de mercado aleatórios
- Modelo de fatores de moeda digital
- Seja seu próprio salvador no negócio.
- Estratégia de cobertura de futuros e spot manuais de criptomoedas
- Conceção de uma estratégia de cobertura spot de criptomoedas (1)
- Uma estratégia de equilíbrio perpétuo adequada para um mercado de baixa
- Negociação Quantitativa de Criptomoedas para iniciantes - Levá-lo mais perto da Quantitativa de Criptomoedas (8)
- Negociação Quantitativa de Criptomoedas para iniciantes - Levá-lo mais perto de Criptomoeda Quantitativa (7)
- Negociação quantitativa de criptomoedas para iniciantes - aproximando-o da negociação quantitativa de criptomoedas (6)
- Visão geral e arquitetura da interface principal da plataforma de negociação quântica FMZ
- Projeto de estratégia Martingale para futuros de criptomoedas
- Negociação quantitativa de criptomoedas para iniciantes - aproximando-o da negociação quantitativa de criptomoedas (4)
- Negociação Quantitativa de Criptomoedas para iniciantes - Levá-lo mais perto da Criptomoeda Quantitativa (3)
- Negociação Quantitativa de Criptomoedas para iniciantes - Levá-lo mais perto de Criptomoeda Quantitativa (2)
- Negociação Quantitativa de Criptomoedas para iniciantes - Levá-lo mais perto de Criptomoeda Quantitativa (1)
- Projeto de estratégia de cobertura spot de criptomoedas (2)
- Exemplo de contrato de acesso ao protocolo geral na FMZ
- Compartilhamento lógico de estratégias de arbitragem de spread spot de várias bolsas
- Módulo de visualização para construir estratégias de negociação - em profundidade
- Use a função KLineChart para facilitar o desenho de estratégias
- Usar a função KlineChart para simplificar o desenho de gráficos de estratégias