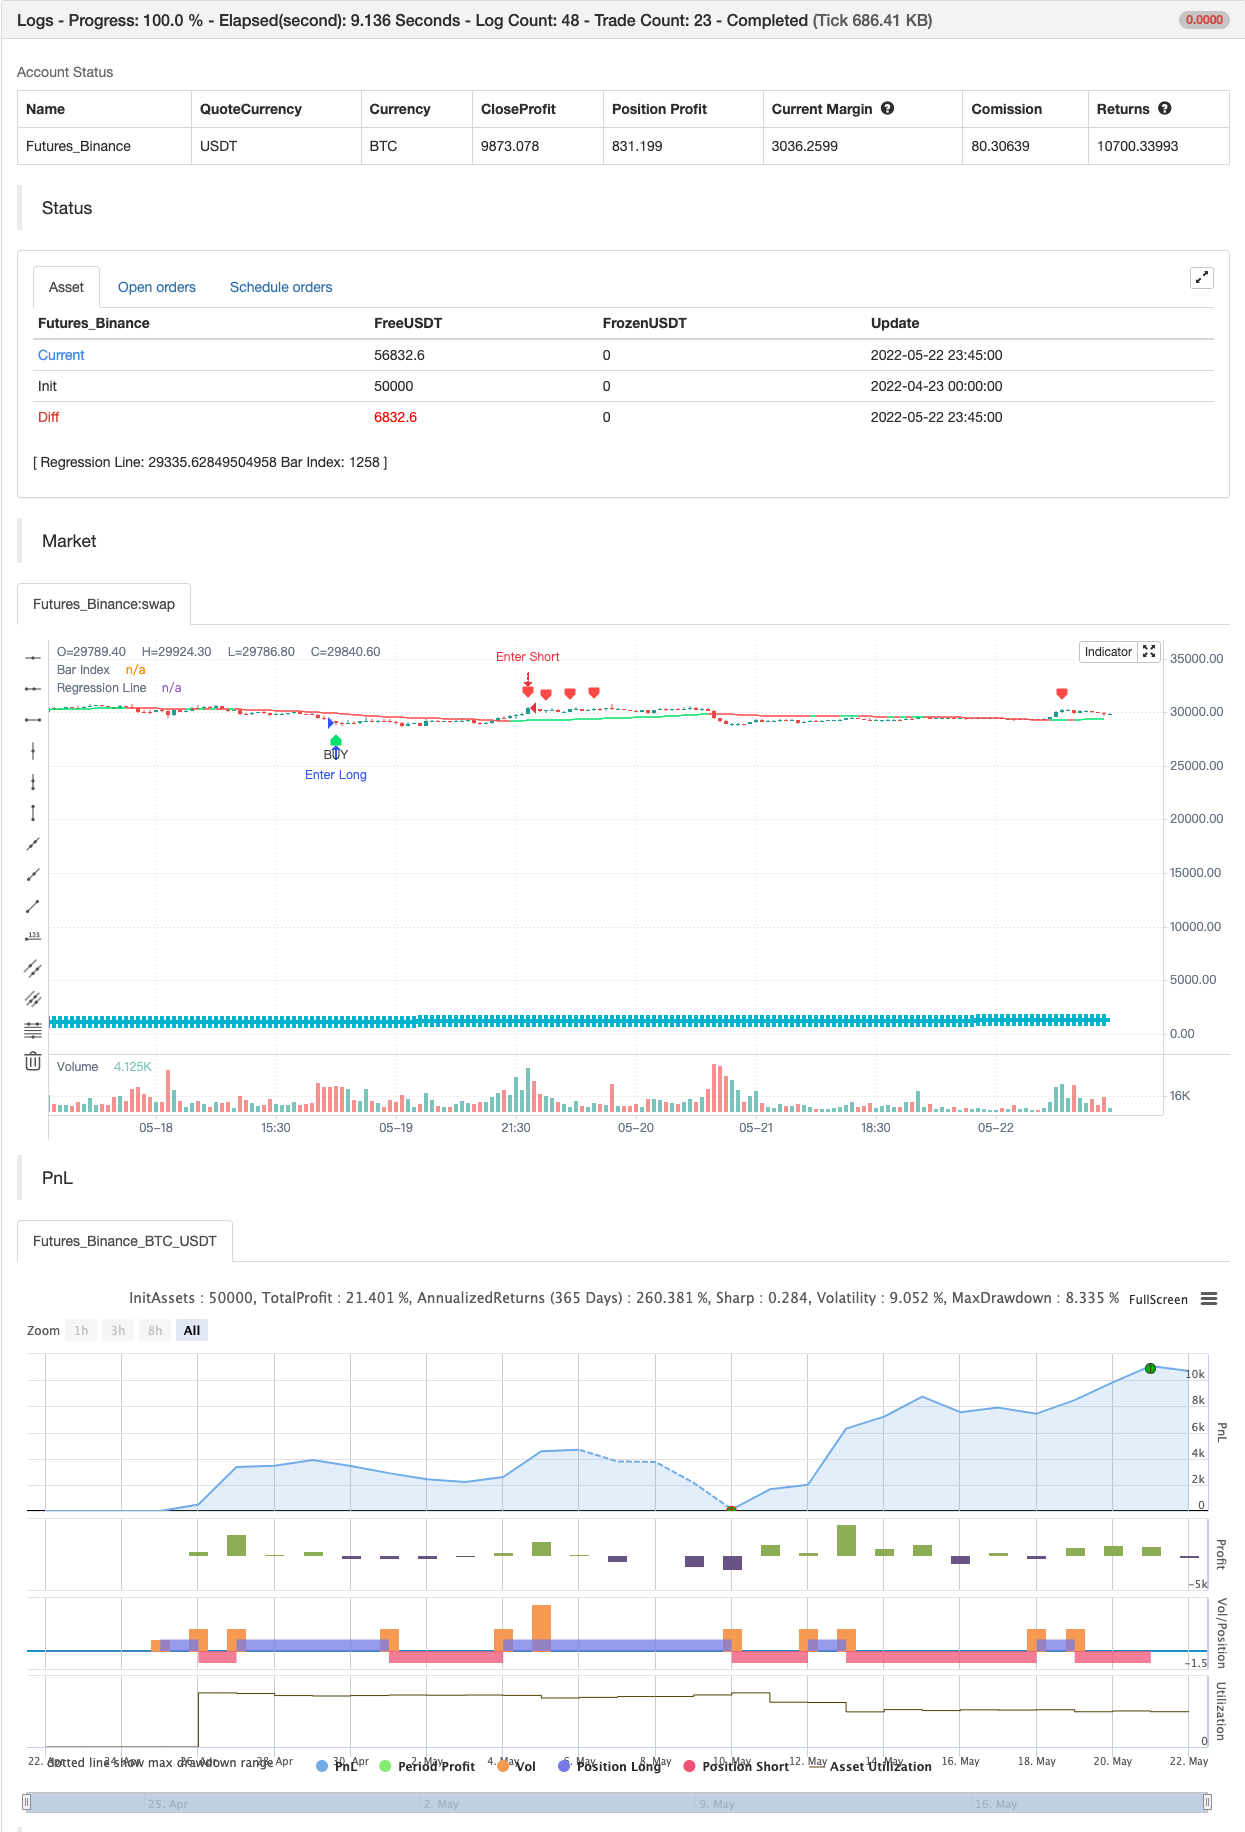
Regressão linear ++
Autora:ChaoZhang, Data: 24 de Maio de 2022Tags:DEV
UE à procura pública
Fórmula de regressão linear Cálculo raspado com alertas
Aqui está o script de regressão linear para os traders que gostam de recursos ricos
Características ++ Multi-frame de tempo -> Regressão de fonte de um gráfico diferente ++ Cores personalizadas -> Isso inclui as linhas de pinheiros ++ Smoothing -> Permitir Regressão Filtrada; Nota: Usando 1 Defaults para a linha original. ++ Alertas sobre cruzamento de canal/intervalo
Utilização ++ Use isto para BreakOuts e Reverses ++ Este script não deve ser usado Independentemente
Riscos Por favor, note que este script é como as bandas de Bollinger e representa um risco de cair em uma faixa de tendência. Os sinais podem continuar a correr na mesma direcção enquanto o mercado está a reverter.
Pedidos Se tiverem quaisquer pedidos, comentem abaixo ou enviem-me um e-mail. Sinta-se à vontade para utilizar este em seu gráfico e compartilhar suas ideias
Para os desenvolvedores que querem usar isso em seu gráfico, por favor use este script A fórmula original para o cálculo é colocada ali.
Espero que gostem disto.
backtest

/*backtest
start: 2022-04-23 00:00:00
end: 2022-05-22 23:59:00
period: 45m
basePeriod: 5m
exchanges: [{"eid":"Futures_Binance","currency":"BTC_USDT"}]
*/

// This source code is subject to the terms of the Mozilla Public License 2.0 at https://mozilla.org/MPL/2.0/
// © LucemAnb
// User Version

//@version=4
study("Linear Regression ++ [Lucem Anb]", "Lin Reg ++ [Lucem Anb]", overlay=true)


source      = input(close)
length      = input(100, minval=1)
offset      = input(0, minval=0)
dev         = input(2.0, "Deviation")
smoothing   = input(1, minval=1)
mtf_val     = input("", "Resolution", input.resolution)
line_thick  = input(4, "S&R Thickness", minval=1, maxval=4)
signals     = input("Recent", "Signals Display", options=["Recent", "All"])
p           = input("Lime", "Up Color", options=["Red", "Lime", "Orange", "Teal", "Yellow", "White", "Black"])
q           = input("Red", "Down Color", options=["Red", "Lime", "Orange", "Teal", "Yellow", "White", "Black"])
goto        = input(0, "End At Bar Index")

cc(x) => x=="Red"?color.red:x=="Lime"?color.lime:x=="Orange"?color.orange:x=="Teal"?
 color.teal:x=="Yellow"?color.yellow:x=="Black"?color.black:color.white
data(x) => sma(security(syminfo.tickerid, mtf_val!="" ? mtf_val : timeframe.period, x), smoothing)

linreg = data(linreg(source, length, offset))
linreg_p = data(linreg(source, length, offset+1))
plot(linreg, "Regression Line", cc(linreg>linreg[1]?p:q), editable=false)

x = bar_index
slope = linreg - linreg_p
intercept = linreg - x*slope
deviationSum = 0.0
for i=0 to length-1
    deviationSum:= deviationSum + pow(source[i]-(slope*(x-i)+intercept), 2)
deviation = sqrt(deviationSum/(length))
x1 = x-length
x2 = x
y1 = slope*(x-length)+intercept
y2 = linreg

updating = goto <= 0 or x < goto


dm_current = -deviation*dev + y2
dp_current = deviation*dev + y2
buy = crossunder(close, dm_current)
sell = crossover(close, dp_current)
alertcondition(buy, "Buy Lin Reg", "Crossing On the Lower Regression Channel")
alertcondition(sell, "Sell Lin Reg", "Crossing On the Higher Regression Channel")

plotshape(buy, "BUY", shape.labelup, location.belowbar, color.lime, text='BUY', textcolor=color.black, show_last=signals=="All"?99999999:length)
plotshape(sell, "SELL", shape.labeldown, location.abovebar, color.red, text='SELL', textcolor=color.white, show_last=signals=="All"?99999999:length)

plot(x, "Bar Index", color.aqua, line_thick, plot.style_cross, display=display.none)

if buy
    strategy.entry("Enter Long", strategy.long)
else if sell
    strategy.entry("Enter Short", strategy.short)
- Estratégia de reversão média
- Estratégia de negociação de DEV de desvio-padrão baseada no índice de força relativa RSI e na SMA média móvel simples
- Detector de pico
- Super tendência B
- Instrumento de negociação Swing Scalping R1-4
- A melhor estratégia de engolf + escape
- Alerta Bollinger Awesome R1
- Plugins para a partilha de várias bolsas
- Triângulo de diferença (ou seja, a diferença de preço de mercado de pequenas moedas)
- Grades dinâmicas de contrato inverso bybit (grades específicas)
- Alertas de tradingView para MT4 MT5 + variáveis dinâmicas
- Série de matriz
- Super Scalper - 5 Min 15 Min
- Índice de Força Relativa - Divergências - Libertus
- RedK Dual VADER com barras de energia
- Zonas de consolidação - ao vivo
- Estimativa quantitativa
- Alerta cruzada média móvel, multi-tempo (MTF)
- Estratégia de recarga do MACD
- Média móvel supertrendada
- Comércio ABC
- 15 MIN BTCUSDTPERP BOT
- Entropia de Shannon V2
- Supertrend ATR COM TRAILING STOP LOSS