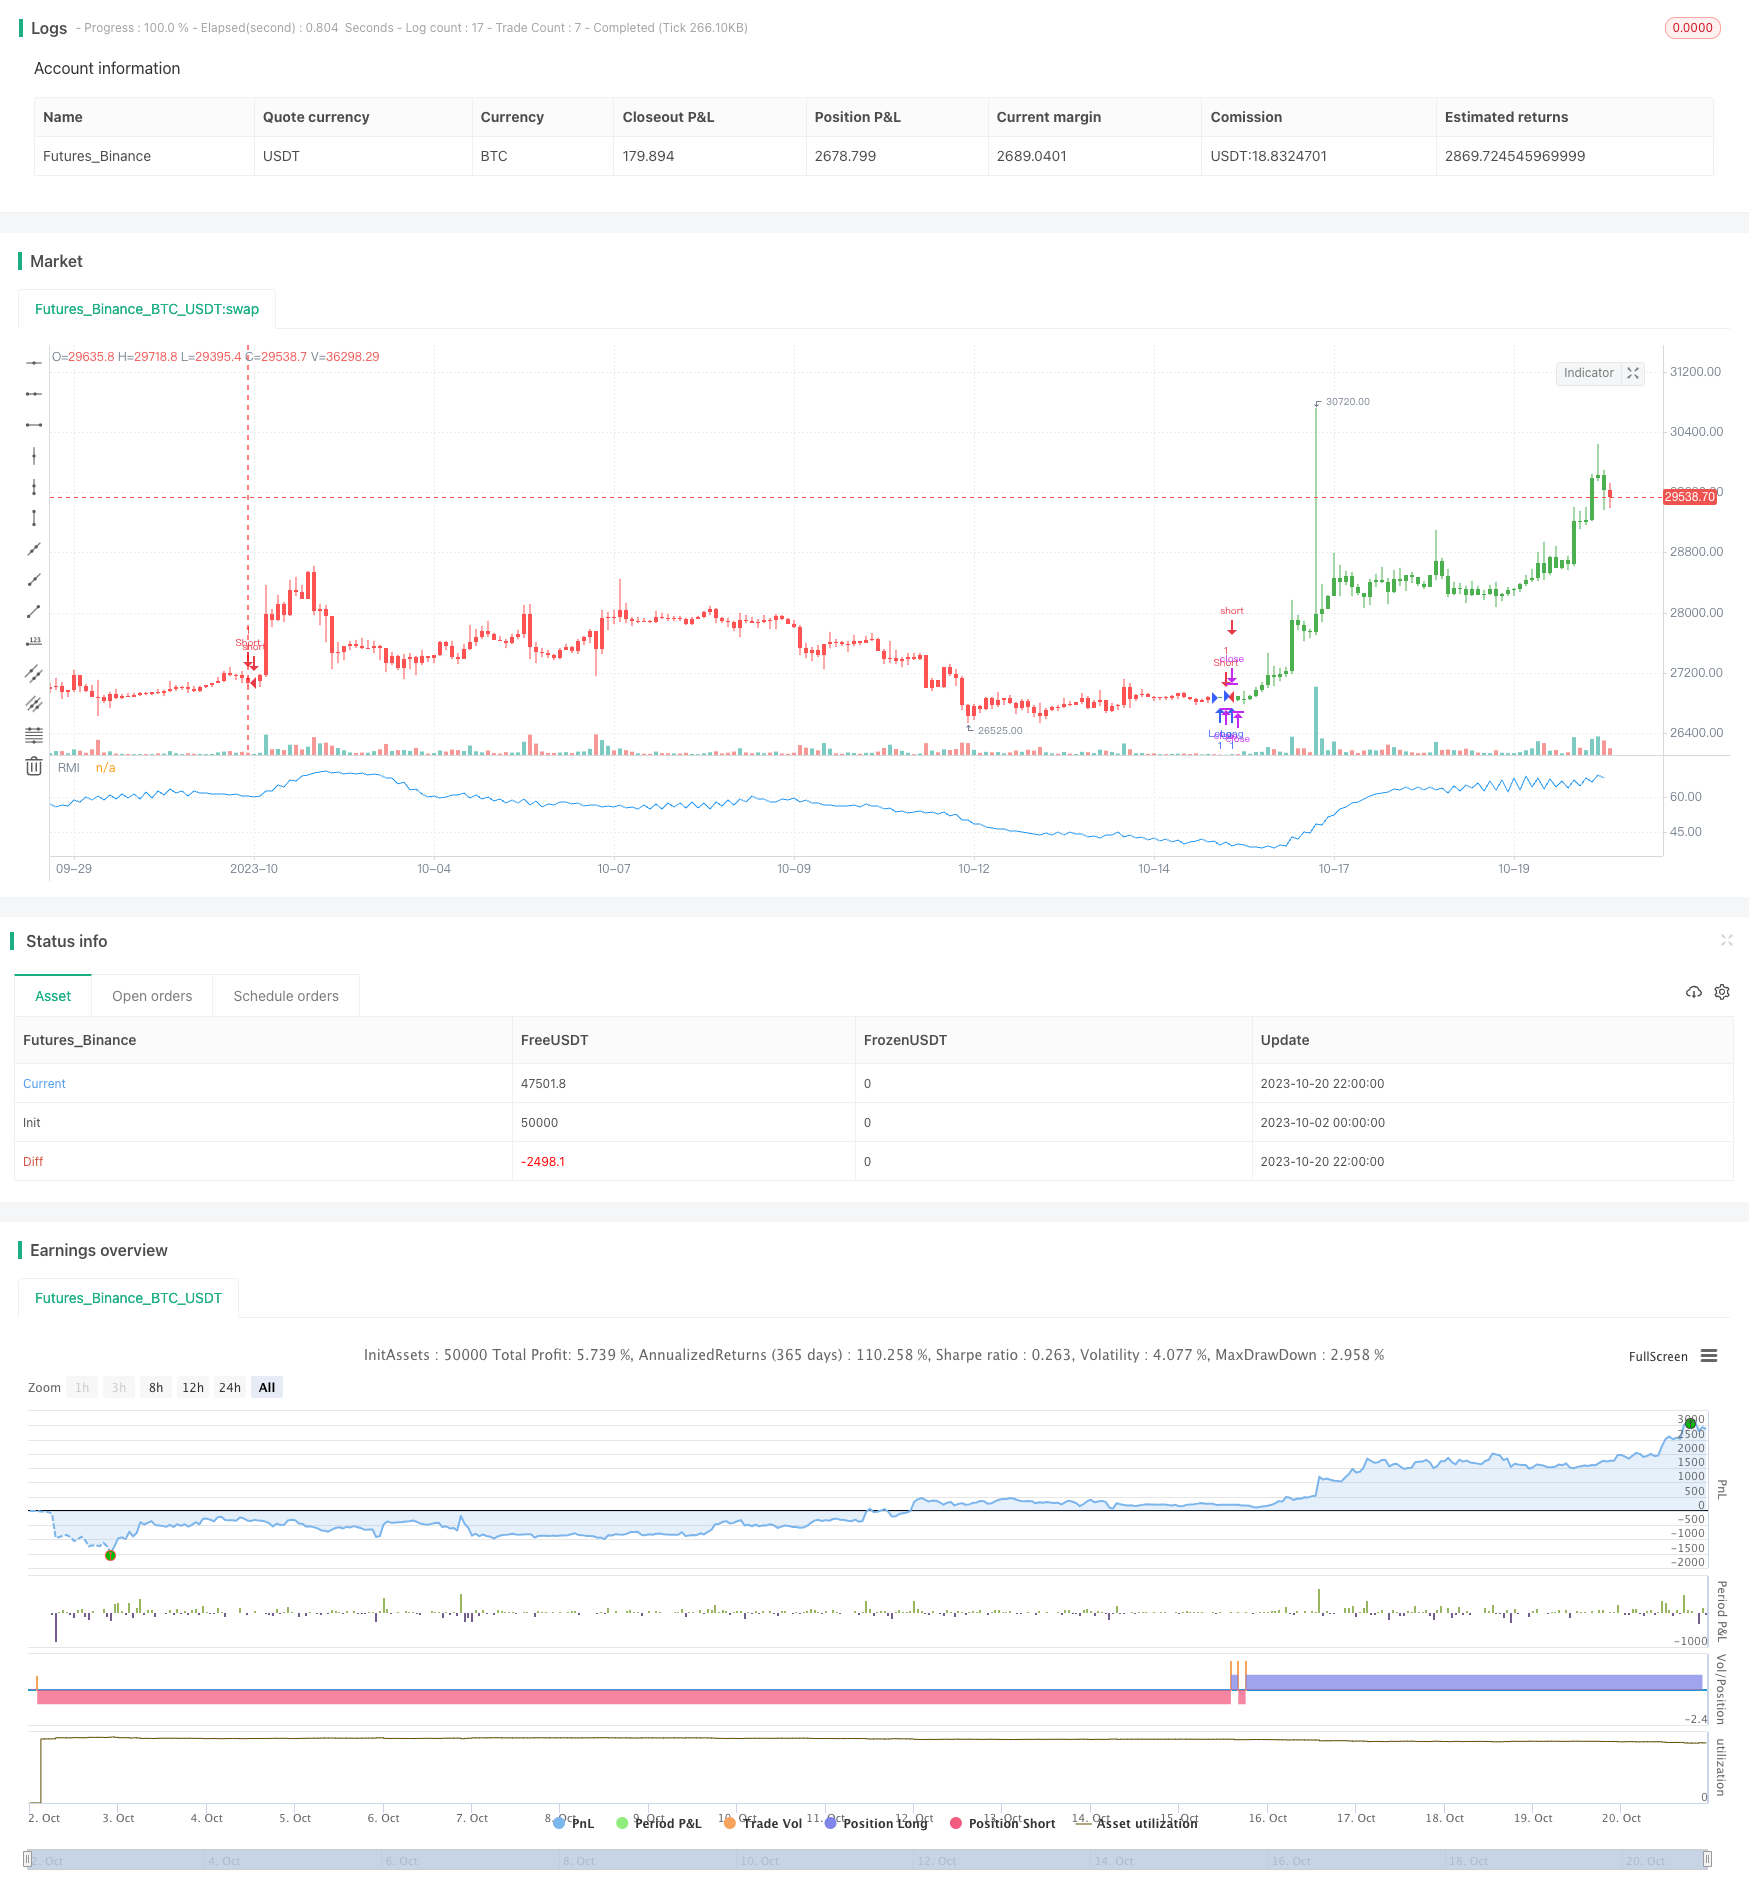
Estratégia do índice de ímpeto relativo
Autora:ChaoZhang, Data: 2023-11-02 17:21:45Tags:

Resumo
A estratégia Relative Momentum Index (RMI) é uma versão aprimorada baseada no índice de momento.
Estratégia lógica
A fórmula de cálculo do IMR é a seguinte:
xMom = xPrice - xPrice[Length]  // Price change over Length periods
xMU = If xMom >= 0: previous xMU minus xMU/Length plus xMom; else: previous xMU
xMD = If xMom <= 0: previous xMD minus xMD/Length plus absolute value of xMom; else: 0
RM = xMU / xMD
RMI = 100 * (RM / (1 + RM))
Primeiro, calcule a mudança de preço xMom ao longo de períodos de comprimento. Se xMom>=0, o que significa que o preço sobe, acumule-o em xMU; se xMom<0, o que significa que o preço cai, acumule seu valor absoluto em xMD. RM é a relação entre xMU e xMD, representando o impulso dos altos e baixos.
Quando o RMI é superior ao limiar SellZone, o mercado está sobrecomprado, vá curto.
Vantagens
- Em comparação com o RSI, o RMI é mais sensível e pode capturar oportunidades de reversão mais cedo.
- O RMI mede a dinâmica dos altos e baixos, menos afectados pela consolidação.
- Com base na dinâmica, o RMI pode determinar melhor o estado de sobrecompra/supervenda.
Riscos
- Como outras estratégias de reversão, o RMI corre o risco de ser interrompido por tendências fortes.
- Os parâmetros do RMI devem ser otimizados para diferentes produtos, caso contrário, os resultados podem ser pobres.
- Os limiares de sobrecompra/supervenda devem ser estabelecidos de forma razoável, caso contrário, podem ocorrer muitos sinais falsos.
Os riscos podem ser reduzidos através do alargamento do stop loss, da otimização dos parâmetros, da combinação com estratégias de tendência, etc.
Melhoria
A estratégia RMI pode ser melhorada a partir dos seguintes aspectos:
- Otimizar o parâmetro de comprimento para maximizar o retorno.
- Otimizar os limiares de sobrecompra/supervenda para reduzir os falsos sinais.
- Adicionar stop loss para controlar a perda única.
- Combine com estratégias de tendência ou média móvel para aumentar a taxa de ganho.
- Selecionar sessões de negociação adequadas com base nas características do produto para melhorar a estabilidade.
Conclusão
A estratégia RMI capta oportunidades de retração de curto prazo, medindo a mudança de momento do preço. Em comparação com o RSI, o RMI é mais sensível e robusto à consolidação. Mas existem riscos de ser parado. Os parâmetros precisam ser otimizados e combinados com estratégias de tendência para maximizar o desempenho.
/*backtest
start: 2023-10-02 00:00:00
end: 2023-10-21 00:00:00
period: 2h
basePeriod: 15m
exchanges: [{"eid":"Futures_Binance","currency":"BTC_USDT"}]
*/

//@version=2
////////////////////////////////////////////////////////////
//  Copyright by HPotter v1.0 19/10/2017
// The Relative Momentum Index (RMI) was developed by Roger Altman. Impressed
// with the Relative Strength Index's sensitivity to the number of look-back
// periods, yet frustrated with it's inconsistent oscillation between defined
// overbought and oversold levels, Mr. Altman added a momentum component to the RSI.
// As mentioned, the RMI is a variation of the RSI indicator. Instead of counting
// up and down days from close to close as the RSI does, the RMI counts up and down
// days from the close relative to the close x-days ago where x is not necessarily
// 1 as required by the RSI). So as the name of the indicator reflects, "momentum" is
// substituted for "strength".
//
// You can change long to short in the Input Settings
// WARNING:
// - For purpose educate only
// - This script to change bars colors.
////////////////////////////////////////////////////////////
strategy(title="Relative Momentum Index", shorttitle="RMI")
xPrice = close
Length = input(20, minval=1)
BuyZone = input(40, minval=1)
SellZone = input(70, minval=1)
reverse = input(false, title="Trade reverse")
// hline(0, color=gray, linestyle=dashed)
// hline(SellZone, color=red, linestyle=line)
// hline(BuyZone, color=green, linestyle=line)
xMom = xPrice - xPrice[Length]
xMU = iff(xMom >= 0, nz(xMU[1], 1) - (nz(xMU[1],1) / Length) + xMom, nz(xMU[1], 1))
xMD = iff(xMom <= 0, nz(xMD[1], 1) - (nz(xMD[1],1) / Length) + abs(xMom), nz(xMD[1], 0))
RM = xMU / xMD
nRes = 100 * (RM / (1+RM))
pos = iff(nRes < BuyZone, 1,
	   iff(nRes > SellZone, -1, nz(pos[1], 0)))
possig = iff(reverse and pos == 1, -1,
          iff(reverse and pos == -1, 1, pos))
if (possig == 1)
    strategy.entry("Long", strategy.long)
if (possig == -1)
    strategy.entry("Short", strategy.short)
barcolor(possig == -1 ? red: possig == 1 ? green : blue )
plot(nRes, color=blue, title="RMI")
- Estratégia de rastreamento da média móvel de ruptura da tendência
- Estratégia de acompanhamento da tendência baseada no oscilador de volume
- Tendência seguindo uma estratégia de longo prazo baseada na SuperTendência e na Transformação Fisher
- Estratégia de negociação de reversão de dupla cruz de ouro
- Fibonacci retira o script de estratégia de negociação
- RSI-BB - Estratégia de ruptura do momento
- Estratégia de perda de parada fixa de faixa de ruptura
- Estratégia de negociação de dupla direção baseada no RSI e na SuperTrend
- EMA 13 48 Tendência Seguindo estratégia
- Estratégia Williams de acumulação/distribuição (Williams AD)
- Sistema de acompanhamento de tendências de caixa dupla
- Estratégia de Martingale com gama de média móvel alargada para negociação de ações
- Estratégia de equilíbrio touro e urso
- Estratégia de Comércio de Dual Rail de Oma e Apollo
- Estratégia de cruzamento de média móvel dupla
- Estratégia de acompanhamento de tendências de sinal duplo
- Tendência na sequência da estratégia SMA
- Estratégia de Equilíbrio da Fenda do Leão
- Estratégia de negociação de média móvel ATR adaptativa
- Estratégia de inversão bidirecional