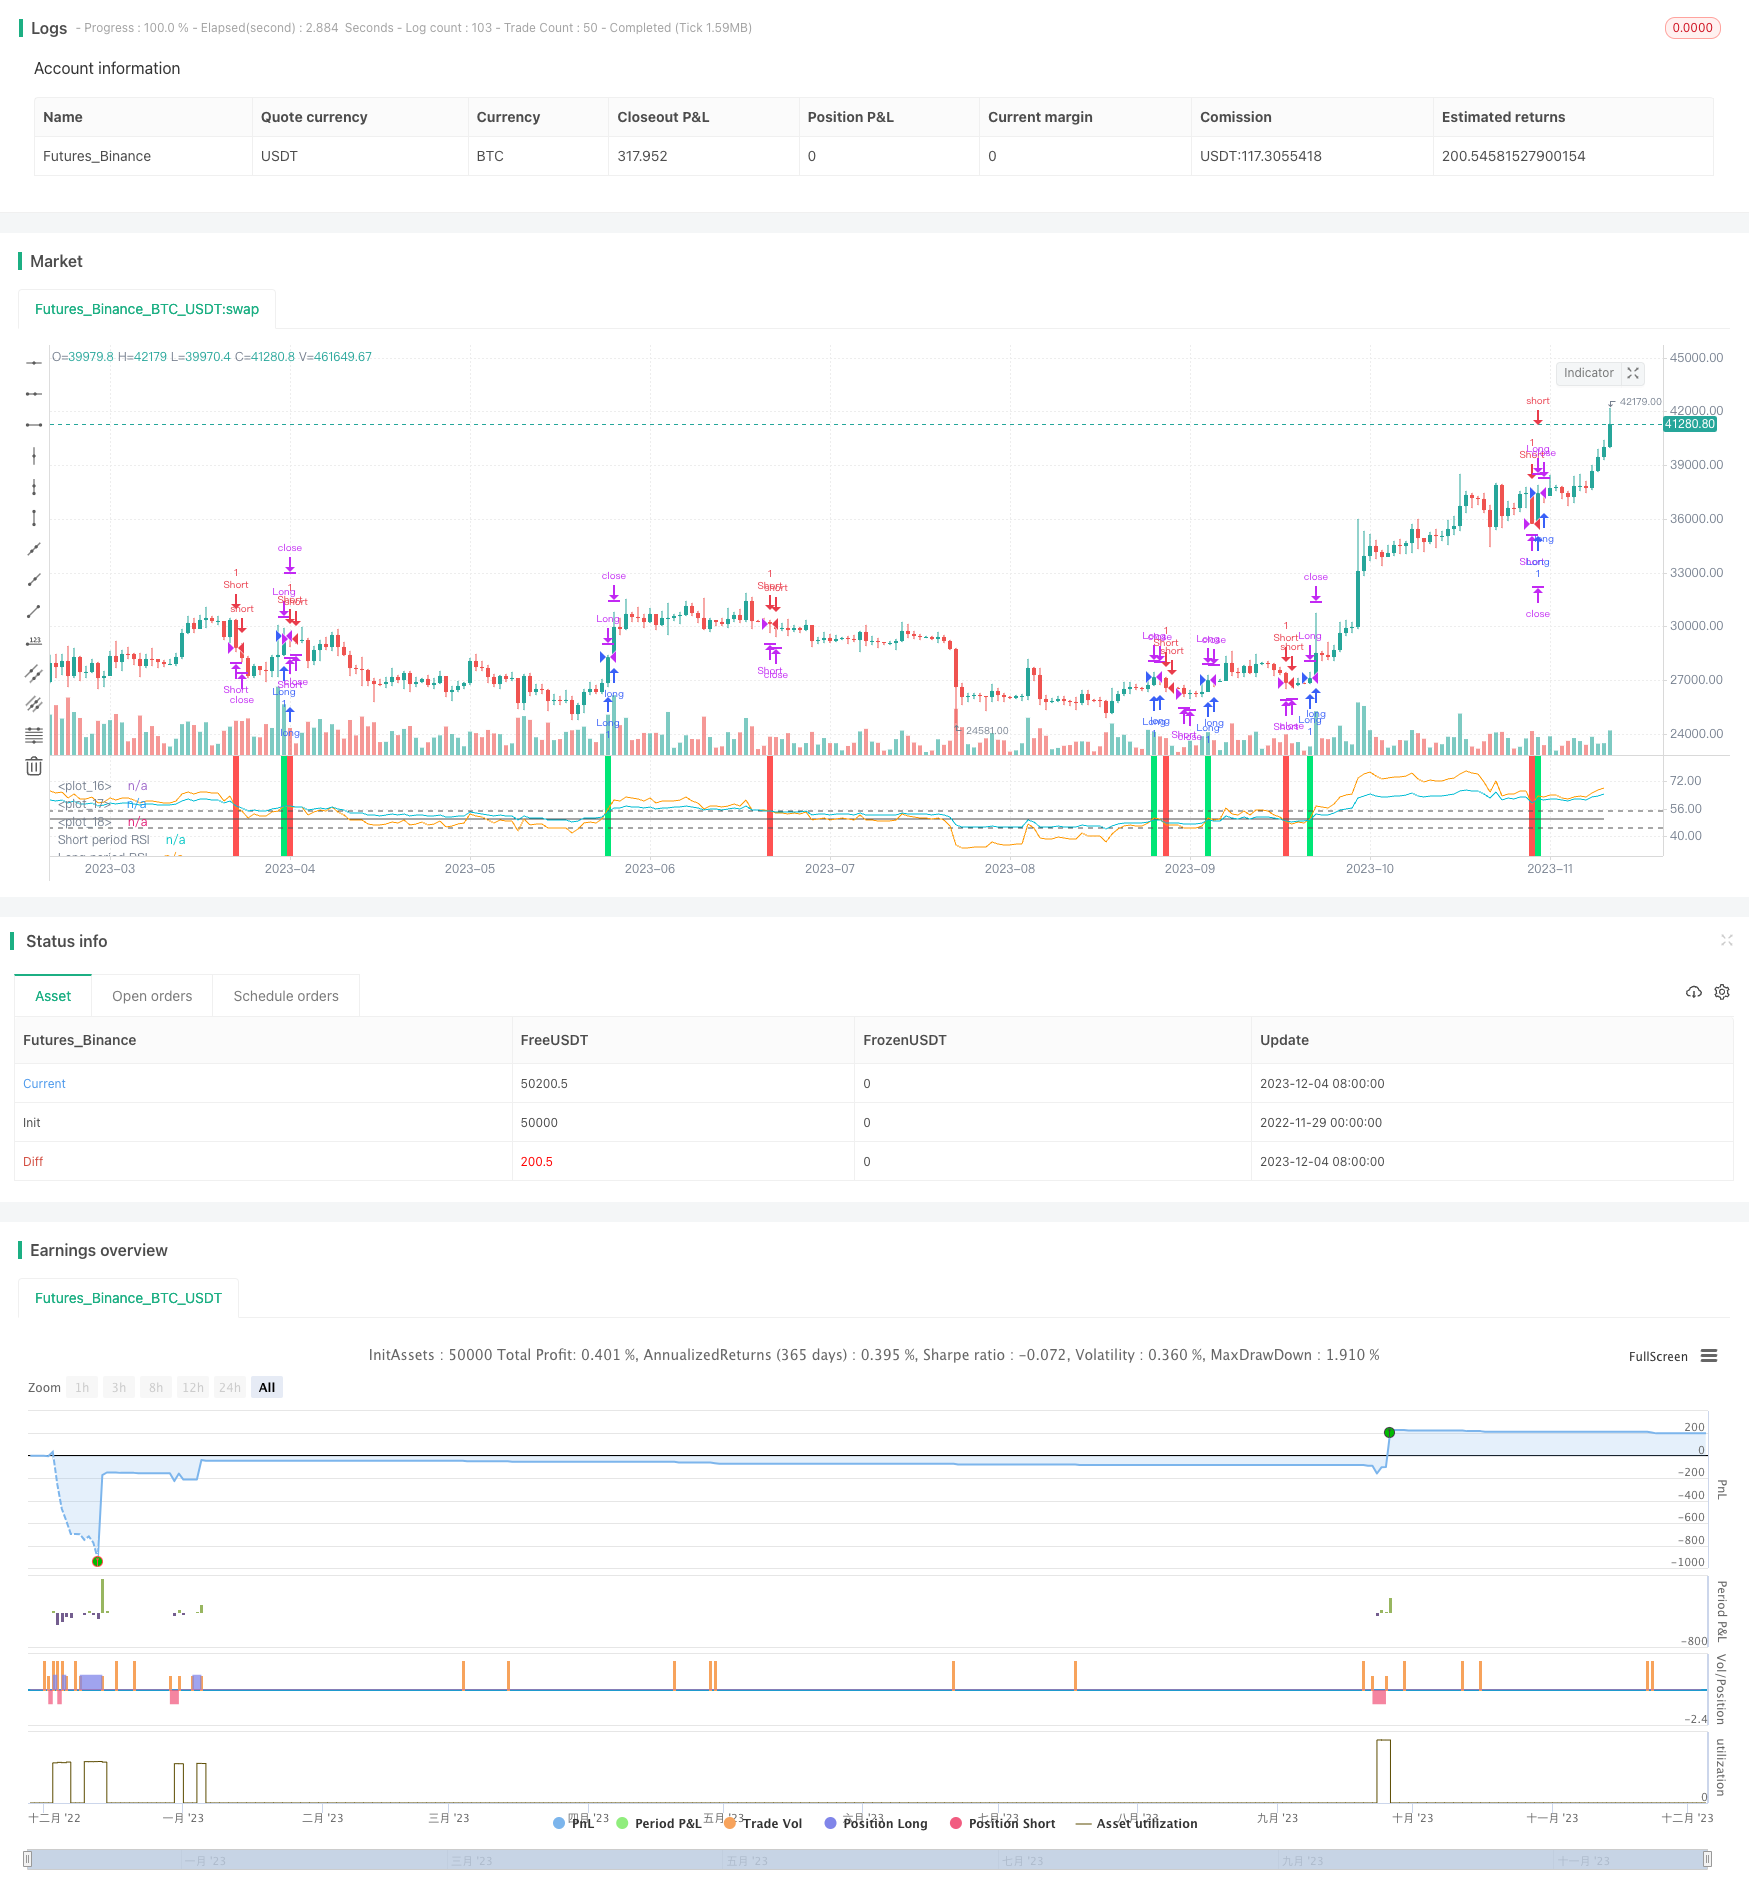
Estratégia de negociação quantitativa baseada no RSI
Autora:ChaoZhang, Data: 2023-12-06 17:17:16Tags:

Resumo
A estratégia é chamada de
Estratégia lógica
A estratégia constrói sinais de negociação comparando um RSI de período rápido (default 55 dias) e um RSI de período lento (default 126 dias). Quando o RSI rápido cruza acima do RSI lento, um sinal de compra é gerado. Quando o RSI rápido cai abaixo do RSI lento, um sinal de venda é acionado. Comparando a força relativa entre dois prazos diferentes, detecta oportunidades quando as tendências de curto e longo prazo se invertem.
Após a entrada de uma posição, a meta de lucro e o stop loss serão definidos. A meta de lucro padrão é 0,9 vezes o preço de entrada. A perda de stop default é 3% abaixo do preço de entrada. As posições também serão fechadas se um sinal reverso for ativado.
Vantagens
- Captar reversões de preços a curto prazo através da comparação de RSI duplas
- Filtrar sinais falsos usando confirmação dupla
- Limite de perdas em apostas individuais com stop loss
Riscos
- Sinais de reversão frequentes durante uma elevada volatilidade
- Stop loss muito apertado, facilmente desligado por pequenas flutuações
- Falta de reversões importantes com parâmetros mal configurados
Reforço
- Teste mais combinações de parâmetros RSI para encontrar o ideal
- Adicionar outros indicadores para filtrar sinais falsos
- Relação dinâmica de stop loss e take profit para uma melhor rentabilidade
Resumo
A estratégia
/*backtest
start: 2022-11-29 00:00:00
end: 2023-12-05 00:00:00
period: 1d
basePeriod: 1h
exchanges: [{"eid":"Futures_Binance","currency":"BTC_USDT"}]
*/

//@version=2
strategy(title="Relative Strength Index", shorttitle="RSI")
slen    = input(55, title="Short length")
llen    = input(126, title="Long length")
sup     = ema(max(change(close), 0), slen)
sdown   = ema(-min(change(close), 0), slen)
rsi1    = sdown == 0 ? 100 : sup == 0 ? 0 : 100 - (100 / (1 + sup / sdown))
lup     = ema(max(change(close), 0), llen)
ldown   = ema(-min(change(close), 0), llen)
rsi2    = ldown == 0 ? 100 : lup == 0 ? 0 : 100 - (100 / (1 + lup / ldown))
ob      = input(55, title="Overbought")
os      = input(45, title="Oversold")
tp      = input(.9, title="Take profit level %")*.01
sl      = input(3, title="Stoploss level %")*.01
mid     = avg(ob,os)
plot    (mid, color=#4f4f4f, transp=0)
hline   (ob, color=#4f4f4f)
hline   (os, color=#4f4f4f)
long    = crossover(rsi1,rsi2)
short   = crossunder(rsi1,rsi2)
vall    = valuewhen(long,close,0)
lexit1  = high>=(vall*tp)+vall
lexit2  = low<=vall-(vall*sl)
vals    = valuewhen(short,close,0)
sexit1  = low<=vals - (vals*tp)
sexit2  = high>=vals + (vals*sl)
bgcolor (color=long?lime:na,transp=50)
bgcolor (color=short?red:na, transp=50)
strategy.entry("Long", strategy.long, when=long)
strategy.close("Long", when=lexit1)
strategy.close("Long", when=lexit2)
strategy.close("Long", when=short)
strategy.entry("Short", strategy.short, when=short)
strategy.close("Short", when=sexit1)
strategy.close("Short", when=sexit2)
strategy.close("Short", when=long)
plot    (rsi1, color=orange, transp=0,linewidth=1, title="Short period RSI")
plot    (rsi2, color=aqua  , transp=0,linewidth=1, title="Long period RSI")
- Estratégia de negociação de tendência de reversão da média do índice de ouro
- Estratégia de negociação de tendências baseada em médias móveis múltiplas
- Estratégia de sinal de compra com filtro de indicador duplo
- Estratégia de negociação cruzada de média móvel dupla
- Estratégia dupla de cruzamento da EMA
- Momentum Breakout Camarilla Estratégia de apoio
- Estratégia de fuga da tendência do mel ATR
- Tendência Seguindo a Estratégia com a EMA
- Estratégia quantitativa de mudança percentual da barra de inversão dupla
- Reversão das bandas de Bollinger com filtro de tendência MA
- Estratégia de negociação cruzada de média móvel múltipla
- Estratégia de cruzamento da média móvel
- Estratégia de saída automática de S/R
- Estratégia de abertura e de encerramento do canal de preços de impulso
- Melhoria da estratégia de cruzamento da média móvel com orientação da tendência do mercado
- Estratégia de negociação de candelabro dinâmico
- SSL Hybrid Exit Arrow Quant Estratégia
- Estratégia de cronometragem ADX de média móvel dupla
- Estratégia de diminuição da tendência do índice percentual BB
- MACD Bollinger Turtle Estratégia de negociação