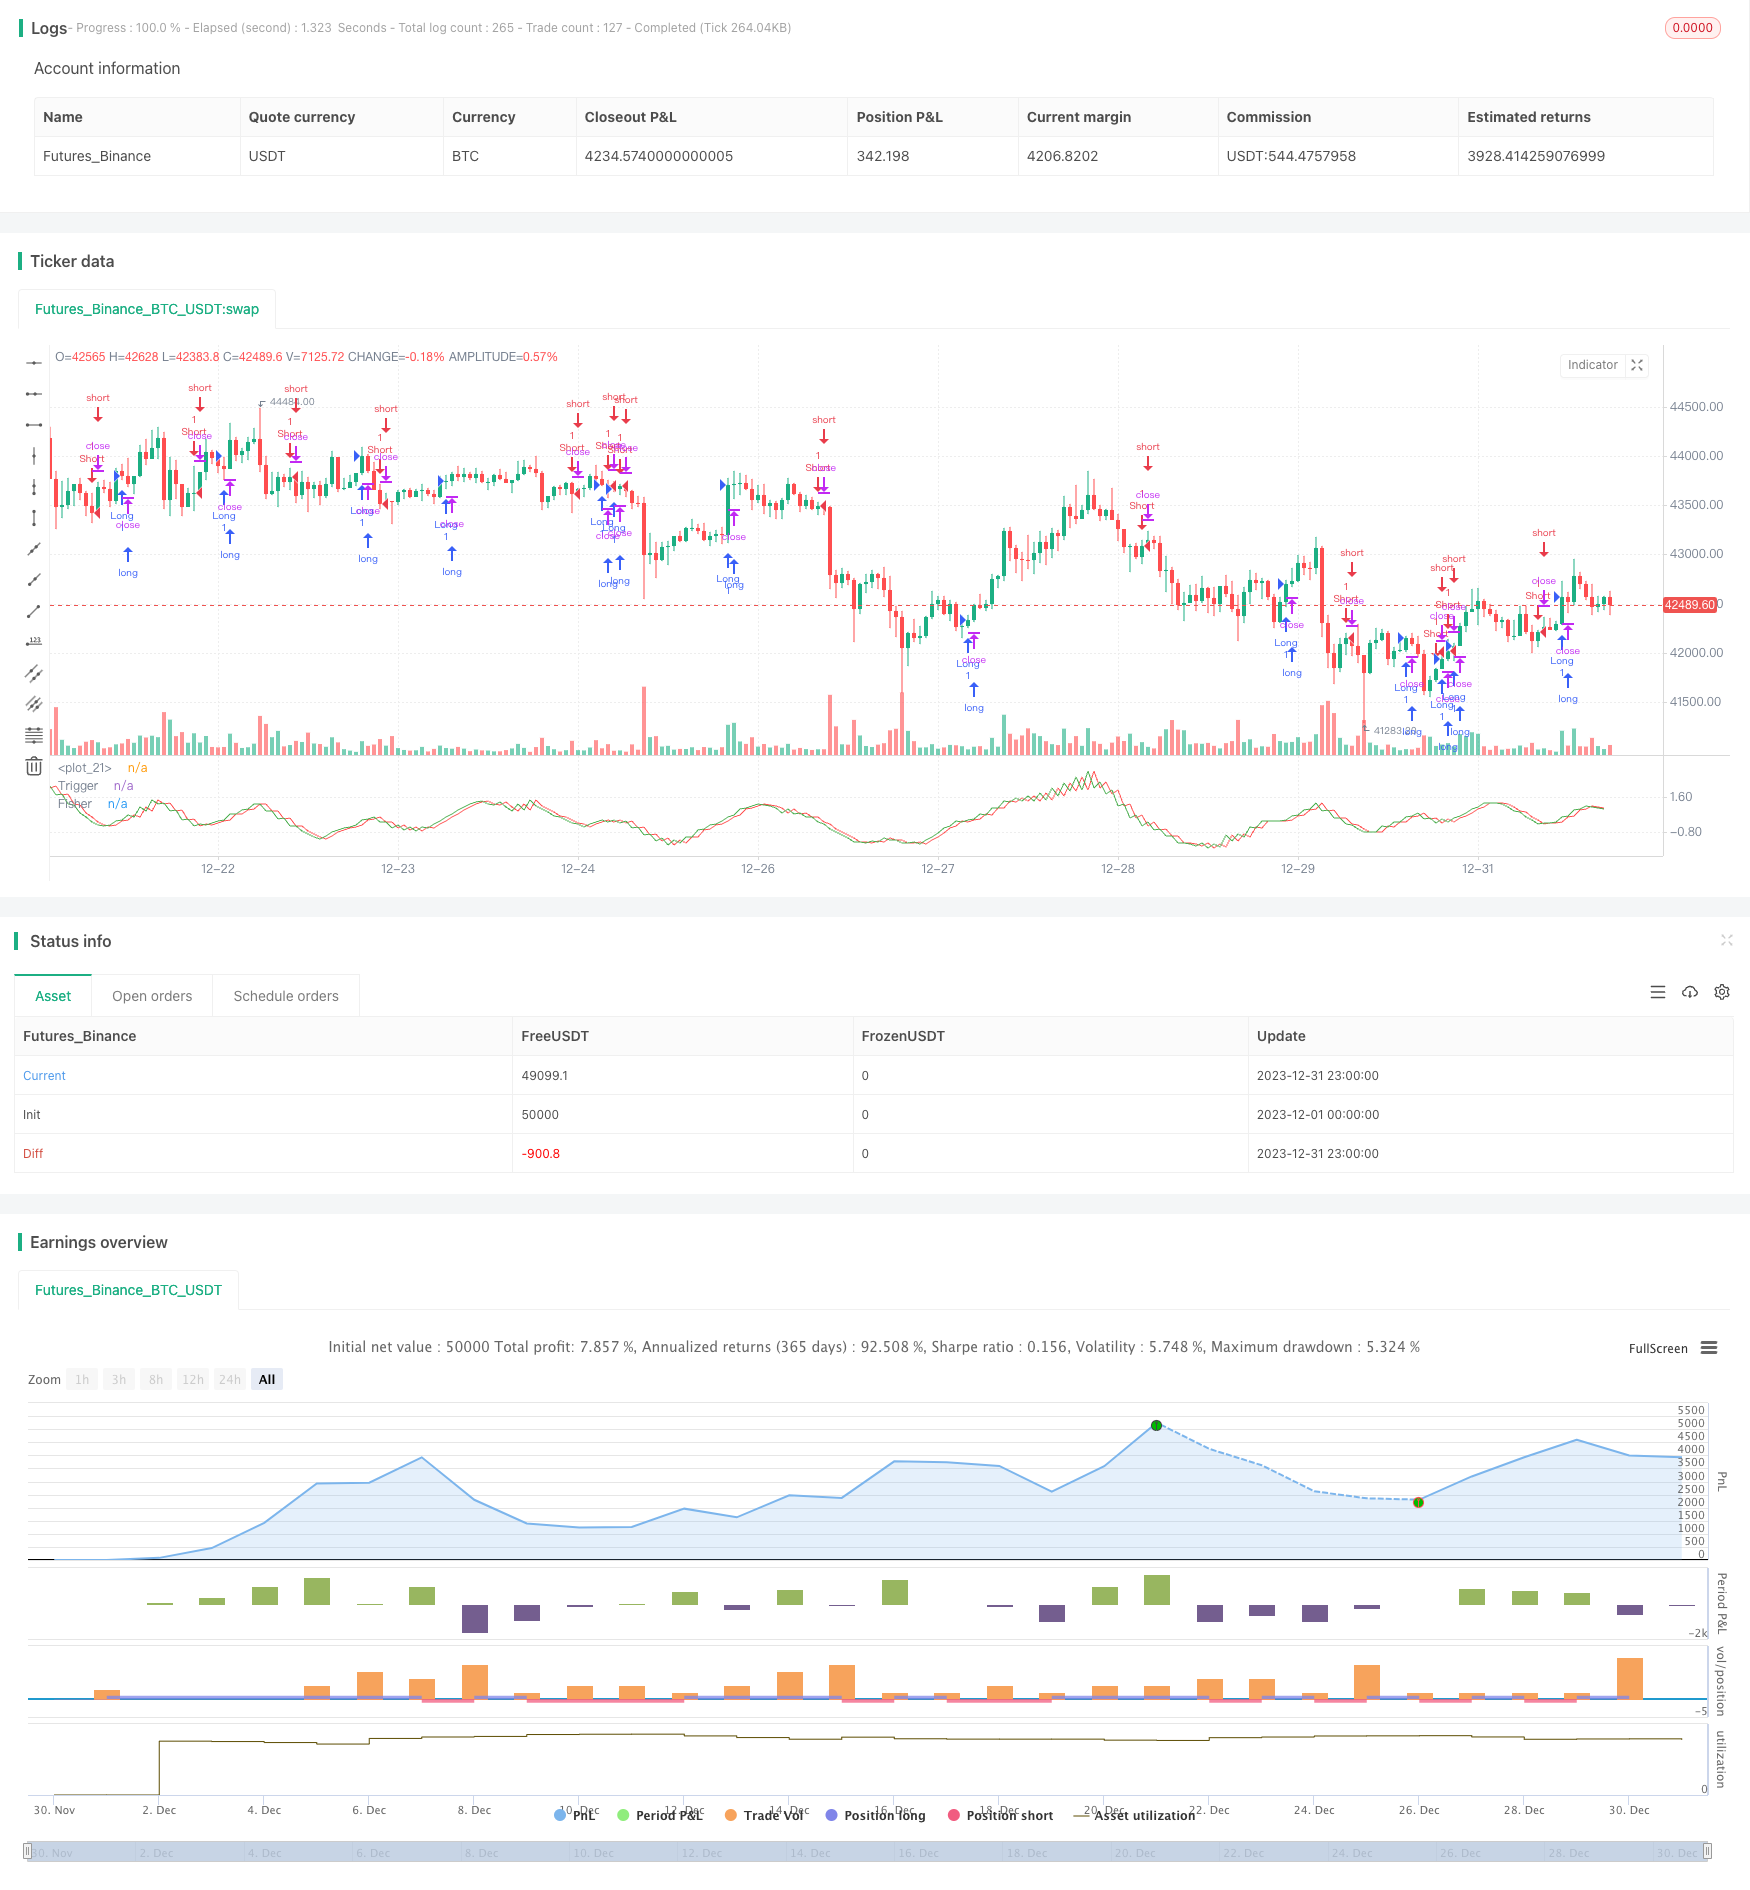
Estratégia de Backtesting do Indicador de Transformada de Fisher

Visão geral
A estratégia é uma estratégia de retomada baseada no indicador de conversão de Fisher. A fórmula de conversão de Fisher pode converter dados de preços em distribuições ortogonais, usadas para identificar pontos de extremo e ponto de inflexão de preços. A estratégia, combinada com o indicador de conversão de Fisher, determina tendências de preços e permite negociação automatizada.
Princípio da estratégia
- Cálculo do indicador HL2
- Calcule o máximo xMaxH e o mínimo xMinL de HL2 no período de Length mais recente
- Calcule o índice de conversão de Fisher:
- nValue1 é 0,33 × ((HL2 padronização) + 0,67 × nValue1 no primeiro ciclo
- nValue2 limite nValue1 entre -0.99 e 0.99
- Conversão de nFish para função logarítmica de nValue2
- Determine se nFish é positivo ou negativo e determine a direção da posição
- Possig sinal de posição, se a negociação de reversão for configurada, a posição será retomada
- Entradas: possig=1 fazer mais, possig=-1 fazer vazio
Análise de vantagens estratégicas
- O indicador de conversão de Fisher identifica os pontos de extremo e de viragem dos preços e determina a tendência com precisão
- Combinação com oscilação do filtro do indicador HL2 para aumentar a taxa de vitória
- Pode ser configurado para negociação inversa, adaptando-se a diferentes cenários de mercado
- Automatização de transações, sem julgamento humano, reduzindo custos de transação
Análise de Riscos
- O índice de conversão de Fisher está atrasado e pode ter perdido mudanças de preços de linhas curtas
- A tendência de tremores corre risco de ser interrompida
- Inadequada configuração de negociação de reversão pode levar a transações sistematicamente erradas
- Risco de falsos positivos, sem considerar a verificação de períodos de tempo
Resolução de riscos:
- Ajustar os parâmetros apropriadamente para reduzir o atraso
- Aumentar o limiar de perdas e controlar as perdas individuais
- Otimização de filtros de inversão de transações em combinação com outros indicadores
- Adicionar tendências, níveis de preço, bandas de frequência e outras verificações múltiplas
Direção de otimização da estratégia
- Combinação de filtros de indicadores de tendência para garantir a consistência das grandes tendências
- Aumentar os indicadores de bandas de frequência para melhorar a precisão do julgamento de reversão de preços
- Verificação com múltiplos ciclos de tempo para evitar falsos positivos
- Ajuste dinâmico do limiar de perda
- Parâmetros de otimização, maximização de vitórias e fatores de lucro
As estratégias de otimização acima podem aumentar ainda mais a probabilidade de vitória da estratégia, bloquear o lucro e controlar o risco, resultando em resultados de negociação mais estáveis e eficientes.
Resumir
A estratégia de retorno do indicador de variação de Fisher integra o indicador de variação de Fisher para determinar os pontos de inflexão e a direção da tendência. A estratégia é precisa, altamente automatizada e pode obter resultados de negociação estáveis e eficientes por meio da otimização de parâmetros. Mas também existe um certo risco de atraso, falso positivo, entre outros.
/*backtest
start: 2023-12-01 00:00:00
end: 2023-12-31 23:59:59
period: 1h
basePeriod: 15m
exchanges: [{"eid":"Futures_Binance","currency":"BTC_USDT"}]
*/

//@version = 2
////////////////////////////////////////////////////////////
//  Copyright by HPotter v2.0 22/12/2016
// 	Market prices do not have a Gaussian probability density function
// 	as many traders think. Their probability curve is not bell-shaped.
// 	But trader can create a nearly Gaussian PDF for prices by normalizing
// 	them or creating a normalized indicator such as the relative strength
// 	index and applying the Fisher transform. Such a transformed output
// 	creates the peak swings as relatively rare events.
// 	Fisher transform formula is: y = 0.5 * ln ((1+x)/(1-x))
// 	The sharp turning points of these peak swings clearly and unambiguously
// 	identify price reversals in a timely manner.
//
//  For signal used zero.
// You can change long to short in the Input Settings
// Please, use it only for learning or paper trading. Do not for real trading.
////////////////////////////////////////////////////////////
strategy(title="Fisher Transform Indicator by Ehlers Backtest", shorttitle="Fisher Transform Indicator by Ehlers")
Length = input(10, minval=1)
reverse = input(false, title="Trade reverse")
hline(1, color=white)
xHL2 = hl2
xMaxH = highest(xHL2, Length)
xMinL = lowest(xHL2,Length)
nValue1 = 0.33 * 2 * ((xHL2 - xMinL) / (xMaxH - xMinL) - 0.5) + 0.67 * nz(nValue1[1])
nValue2 =   iff(nValue1 > .99,  .999,
	         iff(nValue1 < -.99, -.999, nValue1))
nFish = 0.5 * log((1 + nValue2) / (1 - nValue2)) + 0.5 * nz(nFish[1])
pos = iff(nFish > 0, 1,
	   iff(nFish < 0, -1, nz(pos[1], 0)))
possig = iff(reverse and pos == 1, -1,
          iff(reverse and pos == -1, 1, pos))
if (possig == 1)
    strategy.entry("Long", strategy.long)
if (possig == -1)
    strategy.entry("Short", strategy.short)
// barcolor(possig == -1 ? red: possig == 1 ? green : blue )
plot(nFish, color=green, title="Fisher")
plot(nz(nFish[1]), color=red, title="Trigger")