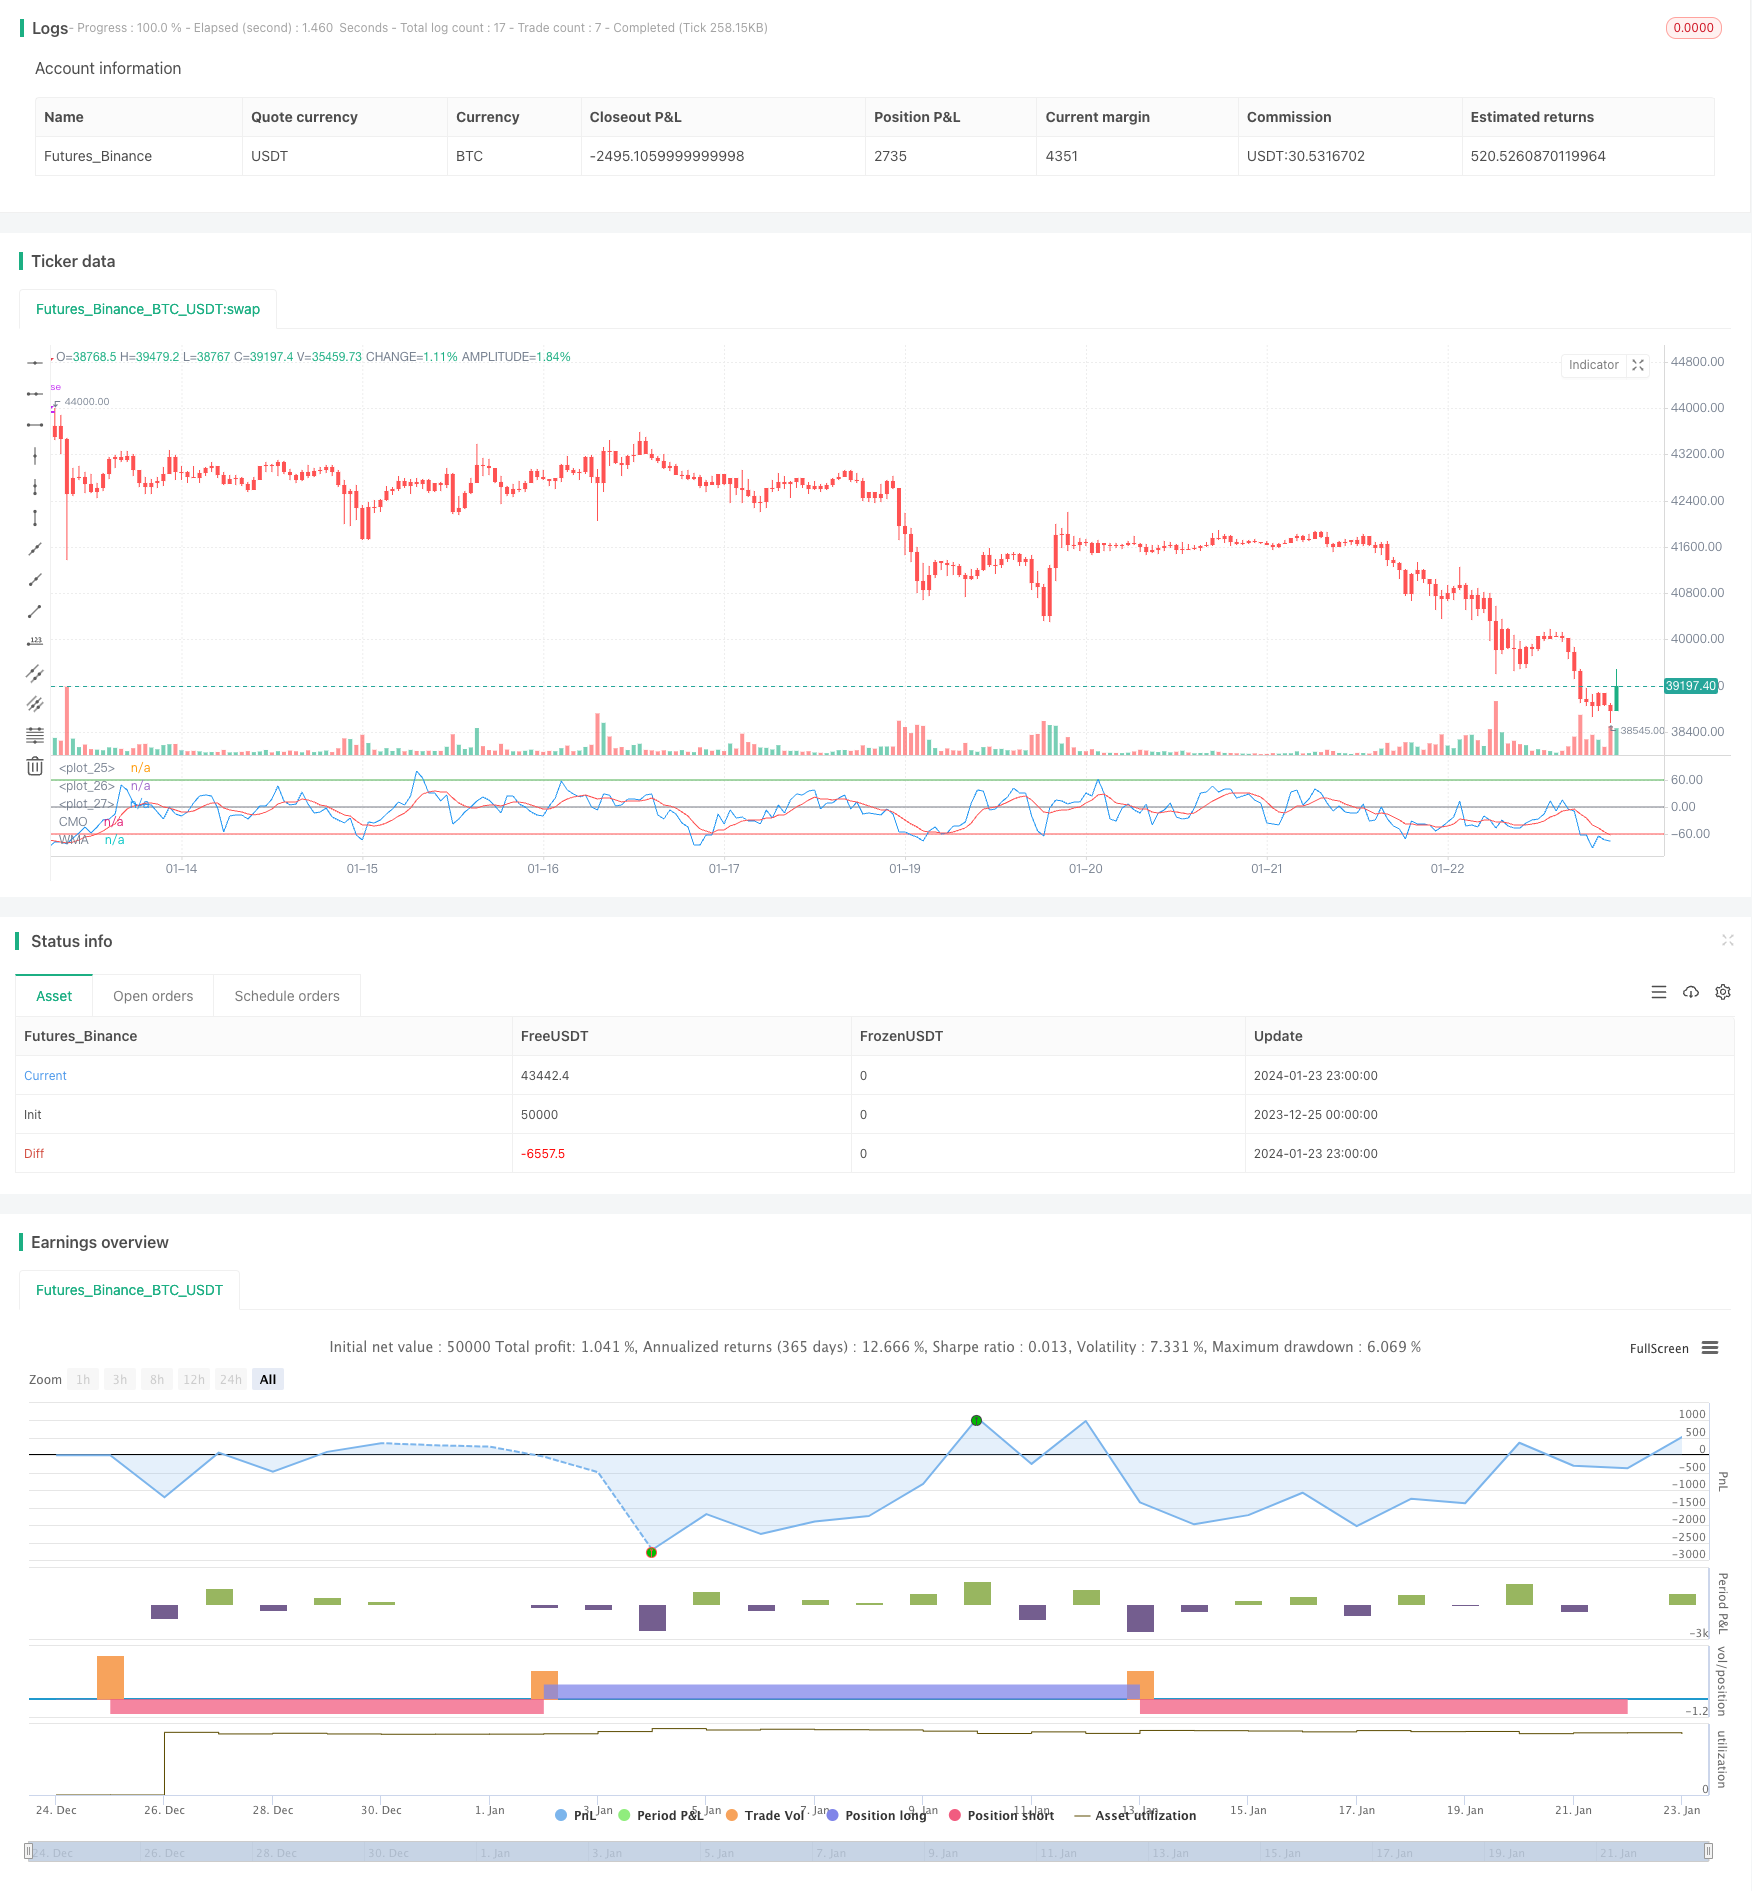
Estratégia de negociação de média móvel dupla baseada em CMO e WMA

Visão geral
A estratégia é uma estratégia de negociação de linha de equilíbrio binária baseada no indicador de movimentos de preços Chandre Movement Oscillator (CMO) e sua média móvel ponderada (WMA).
Princípio da estratégia
A estratégia primeiro calcula o CMO, um indicador que mede a mudança de dinâmica on-line dos preços. Um valor positivo representa um impulso ascendente e um valor negativo representa um impulso descendente. Em seguida, calcula o WMA do CMO.
Os principais passos para calcular o CMO são:
- Calcular a variação diária de preços (xMom)
- SMA de n dias para a variação de preço, como a dinâmica de preço de uma moeda real (xSMA_mom)
- Calcule a mudança de preço líquido em n dias (xMomLength)
- Para padronizar a mudança de preço líquido (nRes), divide por SMA
- WMA de m dias para a normalização da mudança de preço líquido, obtida por CMO ((xWMACMO)
A vantagem da estratégia é capturar os pontos de inflexão da tendência de preços no meio prazo. O tamanho do valor absoluto do CMO reflete a intensidade da tendência de corrida dos preços, o WMA é favorável à ruptura da falsa onda.
Análise de vantagens
A principal vantagem desta estratégia é que ela usa os valores absolutos dos indicadores CMO para avaliar o sentimento das massas de mercado e os filtros WMA para identificar os pontos de inflexão das tendências de médio prazo. A estratégia de média média é mais capaz de capturar tendências de médio prazo com maior espaço de elasticidade em comparação com uma única estratégia de média móvel.
O CMO padroniza as mudanças de preço, mapeando-as na faixa de 100 a 100, para ajudar a julgar o sentimento das massas no mercado; o tamanho absoluto representa a intensidade da tendência atual. A WMA faz uma flutuação adicional no CMO para evitar o aparecimento de muitos sinais falsos.
Análise de Riscos
Os principais riscos que esta estratégia pode trazer são:
- Parâmetros CMO e WMA mal definidos, resultando em muitos falsos sinais
- A incapacidade de responder eficazmente a um mercado de tendências vibratórias gerará uma frequência de negociação excessiva e custos de deslizamento.
- Incapacidade de identificar a verdadeira tendência a longo prazo, com risco de perda em posições a longo prazo
Os métodos de otimização correspondentes são:
- Ajustar os parâmetros do CMO e do WMA para encontrar a combinação de parâmetros ideal
- Adição de condições de filtragem adicionais, como o indicador de energia de volume de transação, para evitar a negociação em situações de turbulência
- Combine indicadores de períodos mais longos, como a linha de 90 dias, para evitar oportunidades perdidas em tendências de linha longa
Direção de otimização
A direção de otimização da estratégia se concentra principalmente na otimização de parâmetros, filtragem de sinais e parada de perdas:
Optimização de parâmetros para CMO e WMA: Encontrar a combinação de parâmetros ótima através de percurso
Filtragem de sinais com indicadores auxiliares como volume de transações, indicadores de força e fraqueza, para evitar falsas rupturas
Aumento do mecanismo de stop loss dinâmico, que interrompe a saída de perdas quando o preço retorna abaixo do CMO e WMA
Pode-se considerar o padrão Breakout Failure como um sinal de entrada, ou seja, o CMO e a WMA quebraram primeiro o ponto crítico, mas logo voltaram a cair
Os indicadores de tendências podem ser combinados com indicadores de períodos mais longos para evitar negociações adversas.
Resumir
A estratégia em geral usa o indicador CMO para avaliar a força da tendência e os pontos de inflexão, em combinação com a WMA para gerar sinais de negociação em ondas de crescimento, e pertence ao típico sistema de dupla equilíbrio. Em comparação com a estratégia de uma única MA, tem a vantagem de uma tendência de meio prazo de maior elasticidade de captura.
/*backtest
start: 2023-12-25 00:00:00
end: 2024-01-24 00:00:00
period: 1h
basePeriod: 15m
exchanges: [{"eid":"Futures_Binance","currency":"BTC_USDT"}]
*/

//@version=3
////////////////////////////////////////////////////////////
//  Copyright by HPotter v1.0 18/10/2018
//    This indicator plots Chandre Momentum Oscillator and its WMA on the
//    same chart. This indicator plots the absolute value of CMO.
//    The CMO is closely related to, yet unique from, other momentum oriented
//    indicators such as Relative Strength Index, Stochastic, Rate-of-Change,
//    etc. It is most closely related to Welles Wilder?s RSI, yet it differs
//    in several ways:
//    - It uses data for both up days and down days in the numerator, thereby
//        directly measuring momentum;
//    - The calculations are applied on unsmoothed data. Therefore, short-term
//        extreme movements in price are not hidden. Once calculated, smoothing
//        can be applied to the CMO, if desired;
//    - The scale is bounded between +100 and -100, thereby allowing you to clearly
//        see changes in net momentum using the 0 level. The bounded scale also allows
//        you to conveniently compare values across different securities.
////////////////////////////////////////////////////////////
strategy(title="CMO & WMA Backtest ver 2.0", shorttitle="CMO & WMA")
Length = input(9, minval=1)
LengthWMA = input(9, minval=1)
BuyZone = input(60, step = 0.01)
SellZone = input(-60, step = 0.01)
reverse = input(false, title="Trade reverse")
hline(BuyZone, color=green, linestyle=line)
hline(SellZone, color=red, linestyle=line)
hline(0, color=gray, linestyle=line)
xMom = abs(close - close[1])
xSMA_mom = sma(xMom, Length)
xMomLength = close - close[Length]
nRes = 100 * (xMomLength / (xSMA_mom * Length))
xWMACMO = wma(nRes, LengthWMA)
pos = 0.0
pos := iff(xWMACMO > BuyZone, 1,
	   iff(xWMACMO < SellZone, -1, nz(pos[1], 0)))
possig = iff(reverse and pos == 1, -1,
          iff(reverse and pos == -1, 1, pos))
if (possig == 1)
    strategy.entry("Long", strategy.long)
if (possig == -1)
    strategy.entry("Short", strategy.short)
barcolor(possig == -1 ? red: possig == 1 ? green : blue )
plot(nRes, color=blue, title="CMO")
plot(xWMACMO, color=red, title="WMA")