Estratégia de swing trading do RSI com base em ajustes intra-anuais
Data de criação:
2024-02-29 10:54:45
última modificação:
2024-02-29 10:54:45
cópia:
0
Cliques:
612
1
focar em
1628
Seguidores

Visão geral
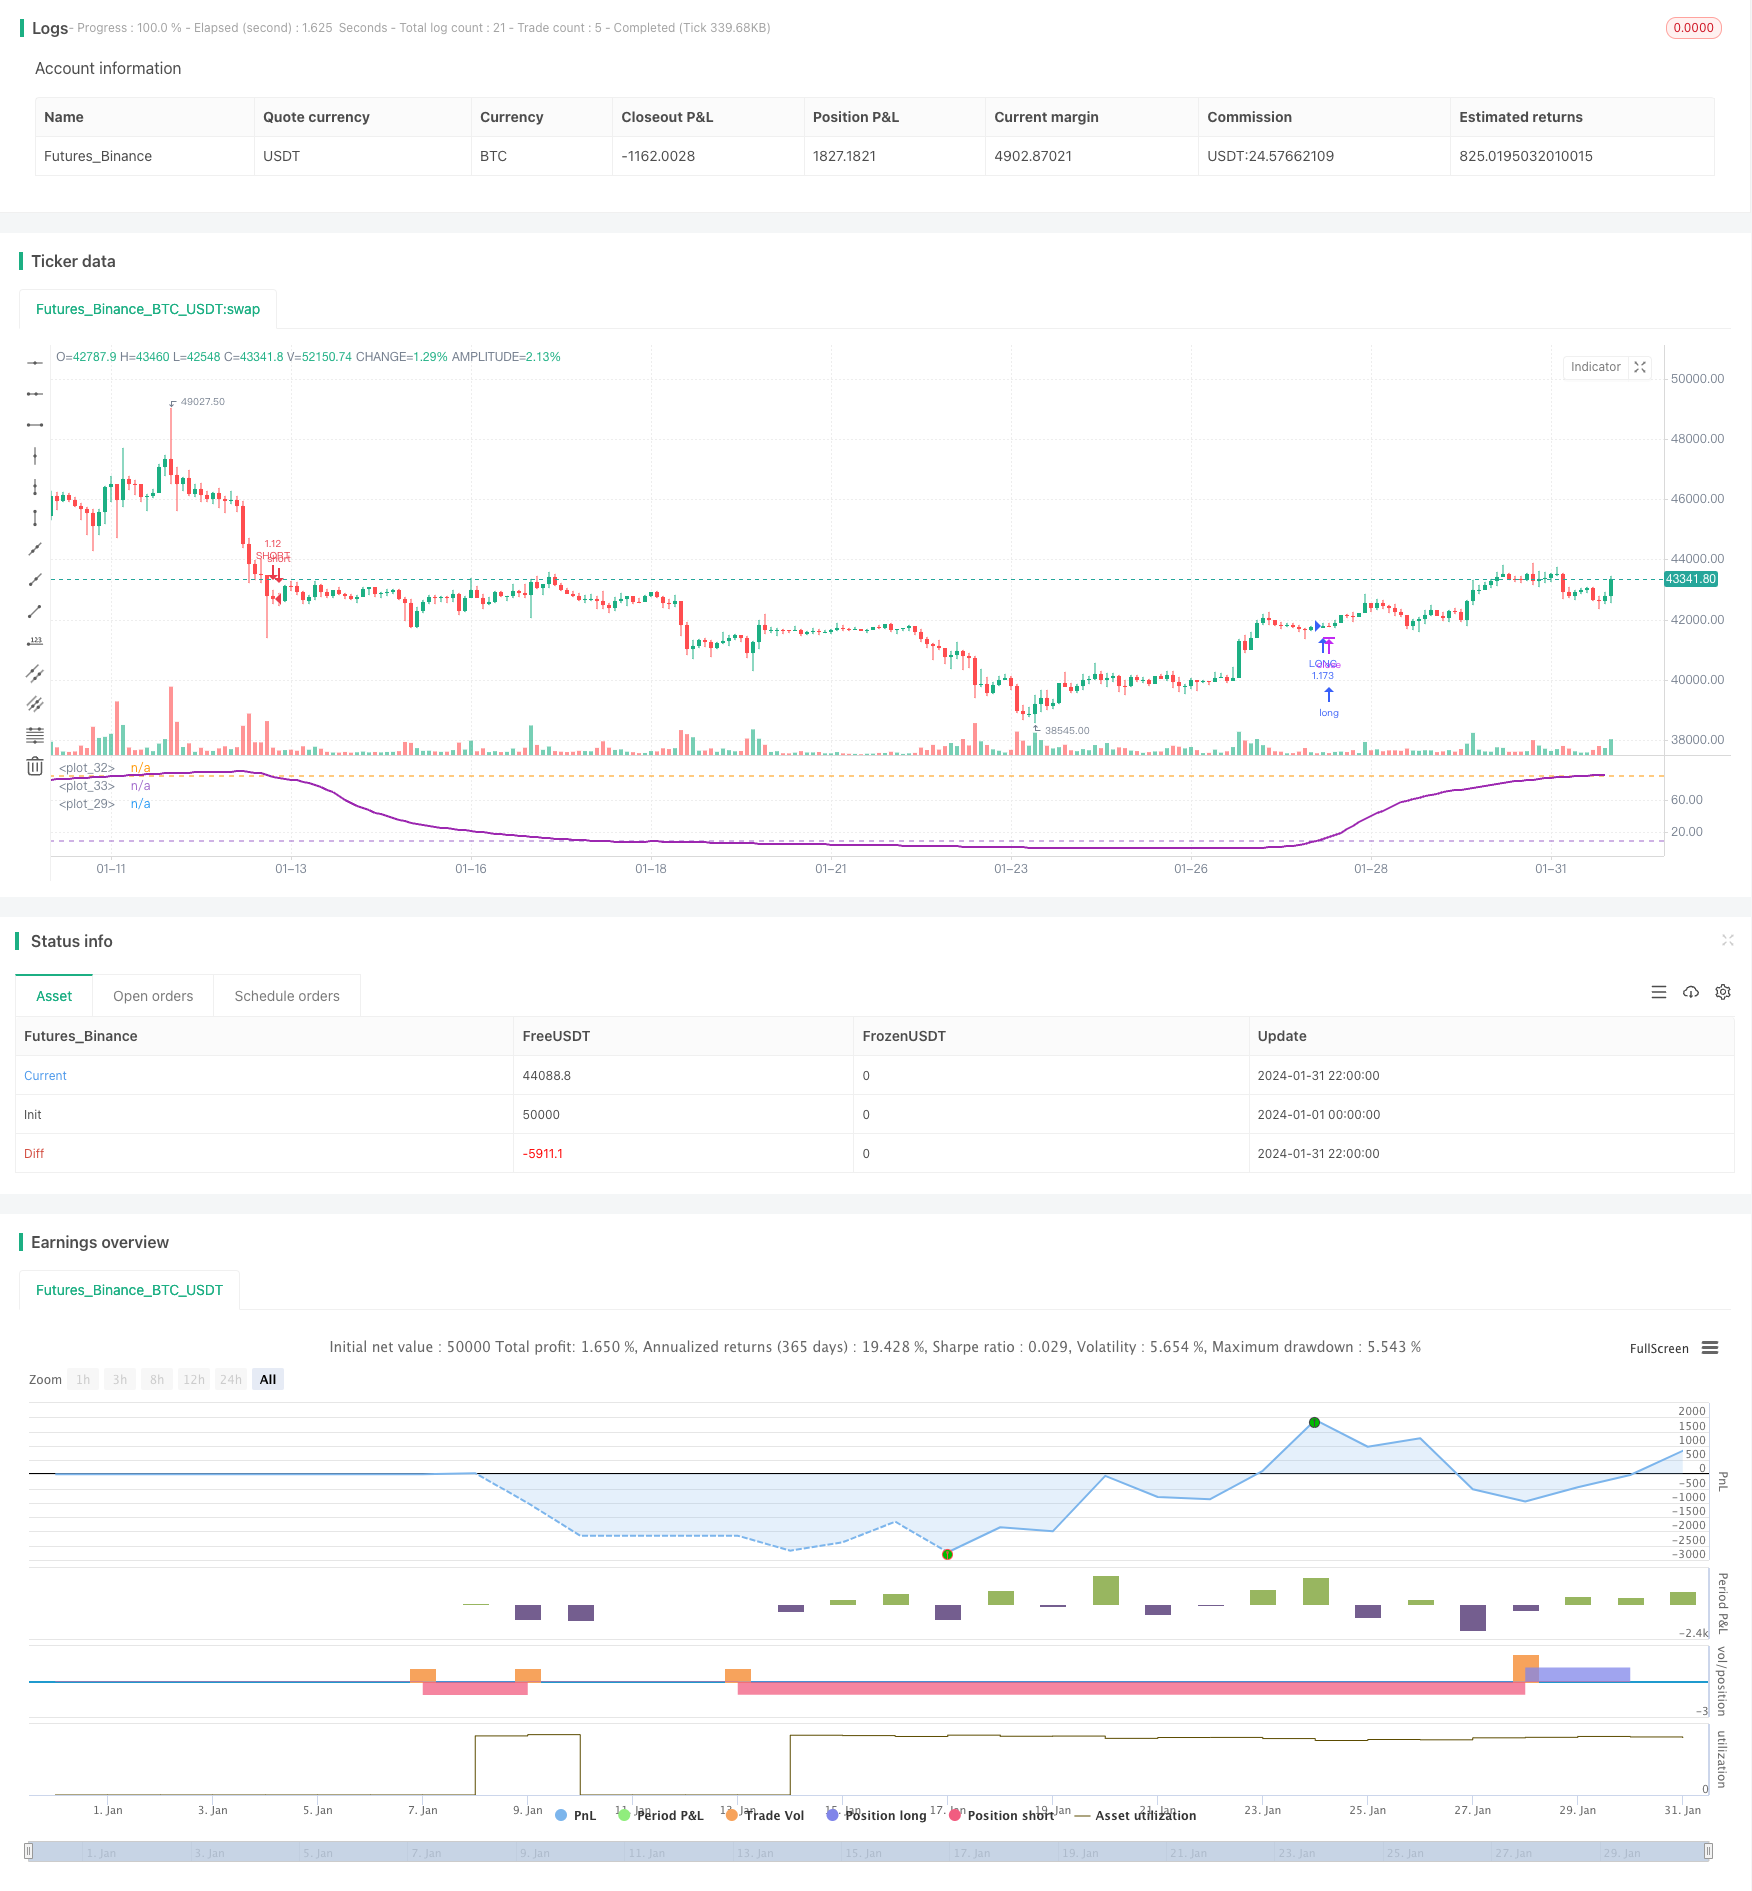
Esta estratégia é uma estratégia de negociação de oscilação do RSI baseada em ajustes anuais, que emite um sinal de negociação quando o indicador RSI toca no trajeto de queda e queda, rastreando as características de oscilação do RSI entre os trajectos definidos.
Princípio da estratégia
- Configure o comprimento da linha média do MA, o parâmetro RSI, o trajeto ascendente e descendente, o parâmetro de parada e perda, o intervalo do ciclo de negociação
- Calcule o valor do indicador RSI, RSI = (aumento médio) / (aumento médio + queda médio)*100
- Traçando o indicador RSI e suas trajetórias
- O indicador RSI em cima do trajeto de descolagem é um sinal de fazer mais, em baixo do trajeto de descolagem é um sinal de fazer vazio
- Abertura de posição para a criação de uma lista pendente OCO
- Parar e parar de acordo com a lógica de parada de perda definida
Análise de vantagens estratégicas
- Ao estabelecer um ciclo de negociação dentro do ano, é possível evitar alguns contextos externos inadequados.
- O indicador RSI pode efetivamente refletir sobre-compra e sobre-venda, e pode filtrar parte do ruído por meio da configuração de intervalos razoáveis para o comércio de choque.
- O OCO, em combinação com a configuração de stop loss, permite um controle de risco eficiente.
Análise de risco estratégico
- A precisão do julgamento crítico do RSI não pode ser garantida, podendo existir um certo risco de erro de julgamento.
- A configuração inadequada do ciclo de negociação durante o ano pode fazer com que você perca melhores oportunidades de negociação ou entre em um ambiente de negociação inadequado.
- Um ponto de parada muito alto pode causar um grande prejuízo, e um ponto de parada muito pequeno pode causar um lucro muito pequeno.
Pode ser otimizado por meio de ajustes nos parâmetros do RSI, no intervalo de tempo do ciclo de negociação e na proporção de stop loss.
Direção de otimização da estratégia
- Testar os valores ótimos dos parâmetros do RSI em diferentes períodos em diferentes mercados
- Analisar as leis do ciclo de mercado em geral para definir o melhor período de negociação do ano
- Determinação da proporção de stop-loss razoável por retrospectiva
- Optimizar a seleção de variedades de negociação e aumentar o tamanho das posições
- Optimizar em combinação com outras técnicas ou indicadores de negociação mais avançados
Resumir
Esta estratégia controla o risco de negociação de forma eficaz, através do RSI, que segue a tendência de negociação em um determinado período do ano. Otimizando os parâmetros e otimizando as regras, pode-se obter uma maior eficácia da estratégia.
Código-fonte da estratégia
/*backtest
start: 2024-01-01 00:00:00
end: 2024-01-31 23:59:59
period: 2h
basePeriod: 15m
exchanges: [{"eid":"Futures_Binance","currency":"BTC_USDT"}]
*/

//@version=3
strategy(title = "Bitlinc MARSI Study AST",shorttitle="Bitlinc MARSI Study AST",default_qty_type = strategy.percent_of_equity, default_qty_value = 100,commission_type=strategy.commission.percent,commission_value=0.1,initial_capital=1000,currency="USD",pyramiding=0, calc_on_order_fills=false)

// === General Inputs ===
lengthofma = input(62, minval=1, title="Length of MA")
len = input(31, minval=1, title="Length")
upperband = input(89, minval=1, title='Upper Band for RSI')
lowerband = input(10, minval=1, title="Lower Band for RSI")
takeprofit =input(1.25, title="Take Profit Percent")
stoploss =input(.04, title ="Stop Loss Percent")
monthfrom =input(8, title = "Month Start")
monthuntil =input(12, title = "Month End")
dayfrom=input(1, title= "Day Start")
dayuntil=input(31, title= "Day End")

// === Innput Backtest Range ===
//FromMonth = input(defval = 9, title = "From Month", minval = 1, maxval = 12)
//FromDay   = input(defval = 1, title = "From Day", minval = 1, maxval = 31)
//FromYear  = input(defval = 2018, title = "From Year", minval = 2017)
//ToMonth   = input(defval = 1, title = "To Month", minval = 1, maxval = 12)
//ToDay     = input(defval = 1, title = "To Day", minval = 1, maxval = 31)
//ToYear    = input(defval = 9999, title = "To Year", minval = 2017)

// === Create RSI ===
src=sma(close,lengthofma)
up = rma(max(change(src), 0), len)
down = rma(-min(change(src), 0), len)
rsi = down == 0 ? 100 : up == 0 ? 0 : 100 - (100 / (1 + up / down))
plot(rsi,linewidth = 2, color=purple)

// === Plot Bands ===
band1 = hline(upperband)
band0 = hline(lowerband)
fill(band1, band0, color=blue, transp=95)

// === Entry and Exit Methods ===
longCond =  crossover(rsi,lowerband)
shortCond =  crossunder(rsi,upperband)

// === Long Entry Logic ===
if (  longCond )
    strategy.entry("LONG", strategy.long, stop=close, oca_name="TREND", comment="LONG")
else
    strategy.cancel(id="LONG")

// === Short Entry Logic ===
if ( shortCond   )
    strategy.entry("SHORT", strategy.short,stop=close, oca_name="TREND",  comment="SHORT")
else
    strategy.cancel(id="SHORT")

// === Take Profit and Stop Loss Logic ===
//strategy.exit("Take Profit LONG", "LONG", profit = close * takeprofit / syminfo.mintick, loss = close * stoploss / syminfo.mintick)
//strategy.exit("Take Profit SHORT", "SHORT", profit = close * takeprofit / syminfo.mintick, loss = close * stoploss / syminfo.mintick)
strategy.exit("LONG TAKE PROFIT", "LONG", profit = close * takeprofit / syminfo.mintick)
strategy.exit("SHORT STOP LOSS", "SHORT", profit = close * takeprofit / syminfo.mintick)
strategy.exit("LONG STOP LOSS", "LONG", loss = close * stoploss / syminfo.mintick)
strategy.exit("SHORT STOP LOSS", "SHORT", loss = close * stoploss / syminfo.mintick)