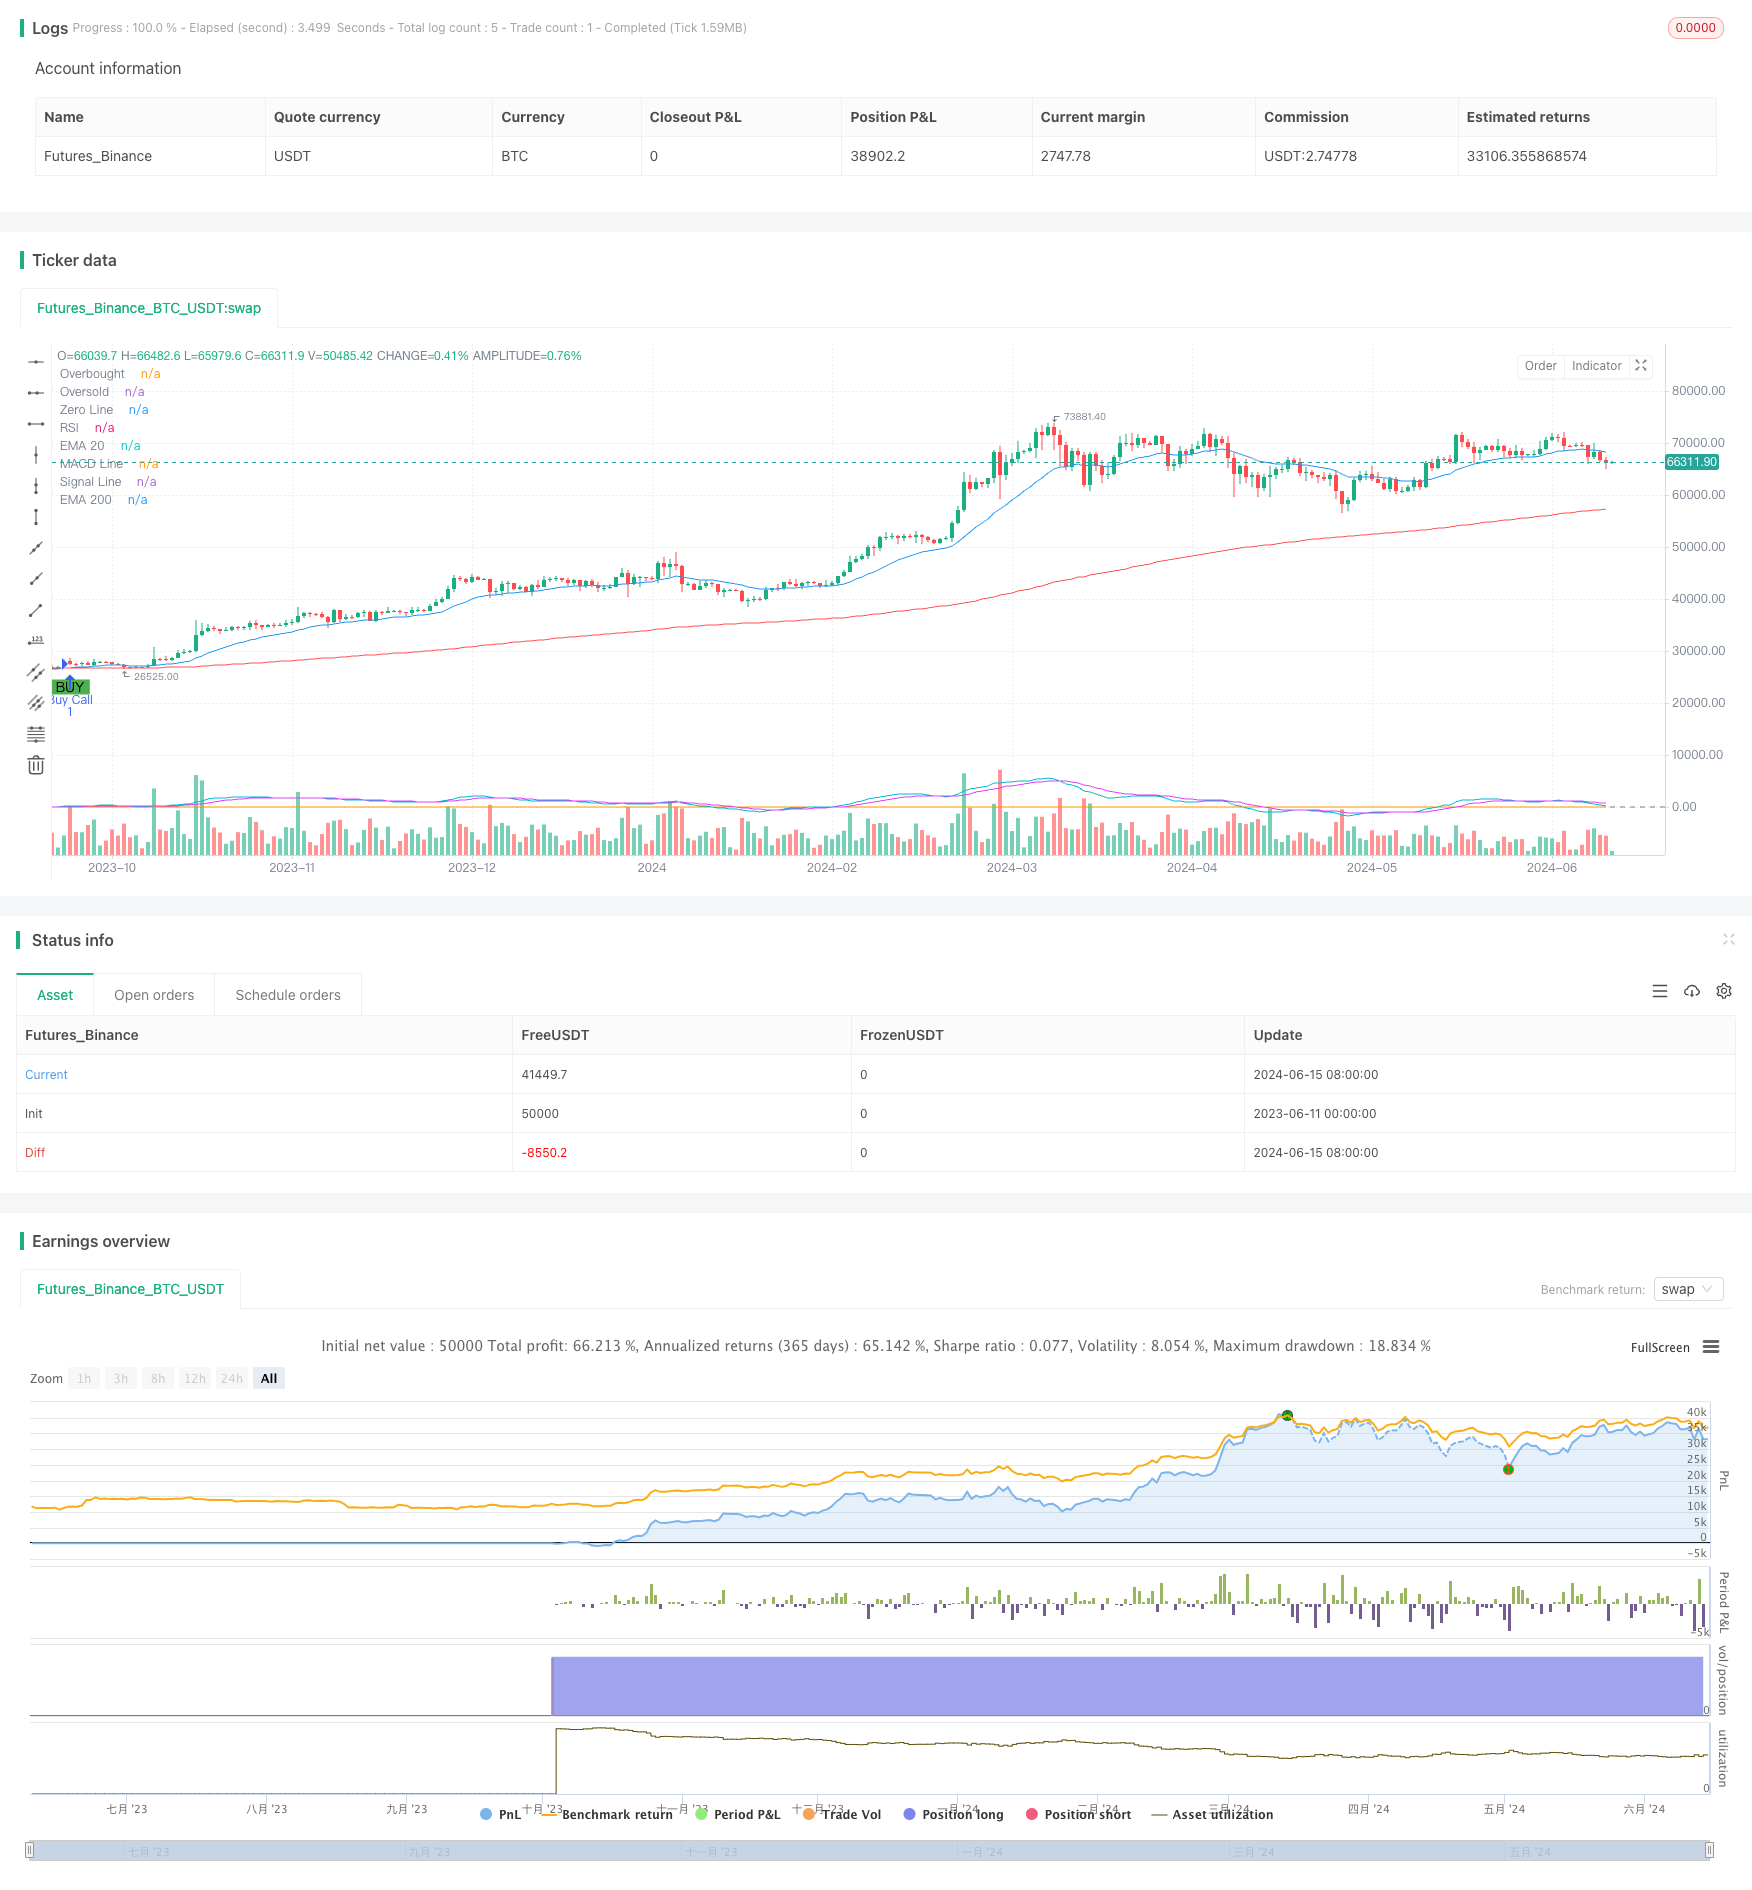
Visão geral
A estratégia baseia-se em sinais cruzados de 20 e 200 dias de média móvel do índice (EMA) e é confirmada em combinação com um indicador de fraqueza relativa (RSI) e um indicador de dispersa de convergência de média móvel (MACD) para produzir sinais de compra e venda. A estratégia também usa um método de stop loss dinâmico e um alvo fixo de ganho para gerenciar o risco de negociação e bloquear os lucros.
Princípio da estratégia
- Calculando o 20o e o 200o EMA, quando o 20o EMA atravessa o 200o EMA, um sinal de compra é gerado; quando o 20o EMA atravessa o 200o EMA, um sinal de venda é gerado.
- O RSI e o MACD são usados para confirmar o sinal de cruzamento do EMA. A compra é executada somente quando o RSI é superior a 50 e a linha do MACD é superior à linha do sinal; a venda é executada somente quando o RSI é inferior a 50 e a linha do MACD é inferior à linha do sinal.
- Defina uma taxa de retorno fixa (por exemplo, 20%) e uma taxa de stop loss inicial (por exemplo, 10%).
- Quando o lucro da posição atingir a taxa de retorno alvo, o preço de parada de perda será aumentado para menos de 10% do preço atual, atingindo a parada de perda dinâmica.
- Quando o preço toca o preço de stop loss dinâmico, a posição de equilíbrio termina em lucro.
Vantagens estratégicas
- A combinação de vários indicadores técnicos que confirmam os sinais de transação aumenta a confiabilidade do sinal.
- O método de stop loss dinâmico, ao mesmo tempo em que bloqueia os lucros, dá ao preço um certo espaço de retração, evitando a liquidação prematura.
- Estabelecer uma taxa de retorno fixa ajuda a controlar o risco e a obter um retorno estável.
Risco estratégico
- Os sinais de cruzamento da EMA podem ocorrer com frequência, causando um aumento nos custos de negociação.
- Em mercados turbulentos, a estratégia pode levar a perdas contínuas.
- Os objetivos fixos de taxa de retorno e de stop loss podem não ser adequados a diferentes condições de mercado e precisam ser ajustados de acordo com a volatilidade do mercado.
Direção de otimização da estratégia
- A introdução de mais indicadores técnicos ou de sentimento de mercado para aumentar a precisão e a confiabilidade dos sinais.
- Utilize a taxa de retorno e a taxa de parada adaptáveis, ajustando-se dinamicamente à volatilidade do mercado e às características dos ativos.
- Combinando tendências de mercado e ciclos de flutuação, usando diferentes configurações de parâmetros em diferentes ambientes de mercado.
Resumir
A estratégia, combinada com a confirmação do RSI e do MACD por meio de sinais cruzados da EMA, bem como uma abordagem de gerenciamento de risco de stop loss dinâmico e ganhos de alvo fixo, promete um lucro estável em mercados em tendência. No entanto, em mercados turbulentos, a estratégia pode enfrentar o risco de negociação frequente e perdas contínuas. Portanto, é necessário otimizar e melhorar ainda mais a estratégia para aumentar a adaptabilidade e a robustez da estratégia.
/*backtest
start: 2023-06-11 00:00:00
end: 2024-06-16 00:00:00
period: 1d
basePeriod: 1h
exchanges: [{"eid":"Futures_Binance","currency":"BTC_USDT"}]
*/

//@version=5
strategy("EMA Crossover Strategy with RSI and MACD Confirmation and Dynamic Trailing Stop Loss", overlay=true)

// Calculate EMAs
ema20 = ta.ema(close, 20)
ema200 = ta.ema(close, 200)

// Calculate RSI
rsi = ta.rsi(close, 14)

// Calculate MACD
[macdLine, signalLine, _] = ta.macd(close, 12, 26, 9)

// Plot EMAs, RSI, and MACD on the chart
plot(ema20, color=color.blue, title="EMA 20")
plot(ema200, color=color.red, title="EMA 200")
hline(70, "Overbought", color=color.red)
hline(30, "Oversold", color=color.green)
plot(rsi, title="RSI", color=color.orange)
hline(0, "Zero Line", color=color.gray)
plot(macdLine, title="MACD Line", color=color.aqua)
plot(signalLine, title="Signal Line", color=color.fuchsia)

// Strategy parameters
targetProfitPercent = 20
trailingStopIncrement = 10

// Strategy variables
var float initialStopLevel = na
var float trailingStopLevel = na

// Strategy rules with RSI and MACD confirmation
longCondition = ta.crossover(ema20, ema200) and rsi > 50 and macdLine > signalLine
shortCondition = ta.crossunder(ema20, ema200) and rsi < 50 and macdLine < signalLine

// Execute trades
if (longCondition)
    strategy.entry("Buy Call", strategy.long)
    initialStopLevel := strategy.position_avg_price * (1 - 0.10) // Initial stop-loss at 10% below entry price

if (shortCondition)
    strategy.entry("Buy Put", strategy.short)

// Calculate profit and loss targets
takeProfit = strategy.position_avg_price * (1 + targetProfitPercent / 100) // 20% profit target

// Update trailing stop loss
if (strategy.opentrades > 0)
    if (strategy.position_size > 0) // Long position
        if (strategy.netprofit >= takeProfit)
            // Update stop-loss based on profit increments
            if (trailingStopLevel == na)
                trailingStopLevel := strategy.position_avg_price * (1 - 0.10) // Initial trailing stop at 10% below entry price
            else
                if (strategy.position_avg_price * (1 - 0.10) > trailingStopLevel)
                    trailingStopLevel := strategy.position_avg_price * (1 - 0.10) // Increase stop-loss to 10% below current price

        // Apply trailing stop loss
        strategy.exit("Take Profit", "Buy Call", stop=trailingStopLevel)

// Plot buy and sell signals on the chart
plotshape(series=longCondition, title="Buy Signal", location=location.belowbar, color=color.green, style=shape.labelup, text="BUY")
plotshape(series=shortCondition, title="Sell Signal", location=location.abovebar, color=color.red, style=shape.labeldown, text="SELL")