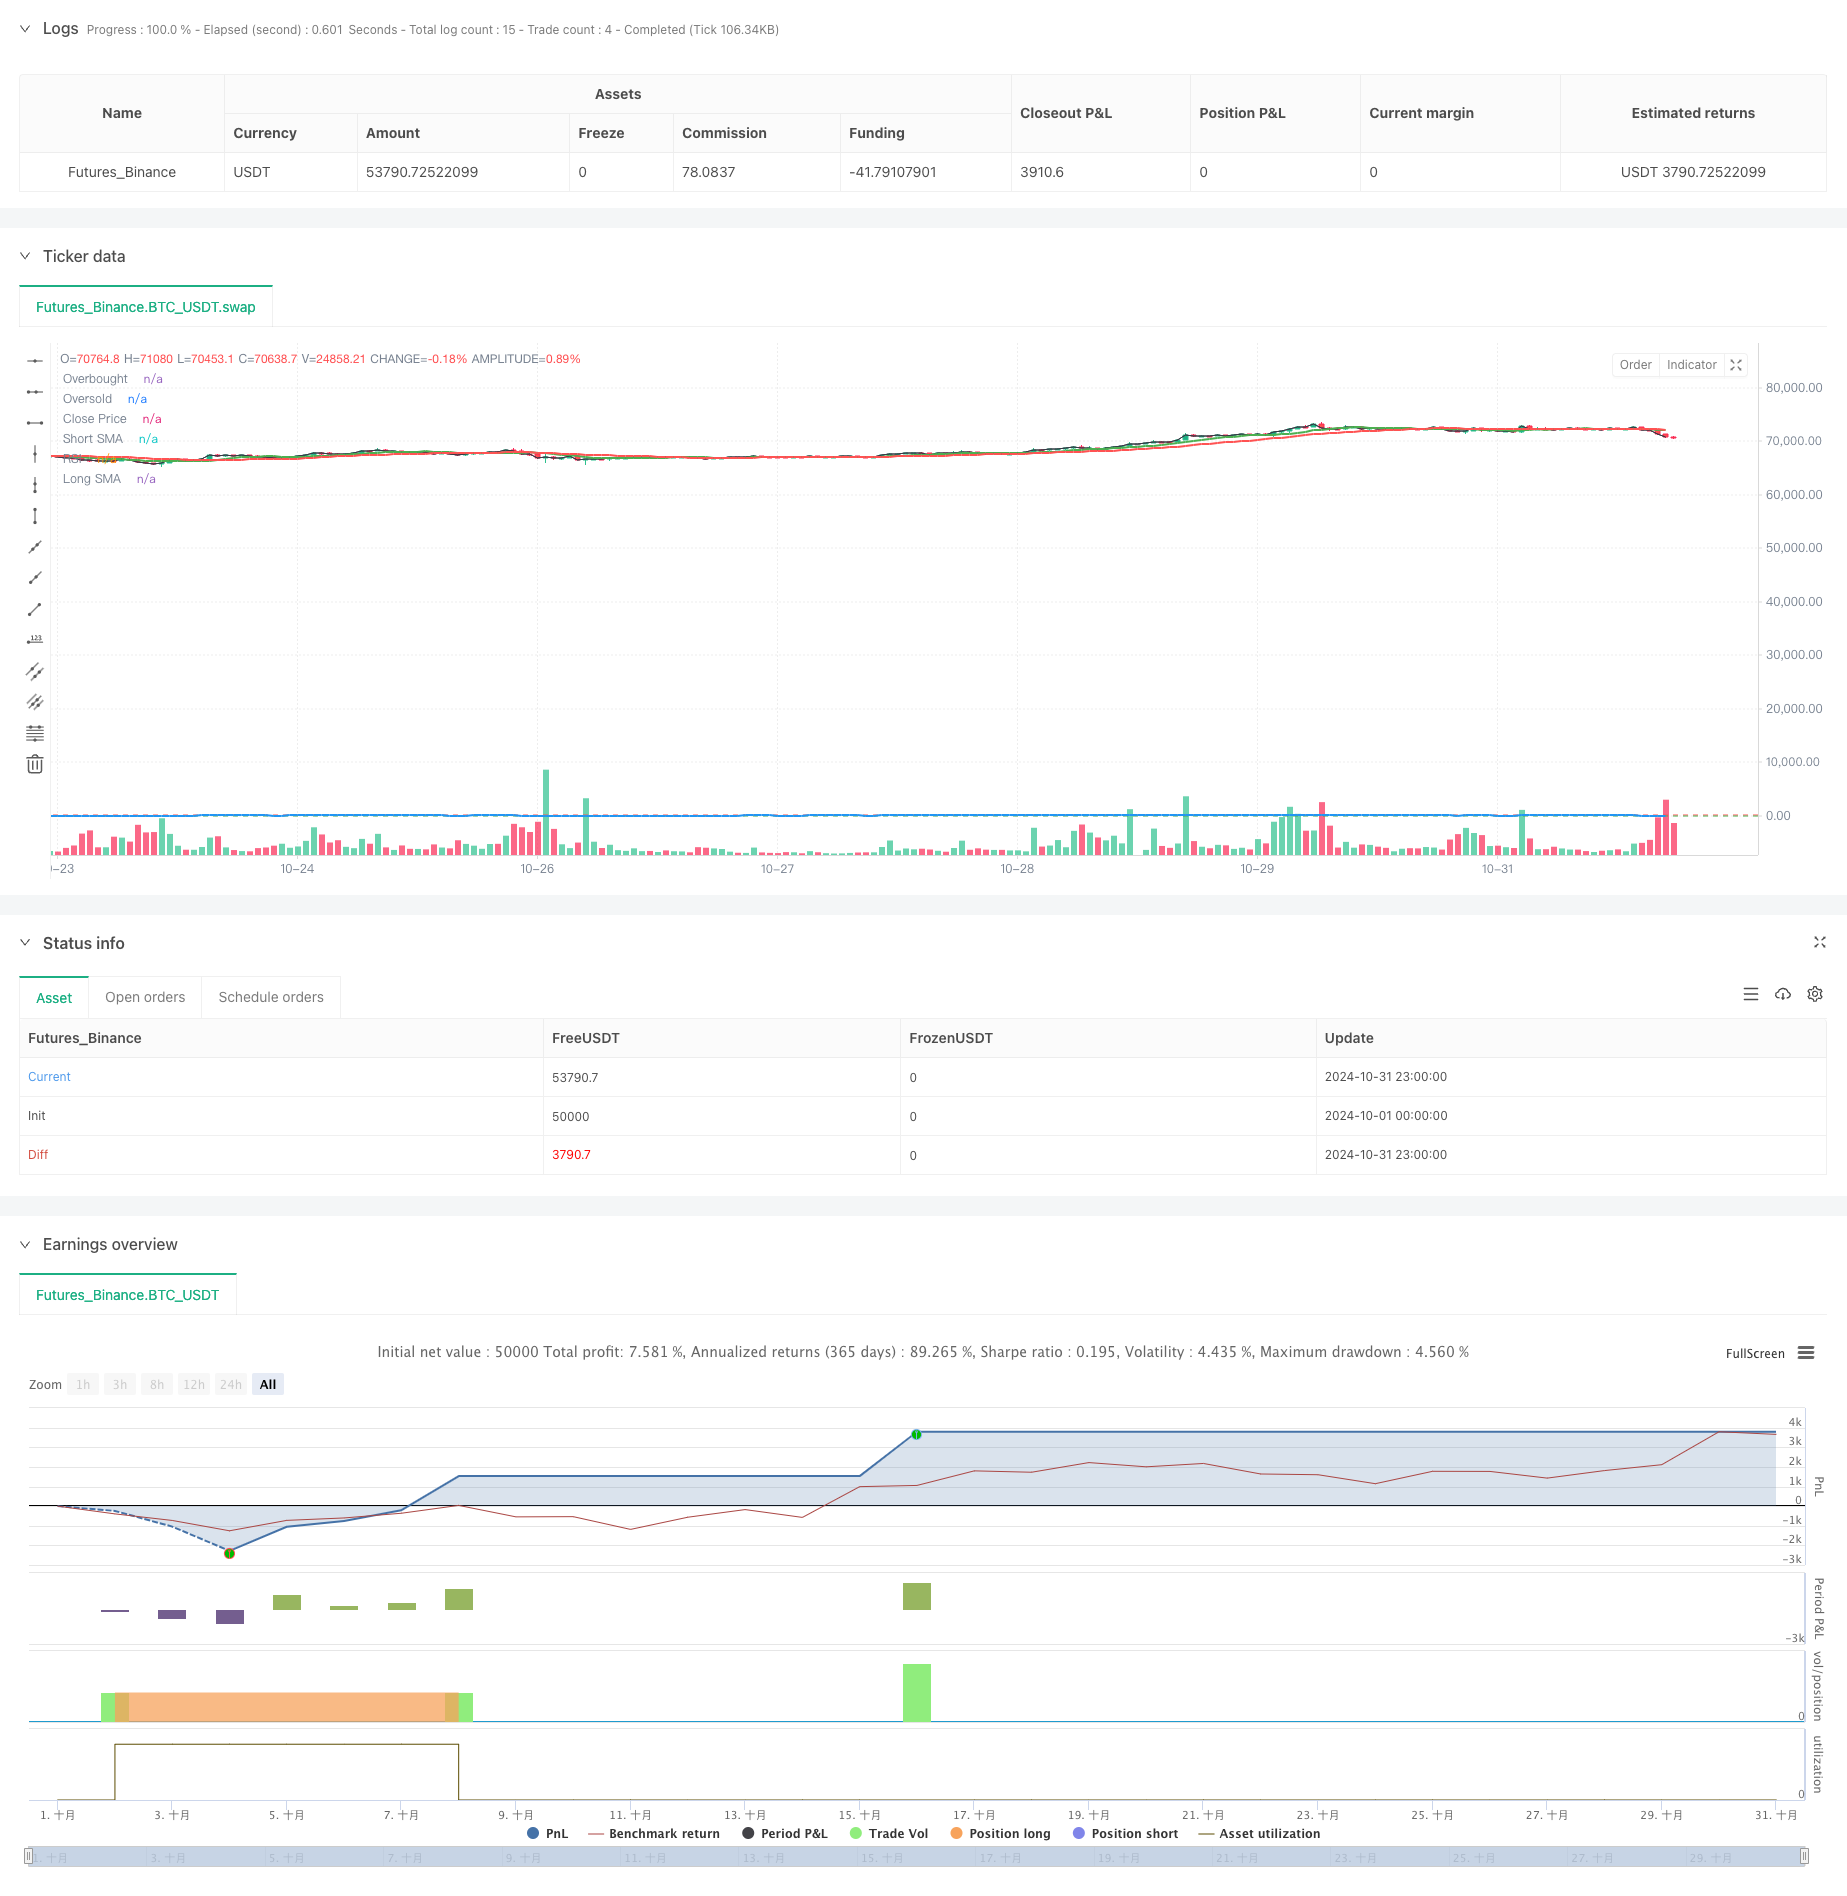
Visão geral
Trata-se de uma estratégia de negociação quantitativa que combina um cruzamento de duas linhas de equilíbrio, um RSI de sobrevenda e um risco-benefício. Esta estratégia determina a direção da tendência do mercado através do cruzamento de médias móveis de curto e longo prazo, ao mesmo tempo em que usa o indicador RSI para identificar áreas de sobrevenda e sobrevenda, permitindo uma filtragem de sinal de negociação mais precisa. A estratégia também integra um sistema de gerenciamento de objetivos de ganho baseado em stop loss dinâmico e um risco-benefício fixo baseado no ATR.
Princípio da estratégia
A estratégia usa duas médias móveis nos dias 9 e 21 como base para o julgamento de tendências, confirmando sinais através da área de sobrevenda e sobrevenda do indicador RSI ((35⁄65)). Em condições de entrada múltipla, a média de curto prazo é exigida acima da média de longo prazo e o RSI está na área de sobrevenda (<35); a entrada em branco requer que a média de curto prazo esteja abaixo da média de longo prazo e o RSI esteja na área de sobrevenda (<65). A estratégia usa um stop loss de 1,5 vezes o valor do ATR e baseia-se em um risco de ganho de 2: 1 em relação à meta de ganho calculada automaticamente.
Vantagens estratégicas
- O mecanismo de confirmação de múltiplos sinais aumentou significativamente a confiabilidade das transações
- A configuração de stop loss dinâmica pode ser adaptada à volatilidade do mercado
- A taxa de risco-benefício fixa contribui para a estabilidade dos lucros a longo prazo
- Limitação do tempo mínimo de manutenção de posições evita o excesso de negociação
- Sistema de marcação visual para monitoramento estratégico e análise de feedback
- Mudança de cor de fundo para visualizar a posição atual
Risco estratégico
- Sistemas de dupla linha podem gerar falsos sinais em mercados em choque
- O RSI pode perder algumas oportunidades de negociação em uma forte tendência
- O risco-benefício fixo pode não ser suficientemente flexível em determinadas circunstâncias de mercado
- A parada ATR pode não ser oportuna em caso de mutação de volatilidade
- O tempo mínimo de detenção pode levar a perdas de tempo
Direção de otimização da estratégia
- Introdução de um mecanismo de seleção de ciclo de equilíbrio adaptativo, ajustado de acordo com a dinâmica do mercado
- Aumentar os filtros de intensidade de tendência para melhorar a qualidade do sinal
- Desenvolver um sistema dinâmico de risco/receita para se adaptar a diferentes cenários de mercado
- Integração de indicadores de transmissão para melhorar a confiabilidade do sinal
- Adição de módulo de análise de volatilidade de mercado para otimizar a escolha do momento de negociação
- Introdução de algoritmos de aprendizado de máquina para otimizar a seleção de parâmetros
Resumir
A estratégia, através da colaboração de múltiplos indicadores técnicos, constrói um sistema de negociação relativamente completo. Ela não se concentra apenas na qualidade dos sinais de entrada, mas também na gestão de riscos e na definição de objetivos de lucro. Embora existam algumas áreas que precisam de otimização, o design geral do quadro é razoável, com bom valor de uso e espaço para expansão.
/*backtest
start: 2024-10-01 00:00:00
end: 2024-10-31 23:59:59
period: 1h
basePeriod: 1h
exchanges: [{"eid":"Futures_Binance","currency":"BTC_USDT"}]
*/

//@version=5
strategy("JakeJohn", overlay=true)

// Input parameters
smaShortLength = input(9, title="Short SMA Length")
smaLongLength = input(21, title="Long SMA Length")
lengthRSI = input(14, title="RSI Length")
rsiOverbought = input(65, title="RSI Overbought Level")
rsiOversold = input(35, title="RSI Oversold Level")
riskRewardRatio = input(2, title="Risk/Reward Ratio") // 2:1
atrMultiplier = input(1.5, title="ATR Multiplier") // Multiplier for ATR to set stop loss

// Calculate indicators
smaShort = ta.sma(close, smaShortLength)
smaLong = ta.sma(close, smaLongLength)
rsi = ta.rsi(close, lengthRSI)
atr = ta.atr(14)

// Entry conditions
longCondition = (smaShort > smaLong) and (rsi < rsiOversold) // Buy when short SMA is above long SMA and RSI is oversold
shortCondition = (smaShort < smaLong) and (rsi > rsiOverbought) // Sell when short SMA is below long SMA and RSI is overbought

// Variables for trade management
var float entryPrice = na
var float takeProfit = na
var int entryBarIndex = na

// Entry logic for long trades
if (longCondition and (strategy.position_size == 0))
    entryPrice := close
    takeProfit := entryPrice + (entryPrice - (entryPrice - (atr * atrMultiplier))) * riskRewardRatio
    strategy.entry("Buy", strategy.long)
    entryBarIndex := bar_index // Record the entry bar index
    label.new(bar_index, high, "BUY", style=label.style_label_up, color=color.green, textcolor=color.white, size=size.small)

// Entry logic for short trades
if (shortCondition and (strategy.position_size == 0))
    entryPrice := close
    takeProfit := entryPrice - (entryPrice - (entryPrice + (atr * atrMultiplier))) * riskRewardRatio
    strategy.entry("Sell", strategy.short)
    entryBarIndex := bar_index // Record the entry bar index
    label.new(bar_index, low, "SELL", style=label.style_label_down, color=color.red, textcolor=color.white, size=size.small)

// Manage trade duration and exit after a minimum of 3 hours
if (strategy.position_size != 0)
    // Check if the trade has been open for at least 3 hours (180 minutes)
    if (bar_index - entryBarIndex >= 180) // 3 hours in 1-minute bars
        if (strategy.position_size > 0)
            strategy.exit("Take Profit Long", from_entry="Buy", limit=takeProfit)
        else
            strategy.exit("Take Profit Short", from_entry="Sell", limit=takeProfit)

// Background colors for active trades
var color tradeColor = na
if (strategy.position_size > 0)
    tradeColor := color.new(color.green, 90) // Light green for long trades
else if (strategy.position_size < 0)
    tradeColor := color.new(color.red, 90) // Light red for short trades
else
    tradeColor := na // No color when no trade is active

bgcolor(tradeColor, title="Trade Background")

// Plotting position tools
if (strategy.position_size > 0)
    // Plot long position tool
    strategy.exit("TP Long", limit=takeProfit)

if (strategy.position_size < 0)
    // Plot short position tool
    strategy.exit("TP Short", limit=takeProfit)

// Plotting indicators
plot(smaShort, color=color.green, title="Short SMA", linewidth=2)
plot(smaLong, color=color.red, title="Long SMA", linewidth=2)

// Visual enhancements for RSI
hline(rsiOverbought, "Overbought", color=color.red)
hline(rsiOversold, "Oversold", color=color.green)
plot(rsi, color=color.blue, title="RSI", linewidth=2)

// Ensure there's at least one plot function
plot(close, color=color.black, title="Close Price", display=display.none) // Hidden plot for compliance