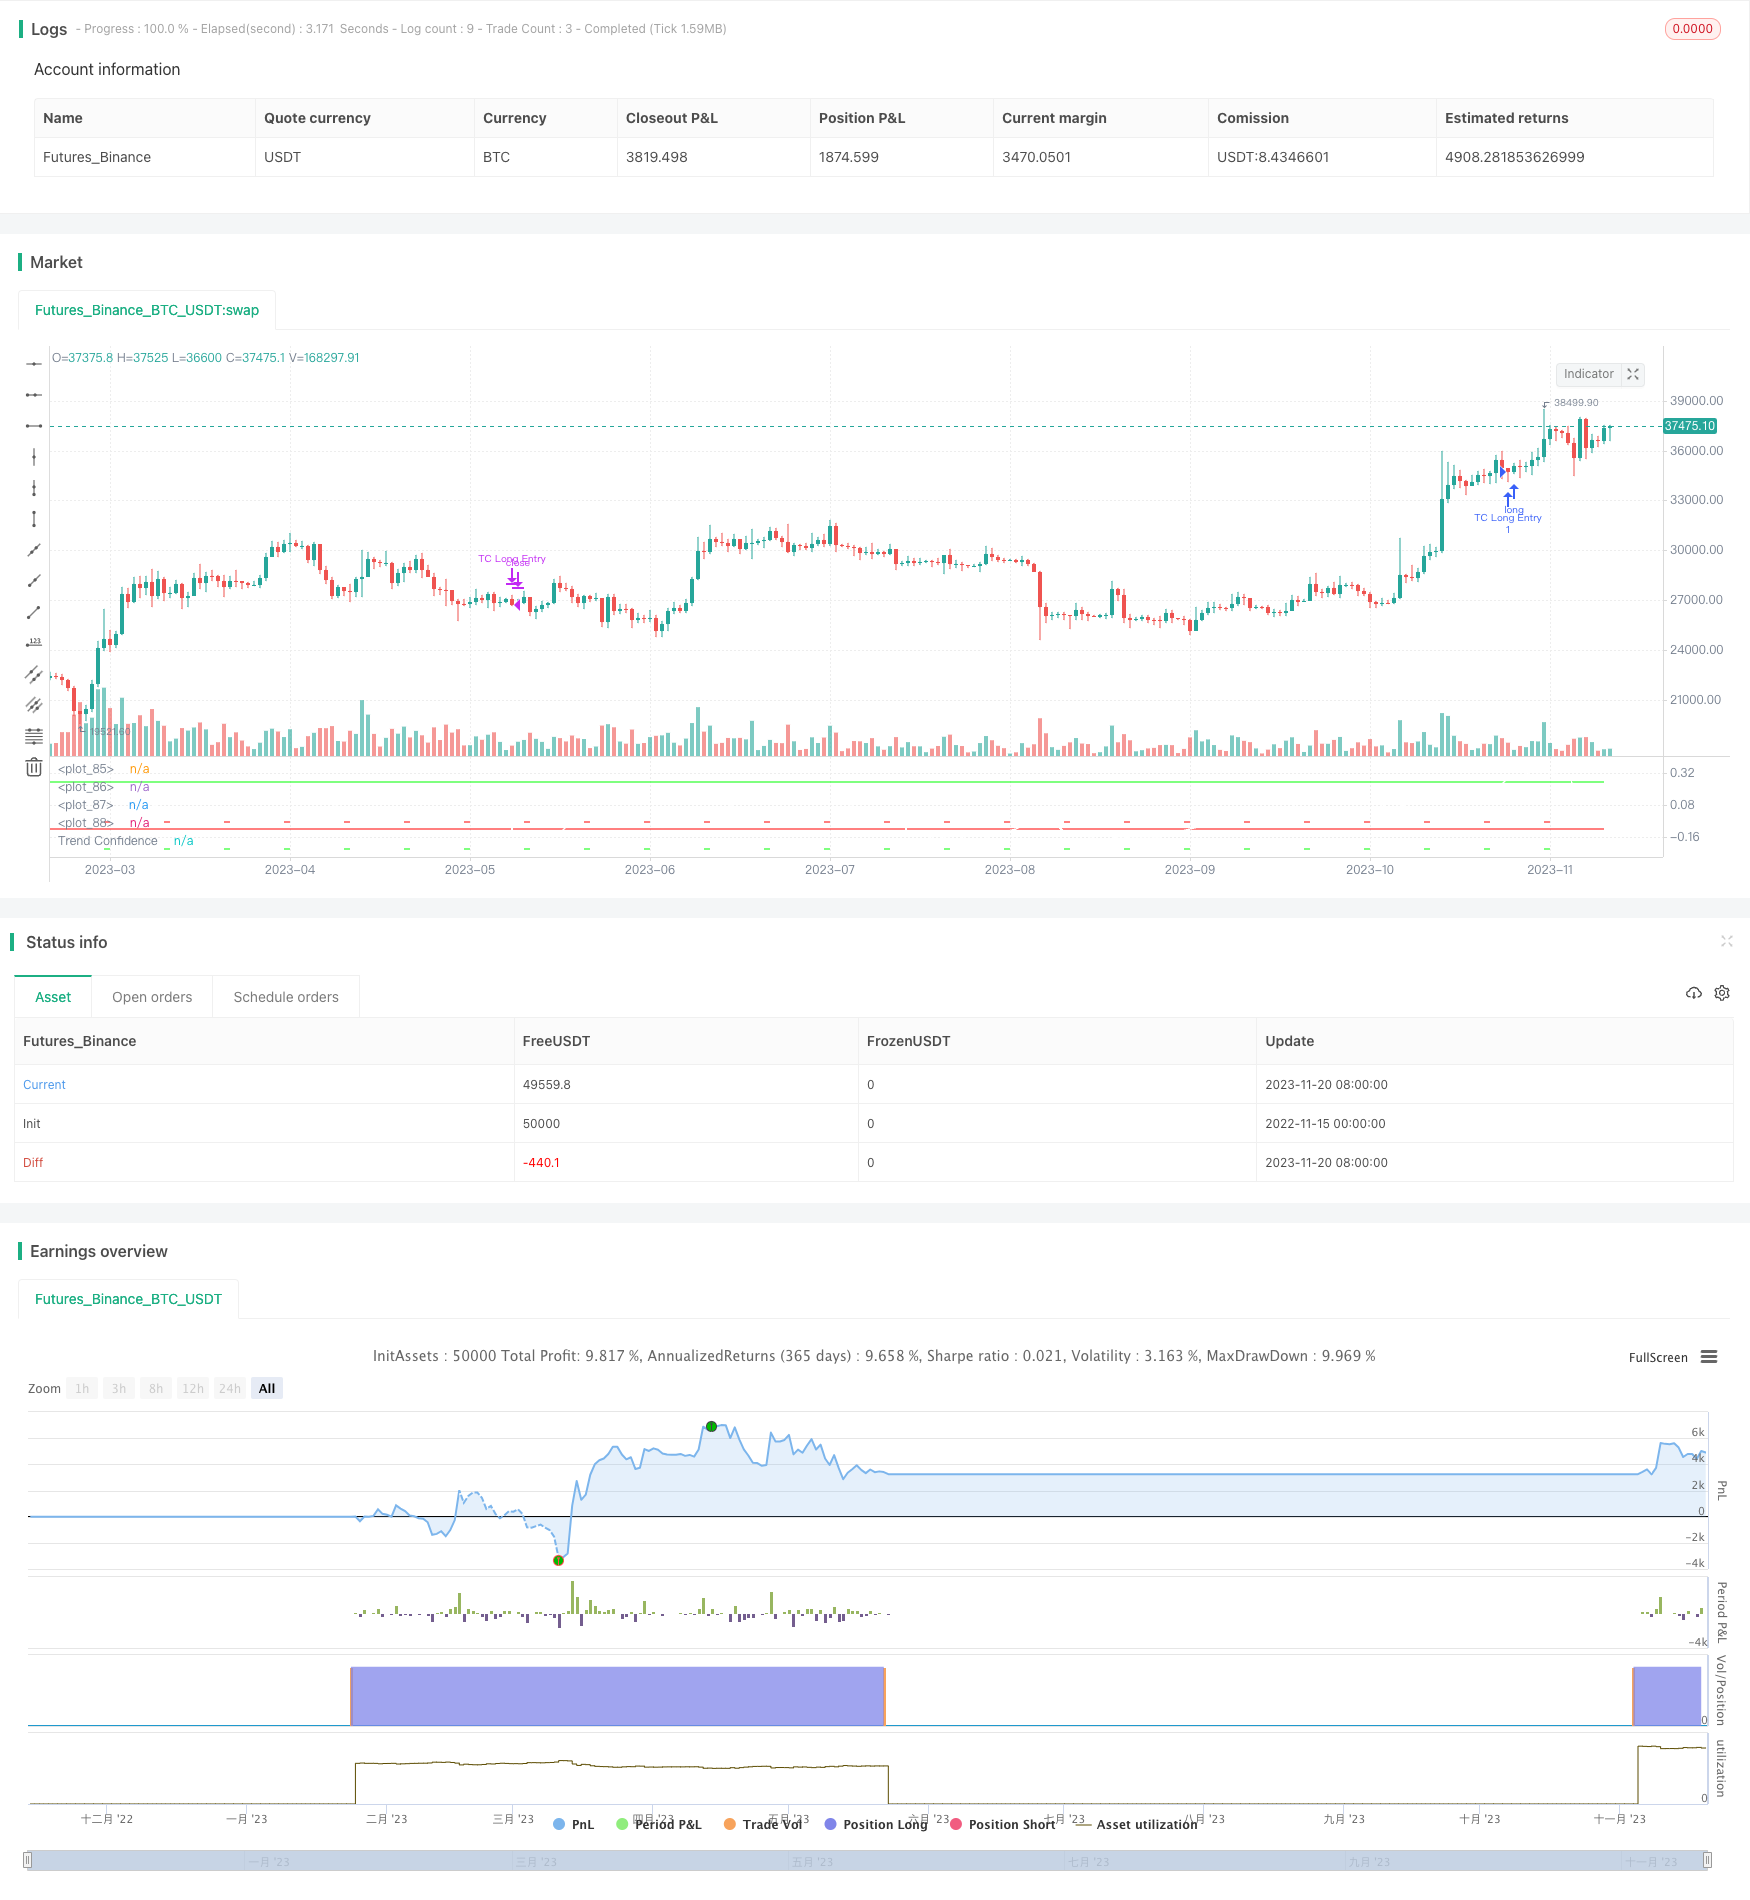
Стратегия, основанная на доверии к тренду
Автор:Чао Чжан, Дата: 2023-11-22 15:50:07Тэги:

Обзор
Основная идея этой стратегии заключается в том, чтобы реализовать как можно более точную следующую стратегию. Она оценивает возможность непрерывности текущей линейной тенденции, рассчитывая
Принцип стратегии
Стратегия рассчитывает линейную соответствие прошлых N закрывающих цен с помощью обычной линейной регрессии, получая наклон k и стандартное отклонение σ от отклонения от закрывающих цен.
Когда уверенность в тренде превышает порог
Таким образом, он может отфильтровать сигналы от диких движений цен, которые не следуют четкой линейной тенденции.
Анализ преимуществ
Стратегия сочетает в себе методы следования тенденциям и линейной регрессии в статистике, которые могут избежать краткосрочных колебаний цен и следовать только долгосрочным тенденциям, тем самым получая более низкую частоту торговли и более высокий показатель выигрыша.
Стратегия имеет большое пространство для настройки параметров и может быть адаптирована к различным продуктам и временным рамкам путем корректировки параметров, достигая хорошей обобщенности.
Анализ рисков
Стратегия имеет риск быть пойманной в ловушку. Она будет генерировать большие потери, когда произойдет значительное изменение тренда. Кроме того, неправильные настройки параметров также могут привести к переоценке или упущению хороших торговых возможностей.
Стоп-лосс можно установить для контроля риска снижения, в то же время выбор параметров должен быть тщательно оценен, чтобы избежать перенапряжения.
Руководство по оптимизации
Стратегия может быть дополнительно оптимизирована в следующих аспектах:
-
Добавить логику стоп-лосса/приобретения прибыли для блокировки прибыли и контроля рисков
-
Добавить модуль адаптивной оптимизации для регулировки динамических параметров
-
Добавьте модель машинного обучения для определения точек переворота тренда и дальнейшего улучшения показателя победы
-
Испытание адаптивности на различных продуктах и сроках для улучшения обобщения
Заключение
В целом, это долгосрочная стратегия с контролем рисков. Она сочетает в себе методы трендового отслеживания и линейной регрессии для фильтрации шума торговых сигналов. Благодаря настройке параметров, она может хорошо адаптироваться к различным продуктам и временным рамкам, и является эффективной стратегией, достойной углубленных исследований и улучшений.
/*backtest
start: 2022-11-15 00:00:00
end: 2023-11-21 00:00:00
period: 1d
basePeriod: 1h
exchanges: [{"eid":"Futures_Binance","currency":"BTC_USDT"}]
*/

// This source code is subject to the terms of the Mozilla Public License 2.0 at https://mozilla.org/MPL/2.0/
// © carefulCamel61097

// ################################################################################################

// "This is a trend following strategy that performed very well on the past 5 years"
// "Intended to be used on BTC-USDT, 4hr timeframe"

// "A factor 2 Leverage can be added by changing Order Size to 200% of equity"
// "Higher leverage is not recommended due to big drawdowns"

// "Also seems to work on 1D timeframe, although ideal parameters may be different"
// "Also seems to work on ETH-USDT and some other altcoins, although ideal parameters are different"

// ################################################################################################

//@version=5
strategy("Trend Following based on Trend Confidence", overlay=false )

// Inputs

source      = input(close)

since       = input(timestamp('2000-01-01'), title='Start trading interval')
till        = input(timestamp('2030-01-01'), title='End trading interval')

length      = input(30, title='Length')

longs_on    = input.bool(true, title='Longs')
shorts_on   = input.bool(true, title='Shorts')

// Parameters for best performance 2018 - 2022
// long_entry  = input.float(0.26, step=0.01, title='Long entry threshold')
// long_exit   = input.float(-0.10, step=0.01, title='Long exit threshold')
// short_entry = input.float(-0.24, step=0.01, title='Short entry threshold')
// short_exit  = input.float(-0.04, step=0.01, title='Short exit threshold')

long_entry  = input.float(0.25, step=0.01, title='Long entry threshold')
long_exit   = input.float(-0.10, step=0.01, title='Long exit threshold')
short_entry = input.float(-0.25, step=0.01, title='Short entry threshold')
short_exit  = input.float(-0.05, step=0.01, title='Short exit threshold')

stop_loss   = input.float(10, step=1, title='Stop loss (percentage)') / 100

// Trend Confidence

linreg = ta.linreg(source, length, 0)
linreg_p = ta.linreg(source, length, 0+1)

x = bar_index
slope = linreg - linreg_p
intercept = linreg - x*slope
deviationSum = 0.0
for i = 0 to length-1
    deviationSum := deviationSum + math.pow(source[i]-(slope*(x-i)+intercept), 2)
deviation = math.sqrt(deviationSum/(length))

slope_perc = slope / source[0]
deviation_perc = deviation / source[0]
trend_confidence = slope_perc / deviation_perc

// Strategy

in_interval = true

sl_long = strategy.position_avg_price * (1 - stop_loss)
sl_short = strategy.position_avg_price * (1 + stop_loss)

if in_interval and longs_on and ta.crossover(trend_confidence, long_entry)
    strategy.entry("TC Long Entry", strategy.long)
    strategy.exit("TC Long Exit", stop=sl_long)
if in_interval and longs_on and ta.crossunder(trend_confidence, long_exit)
    strategy.close("TC Long Entry")

if in_interval and shorts_on and ta.crossunder(trend_confidence, short_entry)
    strategy.entry("TC Short Entry", strategy.short)
    strategy.exit("TC Short Exit", stop=sl_short)
if in_interval and shorts_on and ta.crossover(trend_confidence, short_exit)
    strategy.close("TC Short Entry")

// Plots

plot(trend_confidence, "Trend Confidence", color.rgb(255, 255, 255))

plot(long_entry, "", color.rgb(0, 255, 0), linewidth=1)
plot(long_exit, "", color.rgb(255, 0, 0), linewidth=1)
plot(short_entry, "", color=bar_index % 10 == 0 ? color.rgb(0, 255, 0) : #00000000, linewidth=1)
plot(short_exit, "", color=bar_index % 10 == 0 ? color.rgb(255, 0, 0) : #00000000, linewidth=1)
- Современная стратегия оптимизации индекса относительной силы преобразования Лагуре
- Стратегия двойного движущегося среднего перекрестного тренда
- Bollinger Band Trend Chaser (Поддерживающий тренд полосы Боллинджера)
- Стратегия перекрестного использования скользящей средней
- Стратегия Кайру
- Тенденция, основанная на стратегии, основанной на стохастике и CCI
- Количественная стратегия DPD-RSI-BB
- Стратегия перекрестного использования двойной скользящей средней
- Стратегия обратного открытия поглощения
- многочисленные технические показатели Стратегия прорыва импульса
- Стратегия по ловушке дна
- Стратегия двойной тяги на основе SMA
- Стратегия прорыва GetString Momentum
- Стратегия двойной системы импульсной торговли
- Система пересечения периодов
- Интеллектуальная отслеживание двойных линий тренда BTC инвестиционная стратегия
- Стратегия PMax Breakout на основе показателей RSI и T3
- Стратегия двойного перекрестного переворота RSI
- 123 Сдвижная средняя конвергенция
- Heikin Ashi Высокий низкий канал Динамическая скользящая средняя стратегия торговли