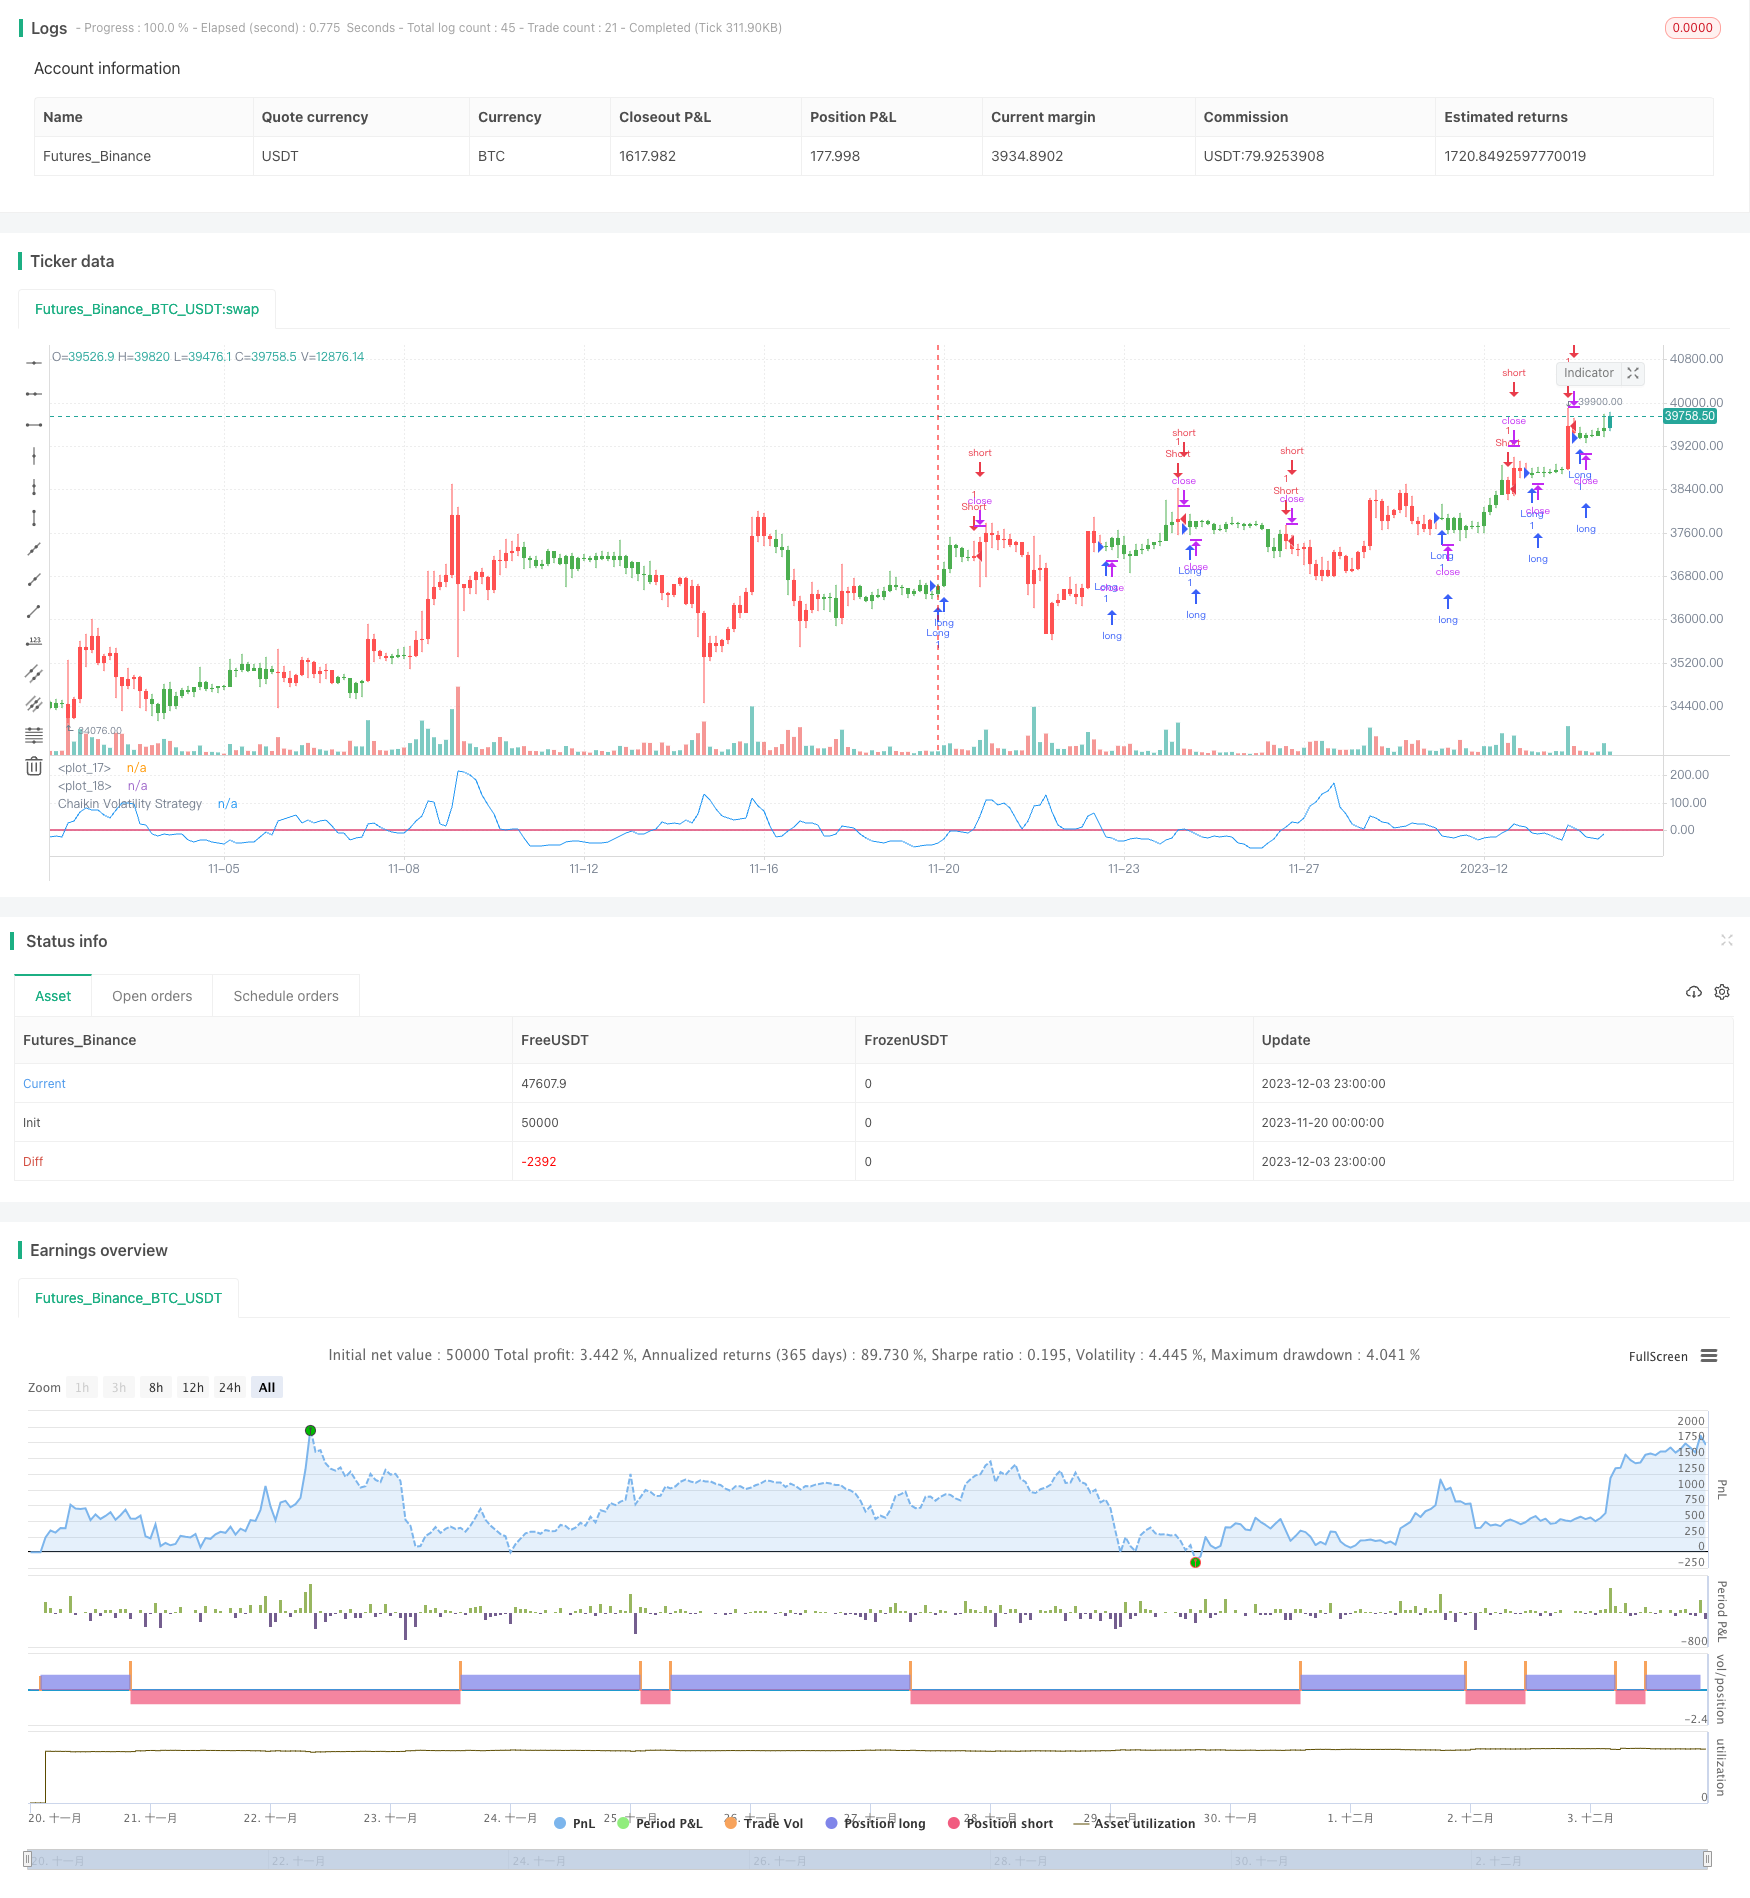
Краткосрочная стратегия торговли на основе индикатора волатильности Chaikin
Автор:Чао Чжан, Дата: 2021-12-21 16:14:56Тэги:

Обзор
Эта стратегия разрабатывает краткосрочную торговую систему, основанную на индикаторе волатильности Чейкина для улавливания краткосрочных колебаний рынка.
Логика стратегии
Индикатор волатильности Чейкина количественно измеряет волатильность путем измерения спрэда между самой высокой и самой низкой ценами ценной бумаги.
Конкретная логика этой стратегии заключается в следующем:
- Расчет показателя волатильности Chaikin (xROC_EMA)
- Установка порога запуска (Trigger)
- Пройти длинный путь, когда xROC_EMA пересекается над Trigger; пройти короткий путь, когда xROC_EMA пересекается ниже Trigger
- Опция торговли в обратном направлении
Анализ преимуществ
Преимущества этой стратегии включают:
- Быстрая реакция, подходящая для краткосрочной торговли
- Относительно небольшие изъятия, некоторое влияние управления капиталом
- Простой в применении и понятный
- Гибкая корректировка параметров для различных рыночных условий
Анализ рисков
Существуют также некоторые риски:
- Высокая частота торгов увеличивает риск переоценки
- Параметры, такие как длина и триггер могут быть перемещены
- Уязвимость к убыткам при реверсии торговли
- Не может эффективно фильтровать рыночный шум, некоторые ошибочные сделки
Решения:
- Корректировка параметров для контроля частоты торговли
- Оптимизировать параметры для предотвращения перенастройки
- Используйте более широкие остановки, чтобы позволить некоторое восстановление цены
- Добавить фильтры для уменьшения ложных сигналов
Оптимизация
Стратегия может быть улучшена путем:
- Включить показатели структуры для определения тенденций и уровней поддержки
- Добавьте фильтры, такие как объем и скользящие средние, чтобы уменьшить сбои
- Динамическая корректировка параметров на основе меняющихся рыночных условий
- Улучшить механизмы остановки потерь, например, остановки отслеживания или выход из люстры, чтобы получить больше прибыли
Заключение
Стратегия имеет простую и ясную логику, подходящую для краткосрочной торговли. Гибкие параметры могут быть скорректированы по мере необходимости. Существуют риски перенапряжения и высокой частоты торговли. Дальнейшие оптимизации могут сделать стратегию более надежной для более устойчивой производительности.
/*backtest
start: 2023-11-20 00:00:00
end: 2023-12-04 00:00:00
period: 3h
basePeriod: 15m
exchanges: [{"eid":"Futures_Binance","currency":"BTC_USDT"}]
*/

//@version = 2
////////////////////////////////////////////////////////////
//  Copyright by HPotter v1.0 01/12/2016
// Chaikin's Volatility indicator compares the spread between a security's
// high and low prices. It quantifies volatility as a widening of the range
// between the high and the low price.
// You can use in the xPrice1 and xPrice2 any series: Open, High, Low, Close, HL2,
// HLC3, OHLC4 and ect...
// You can change long to short in the Input Settings
// Please, use it only for learning or paper trading. Do not for real trading.
///////////////////////////////////////////////////////////
strategy(title="Chaikin Volatility Strategy Backtest")
Length = input(10, minval=1)
ROCLength = input(12, minval=1)
Trigger = input(0, minval=1)
reverse = input(false, title="Trade reverse")
hline(0, color=purple, linestyle=line)
hline(Trigger, color=red, linestyle=line)
xPrice1 = high
xPrice2 = low
xPrice = xPrice1 - xPrice2
xROC_EMA = roc(ema(xPrice, Length), ROCLength)
pos = iff(xROC_EMA < Trigger, 1,
	   iff(xROC_EMA > Trigger, -1, nz(pos[1], 0)))
possig = iff(reverse and pos == 1, -1,
         iff(reverse and pos == -1, 1, pos))
if (possig == 1)
    strategy.entry("Long", strategy.long)
if (possig == -1)
    strategy.entry("Short", strategy.short)
barcolor(pos == -1 ? red: pos == 1 ? green : blue )
plot(xROC_EMA, color=blue, title="Chaikin Volatility Strategy")
- Количественная стратегия прорыва торговой цены
- Стратегия индекса относительной энергии Элерса Фишера
- Двойной импульс прорыв и волатильность фильтрации алгоритмической стратегии торговли
- Комплексная стратегия с несколькими скользящими средними
- Стратегия комбинированного показателя RSI с переворотом цены
- Стратегия прорыва облачной туманности с двойным средним движением
- MACD Золотой крест Смертный крест Тенденция
- Стратегия, следующая тренду черепах
- Стратегия тренда на канале Дончиан с двойным подтверждением
- Стратегия отмены момента на основе многофакторной модели
- Стратегия отслеживания тенденций перекрестного использования двойного MA
- Супер-Тренд Трипл Стратегия
- Динамическая стратегия остановки потерь
- Стратегия перекрестного использования скользящей средней с остановкой потерь и получением прибыли
- Средняя обратная стратегия, основанная на скользящей средней
- Стратегия торговли высокой частотой на основе полос Боллинджера
- Количественная стратегия Ichimoku Cloud Trading
- Стратегия импульса, основанная на модели двойного прорыва
- Стратегия стохастического вихря
- Многопериодная стратегия торговли на основе индекса волатильности и стохастического осциллятора