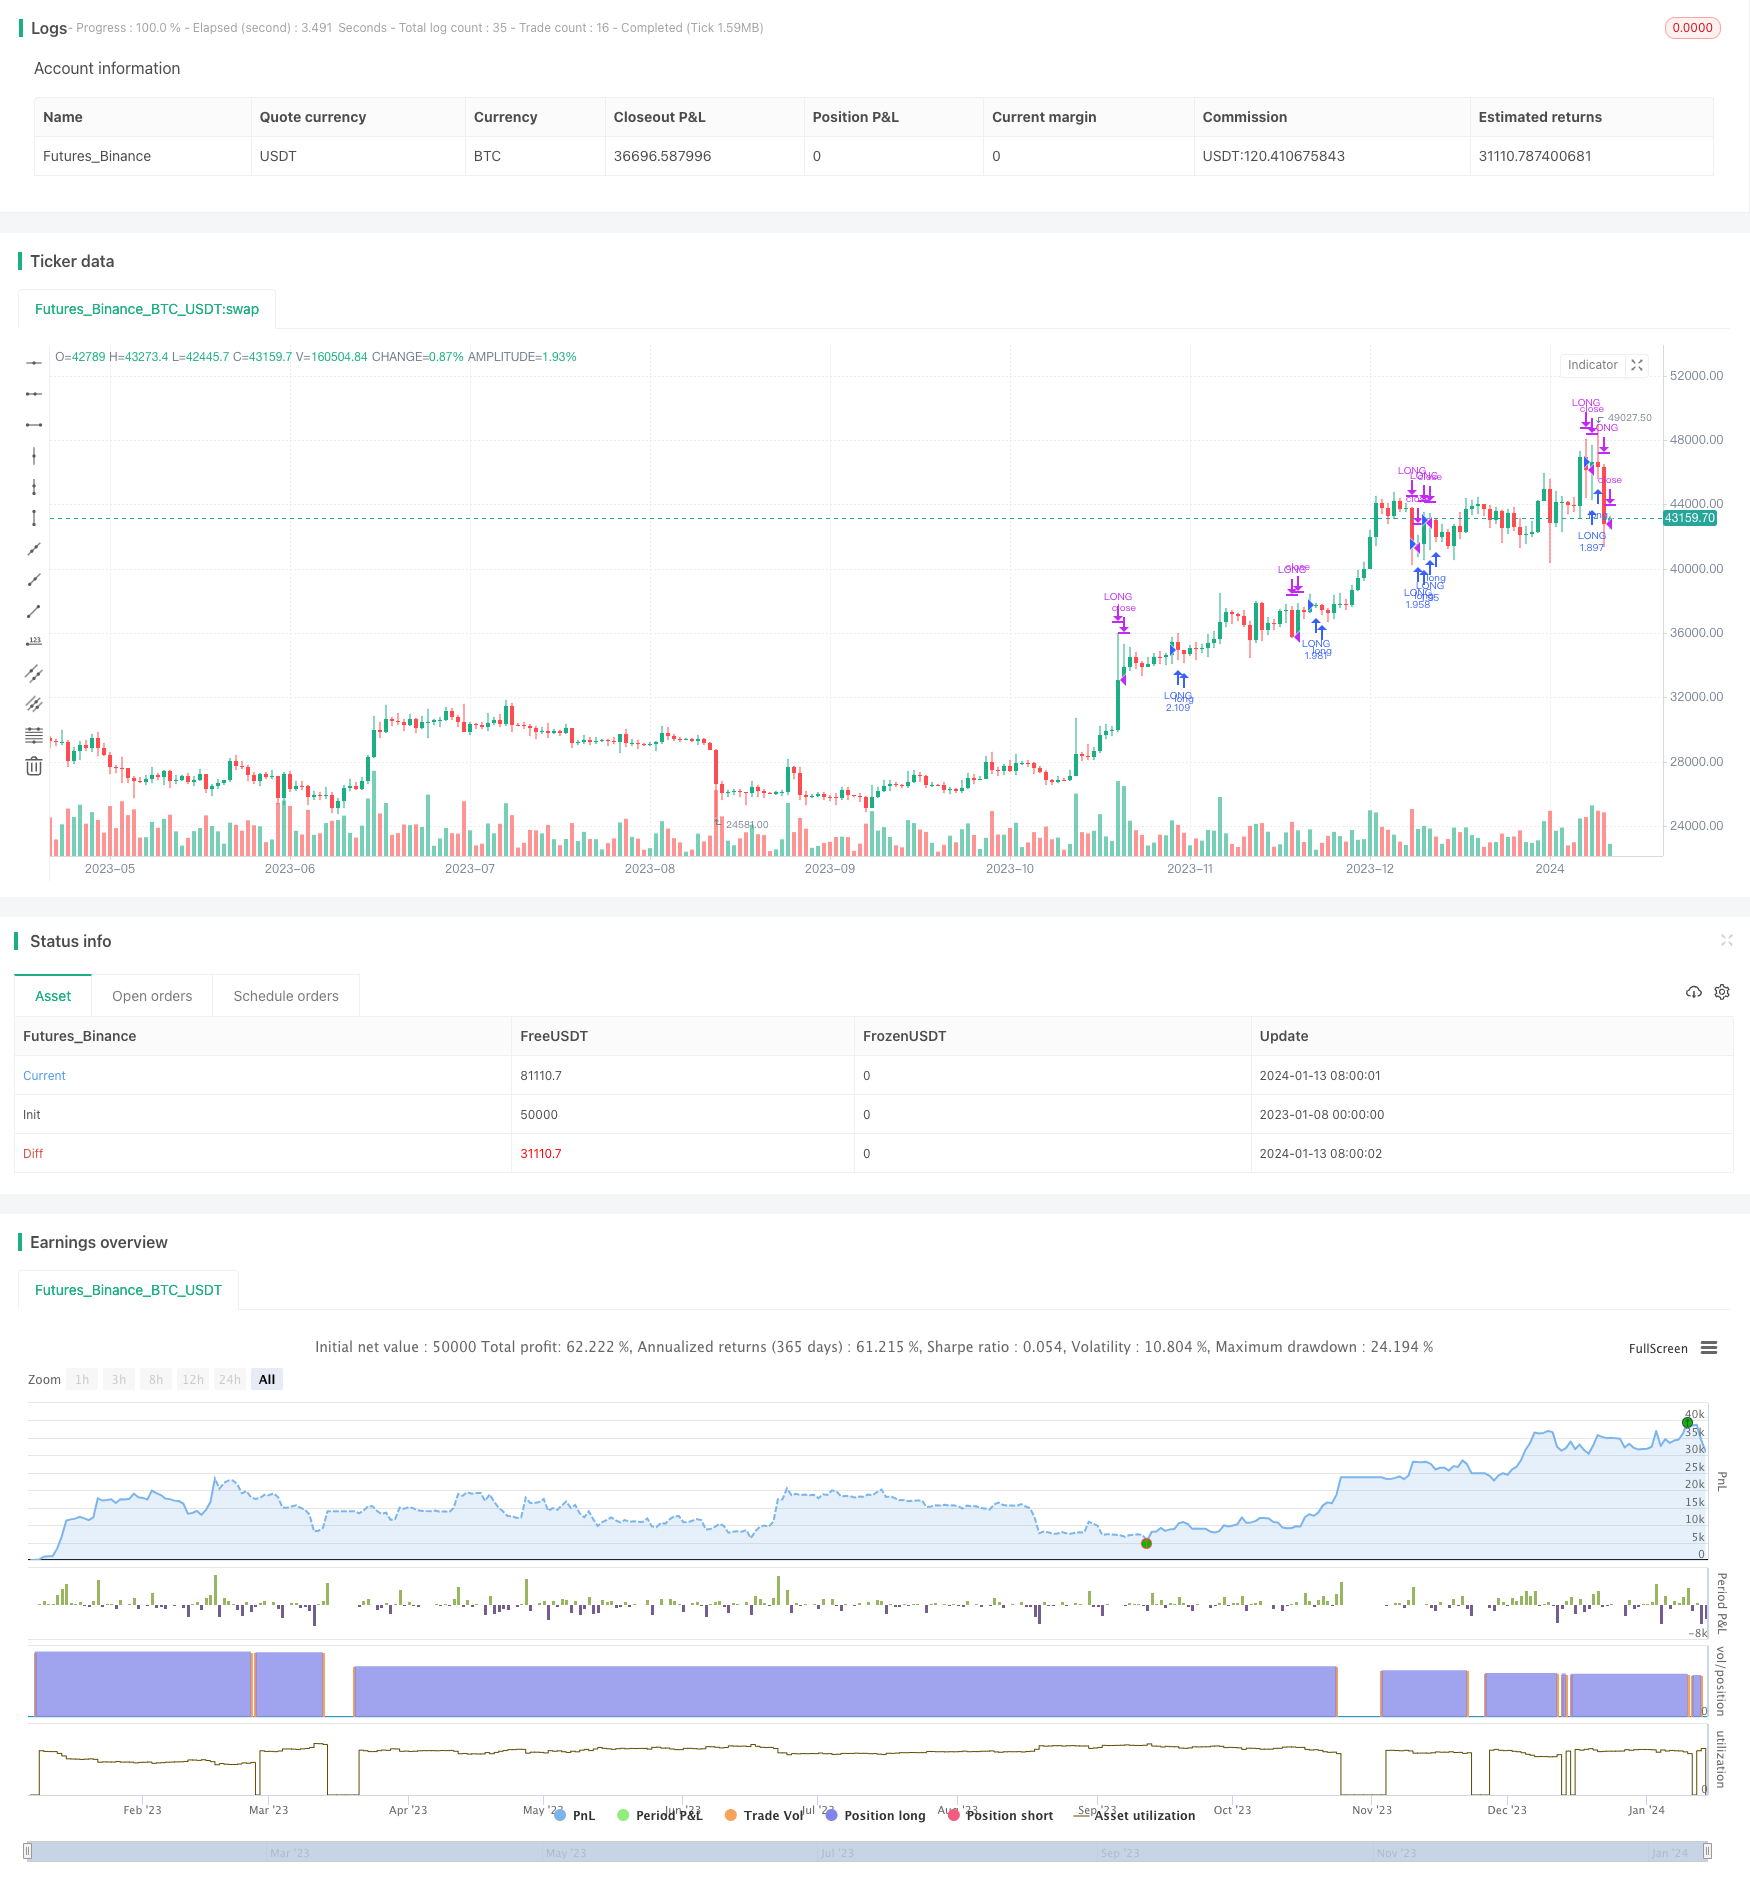
Волатильность фильтрованная стратегия планирования рынка
Автор:Чао Чжан, Дата: 2024-01-15 12:27:47Тэги:

Обзор
Эта стратегия реализует усовершенствованную стратегию покупки и хранения, добавляя фильтр, основанный на исторической волатильности.
Логика стратегии
- Расчет исторической волатильности SPY за последние 100 дней
- Если текущая волатильность выше 95-го процентили волатильности за последние 100 дней, фильтруйте этот день торговли, закрывайте длинную позицию
- Если волатильность ниже 95-го процентного пункта, введите длинную позицию
Анализ преимуществ
По сравнению с простым покупкой и удержанием без фильтра, эта стратегия улучшила годовую доходность за 28-летний период обратного теста (7,95% против 9,92%) и значительно снизила максимальную прибыль (50,79% против 31,57%).
Анализ рисков
Основные риски возникают из-за точности методологии расчета волатильности и настройки параметров фильтра. Если вычисление волатильности неточно, фильтр потерпит неудачу. Если параметры фильтра настроены плохо (слишком консервативно или агрессивно), это может негативно повлиять на доходность стратегии. Кроме того, прошлые результаты не гарантируют будущие результаты.
Руководство по оптимизации
Подумайте о добавлении других подтверждающих индикаторов в качестве дополнительных фильтров, таких как долгосрочная скользящая средняя, индекс ADX и т. Д. Настройка параметров также имеет решающее значение, например, тестирование различных периодов просмотра, фильтрация порогов и т. Д. Методы машинного обучения и анализа временных рядов также могут быть использованы для создания и оптимизации модели прогнозирования волатильности.
Резюме
Эта стратегия значительно улучшила доходность и уменьшила максимальное снижение стратегии покупки и хранения SPY с помощью простого фильтра волатильности. Она показывает важность определения рыночного режима и распределения активов. Мы можем еще больше усовершенствовать ее, оптимизируя модель волатильности и добавляя подтверждающие сигналы.
/*backtest
start: 2023-01-08 00:00:00
end: 2024-01-14 00:00:00
period: 1d
basePeriod: 1h
exchanges: [{"eid":"Futures_Binance","currency":"BTC_USDT"}]
*/

// This source code is subject to the terms of the Mozilla Public License 2.0 at https://mozilla.org/MPL/2.0/
//
// @author Sunil Halai
//
// This script has been created to demonstrate the effectiveness of using market regime filters in your trading strategy, and how they can improve your returns and lower your drawdowns
//
// This strategy adds a simple filter (The historical volatility filter, which can be found on my trading profile) to a traditional buy and hold strategy of the index SPY. There are other filters
// that could also be added included a long term moving average / percentile rank filter / ADX filter etc, to improve the returns further.
//
// The filter added closes our long position during periods of volatility that exceed the 95th percentile (or in the top 5% of volatile days)
//
// Have included the back test results since 1993 which is 28 years of data at the time of writing,  Comparing  buy and hold of the SPY (S&P 500), to improved by and hold offered here.
//
// Traditional buy and hold:
//
// Return per year:     7.95   % (ex Dividends)
// Total return :       851.1  %
// Max drawdown:        50.79  %
//
// 'Modified' buy and hold (this script):
//
// Return per year:     9.92    % (ex Dividends)
// Total return:        1412.16 %
// Max drawdown:        31.57   %
//
// Feel free to use some of the market filters in my trading profile to improve and refine your strategies further, or make a copy and play around with the code yourself. This is just
// a simple example for demo purposes.
//

//@version=4
strategy(title = "Simple way to beat the market [STRATEGY]", shorttitle = "Beat The Market [STRATEGY]", overlay=true, initial_capital=100000, default_qty_type=strategy.percent_of_equity, currency="USD", default_qty_value=100)


upperExtreme = input(title = "Upper percentile filter (Do not trade above this number)", type = input.integer, defval = 95)
lookbackPeriod = input(title = "Lookback period", type = input.integer, defval = 100)

annual = 365
per = timeframe.isintraday or timeframe.isdaily and timeframe.multiplier == 1 ? 1 : 7
hv = lookbackPeriod * stdev(log(close / close[1]), 10) * sqrt(annual / per)

filtered = hv >= percentile_nearest_rank(hv, 100, upperExtreme)

if(not(filtered))
    strategy.entry("LONG", strategy.long)
else
    strategy.close("LONG")
- Адаптационная тенденция после стратегии
- Стратегия РСИ с несколькими временными рамками
- Болинджерские полосы и комбинированная стратегия K-линии
- Стратегия торговли акциями на основе осциллятора Aroon
- EintSimple Стратегия обратного отзыва
- Поляризованная эффективность фрактала (PFE)
- Стратегия перекрестного использования одиннадцати скользящих средних
- Стратегия торговли с двойной перемещающейся средней реверсией
- РСИ стратегии обратного движения MACD
- Стратегия торговли биткойнами на основе лунной фазы
- Тенденция после стратегии прорыва канала с скользящей средней и последующей остановкой
- Стратегия количественной торговли с двумя показателями
- Двусторонняя стратегия торговли движущейся средней реверсией
- RSI Стратегия торговли бычьей и медвежьей дивергенцией
- Стратегия "серебряной пули", основанная на выходе из коробки
- Двойная EMA и индикатор AC, основанные на тенденции
- Стратегия тренда EMA на нулевое отставание волатильности
- Устойчивая стратегия отслеживания тенденций
- Стратегия спирального прорыва в движущейся средней
- Количественная стратегия торговли, основанная на индикаторе супертенденции и кривой торговли акций