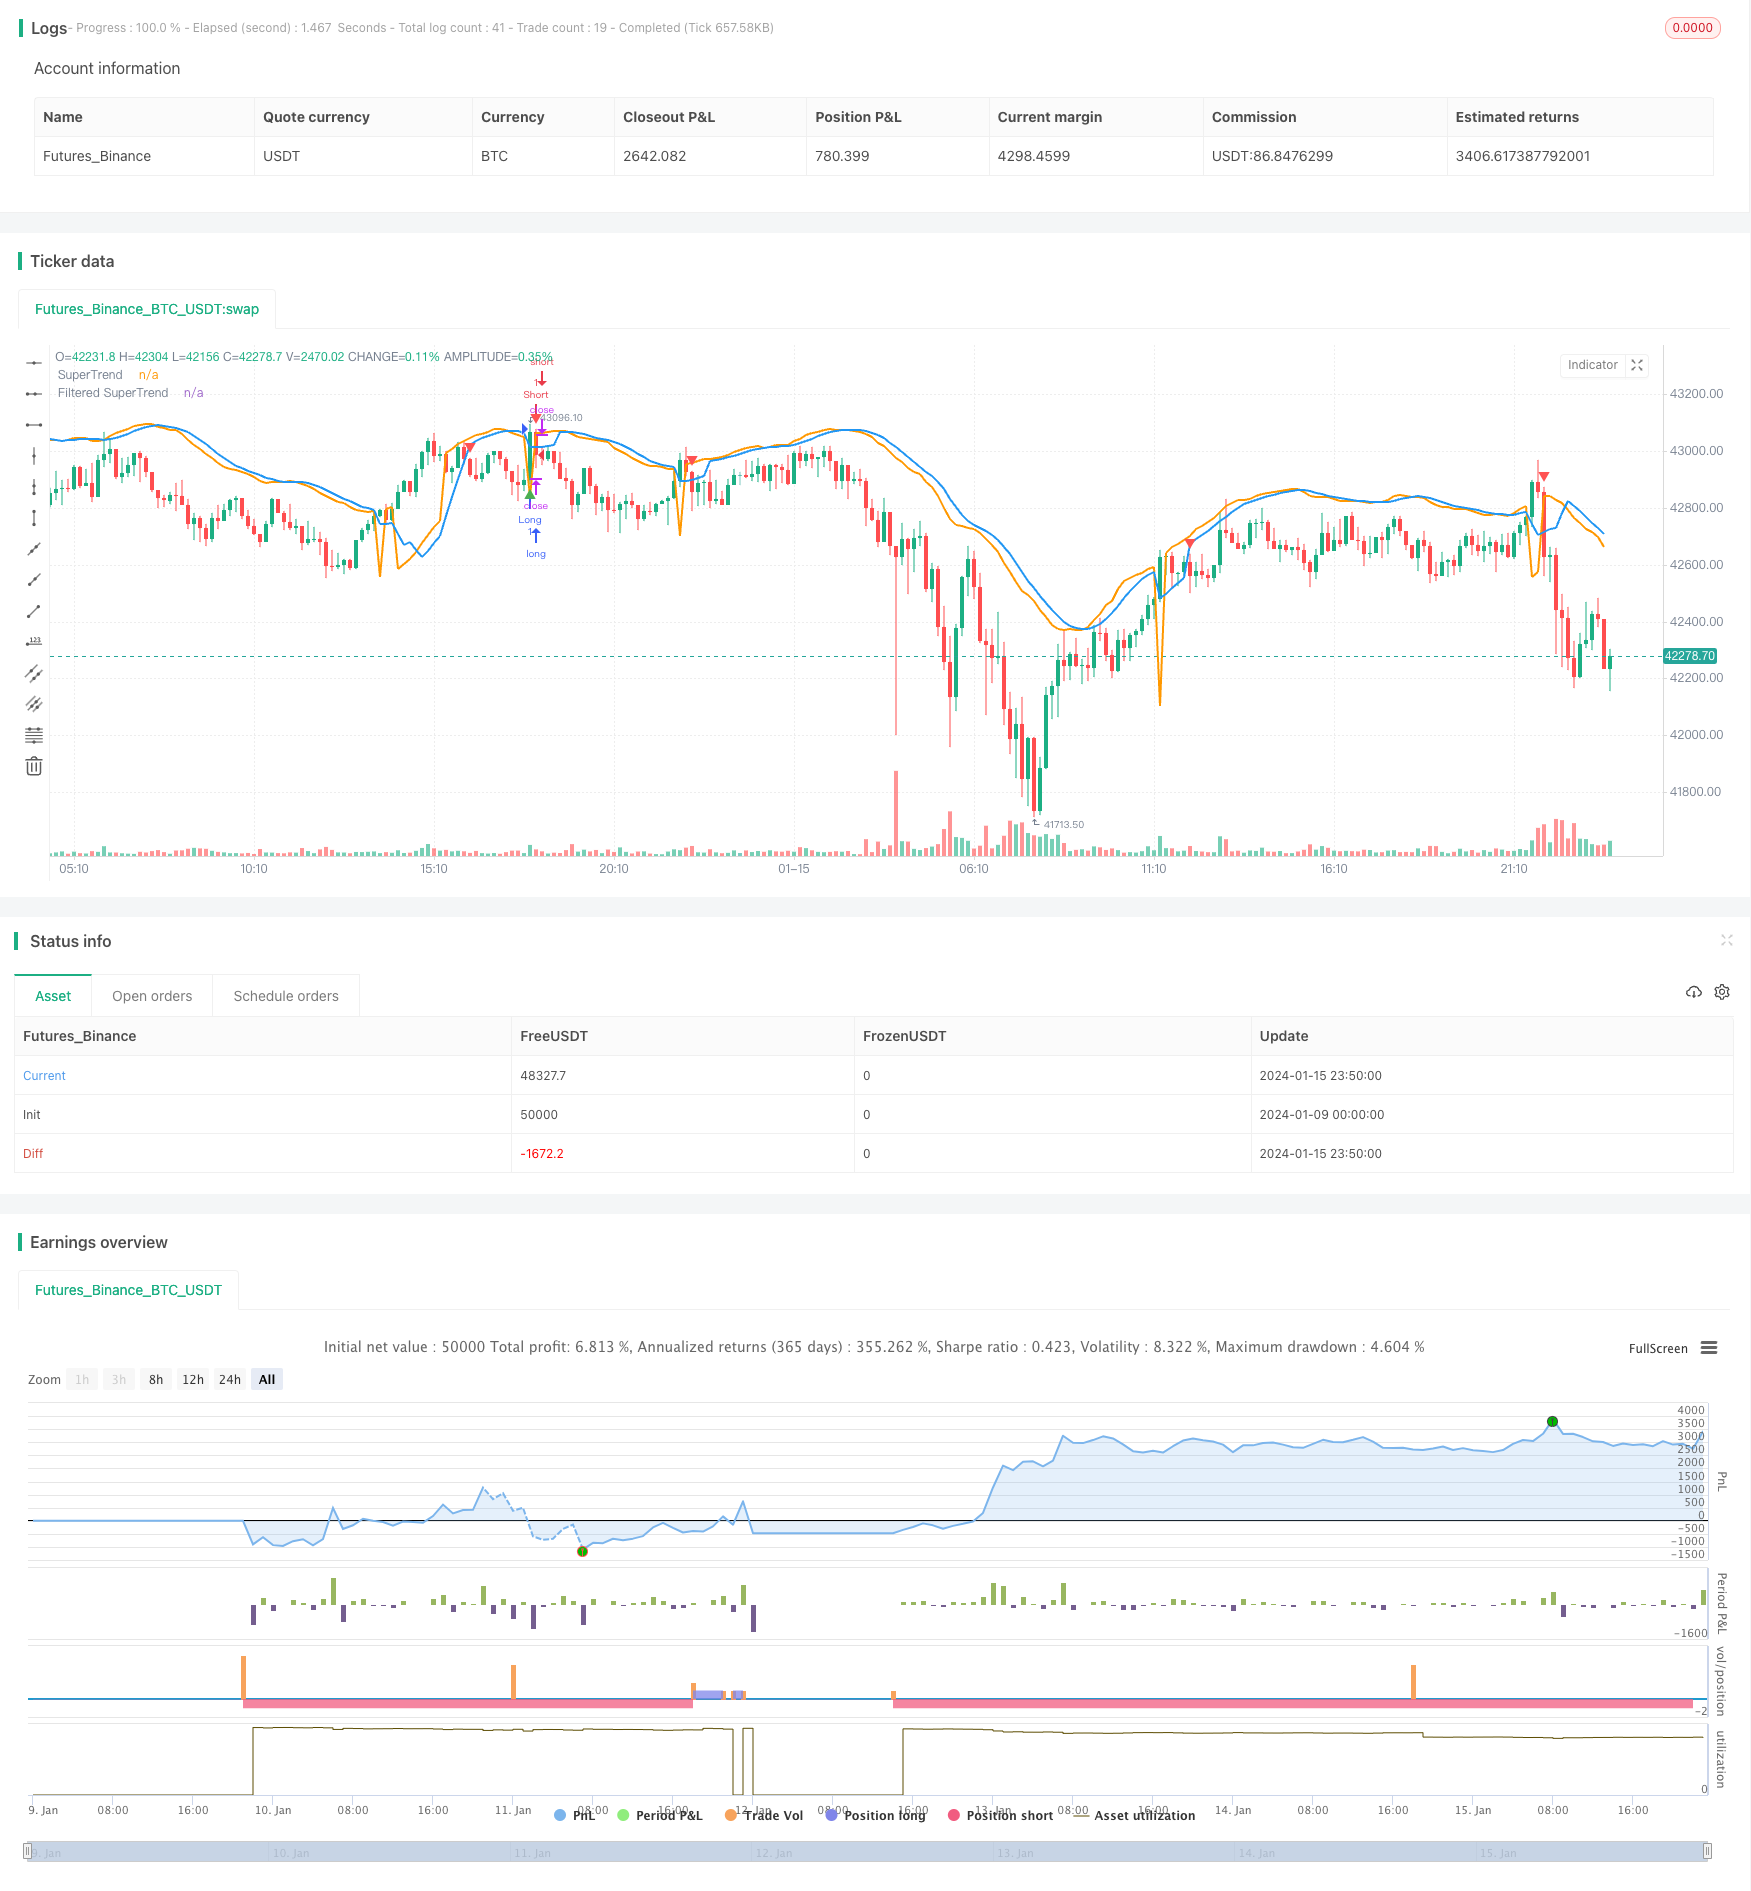
Улучшенная стратегия "СуперТренд"
Автор:Чао Чжан, Дата: 2024-01-17 15:55:15Тэги:

Обзор
В этой статье подробно анализируется стратегия следования трендам, которая сочетает в себе индикатор SuperTrend с фильтром Stochastic RSI для повышения точности.
Логика стратегии
Вычисление супертенденции
Сначала вычисляется истинный диапазон (TR) и средний истинный диапазон (ATR).
Верхняя полоса = SMA ((Close, ATR Period) + ATR Multiplier * ATR Нижняя полоса = SMA ((Close, ATR Period) - ATR Multiplier * ATR
Повышающий тренд определяется при закрытии > нижней полосы.
Во время восходящего тренда SuperTrend устанавливается на нижнюю полосу. Во время нисходящего тренда SuperTrend устанавливается на верхнюю полосу.
Механизм фильтрации
Чтобы уменьшить ложные сигналы, SuperTrend сглаживается с использованием скользящей средней для получения фильтрованного SuperTrend.
Стохастический показатель RSI
Считается значение RSI, затем на него применяется стохастический индикатор, чтобы генерировать стохастический RSI.
Условия въезда и выхода
Длинный вход: закрытие перекрестков выше фильтрованного SuperTrend при восходящем тренде и стохастическом RSI < 80 Короткий вход: закрытие перекрестков ниже фильтрованного SuperTrend в нисходящем тренде и стохастическом RSI > 20
Длинный выход: закрытие перекрестков ниже фильтрованного SuperTrend в восходящем тренде
Короткий выход: закрытие перекрестков выше фильтрованного SuperTrend в нисходящем тренде
Преимущества стратегии
Эта улучшенная стратегия следования тренду имеет следующие преимущества по сравнению с простыми скользящими средними:
- Сам SuperTrend обладает хорошей способностью определять тренды и фильтровать ложные сигналы.
- Механизм фильтрации еще больше уменьшает ложные сигналы, что приводит к более надежным сигналам.
- Стохастический RSI избегает ложных сигналов вокруг важных уровней поддержки/сопротивления во время условий перекупа/перепродажи.
- Стратегия рассматривает как направление тренда, так и условия перекупки/перепродажи, что позволяет лучше сбалансировать следование тренду и избегать ложных сигналов.
- Гибкое регулирование параметров позволяет адаптироваться к различным рыночным условиям.
Риски и оптимизация
Потенциальные риски
- Стоп-лосс может быть достигнут во время высокой волатильности.
- Проблемы с SuperTrend и фильтрацией, вызывающие отсутствие недавних изменений цен.
- Неправильные параметры RSI, влияющие на эффективность стратегии.
Управление рисками
- Соответствующее регулирование стоп-лосса или использование последующего стоп-лосса.
- Настройка параметров, таких как период ATR и период фильтрации, чтобы сбалансировать эффект отставания.
- Тестировать и оптимизировать параметры стохастического RSI.
Возможности оптимизации
- Испытайте различные комбинации параметров, чтобы найти оптимальные параметры.
- Попробуйте различные механизмы фильтрации, такие как сглаживание EMA и т.д.
- Применять машинное обучение для автоматической оптимизации параметров.
- Включить другие показатели для дополнения условий ввода.
Заключение
Эта стратегия сочетает в себе сильные стороны SuperTrend и Stochastic RSI для эффективной идентификации трендов и качественных торговых сигналов, а также делает стратегию надежной для шума рынка через фильтрационные механизмы. Дальнейшее улучшение производительности может быть достигнуто путем оптимизации параметров или сочетания с другими индикаторами / моделями. В целом эта стратегия демонстрирует хорошую способность следовать за трендом и некоторое управление рисками для тех, кто ищет стабильную прибыль.
/*backtest
start: 2024-01-09 00:00:00
end: 2024-01-16 00:00:00
period: 10m
basePeriod: 1m
exchanges: [{"eid":"Futures_Binance","currency":"BTC_USDT"}]
*/

//@version=5
strategy("Improved SuperTrend Strategy with Stochastic RSI", shorttitle="IST+StochRSI", overlay=true)

// Input parameters
atr_length = input(14, title="ATR Length")
atr_multiplier = input(1.5, title="ATR Multiplier")
filter_length = input(5, title="Filter Length")
stoch_length = input(14, title="Stochastic RSI Length")
smooth_k = input(3, title="Stochastic RSI %K Smoothing")

// Calculate True Range (TR) and Average True Range (ATR)
tr = ta.rma(ta.tr, atr_length)
atr = ta.rma(tr, atr_length)

// Calculate SuperTrend
upper_band = ta.sma(close, atr_length) + atr_multiplier * atr
lower_band = ta.sma(close, atr_length) - atr_multiplier * atr

is_uptrend = close > lower_band
is_downtrend = close < upper_band

super_trend = is_uptrend ? lower_band : na
super_trend := is_downtrend ? upper_band : super_trend

// Filter for reducing false signals
filtered_super_trend = ta.sma(super_trend, filter_length)

// Calculate Stochastic RSI
rsi_value = ta.rsi(close, stoch_length)
stoch_rsi = ta.sma(ta.stoch(rsi_value, rsi_value, rsi_value, stoch_length), smooth_k)

// Entry conditions
long_condition = ta.crossover(close, filtered_super_trend) and is_uptrend and stoch_rsi < 80
short_condition = ta.crossunder(close, filtered_super_trend) and is_downtrend and stoch_rsi > 20

// Exit conditions
exit_long_condition = ta.crossunder(close, filtered_super_trend) and is_uptrend
exit_short_condition = ta.crossover(close, filtered_super_trend) and is_downtrend

// Plot SuperTrend and filtered SuperTrend
plot(super_trend, color=color.orange, title="SuperTrend", linewidth=2)
plot(filtered_super_trend, color=color.blue, title="Filtered SuperTrend", linewidth=2)

// Plot Buy and Sell signals
plotshape(series=long_condition, title="Buy Signal", color=color.green, style=shape.triangleup, location=location.belowbar)
plotshape(series=short_condition, title="Sell Signal", color=color.red, style=shape.triangledown, location=location.abovebar)

// Output signals to the console for analysis
plotchar(long_condition, "Long Signal", "▲", location.belowbar, color=color.green, size=size.small)
plotchar(short_condition, "Short Signal", "▼", location.abovebar, color=color.red, size=size.small)

// Strategy entry and exit
strategy.entry("Long", strategy.long, when=long_condition)
strategy.entry("Short", strategy.short, when=short_condition)
strategy.close("Long", when=exit_long_condition)
strategy.close("Short", when=exit_short_condition)
- Стратегия торговли с обратной динамикой
- Стратегия индикатора PB среднего пропускания полосы
- RSI и 5-минутная стратегия торговли Фибоначчи
- Тройная скользящая средняя в сочетании с количественной стратегией MACD
- Оптимизация импульса
- Базовый перекрестный квалификатор ATR Volatility & HMA Trend Bias Mean Reversal Strategy
- Пространства волатильности и многовременная стратегия торговли фондовыми акциями
- Обратная оценка цен с использованием стратегии перекрестного захвата
- Стратегия стохастического киберцикла Элерса
- Прорыв ежедневной высоко-низкой цены на основе уровней Фибоначчи
- Количественная стратегия торговли, объединяющая MACD, RSI и RVOL
- Стратегия отслеживания инверсии импульса
- Тенденция после стратегии, основанной на перекрестном использовании EMA и SMA
- Простая алгоритмическая стратегия торговли
- Адаптивная стратегия торговли на основе индикатора ADX
- Динамическая стратегия выхода из канала
- Стратегия торговли с использованием многофильтровых полос Боллинджера
- Стратегия пересечения переменных периодов на основе истинного диапазона
- Стратегия двойного стимула SMA
- Стратегия прорыва среднего отклонения импульса