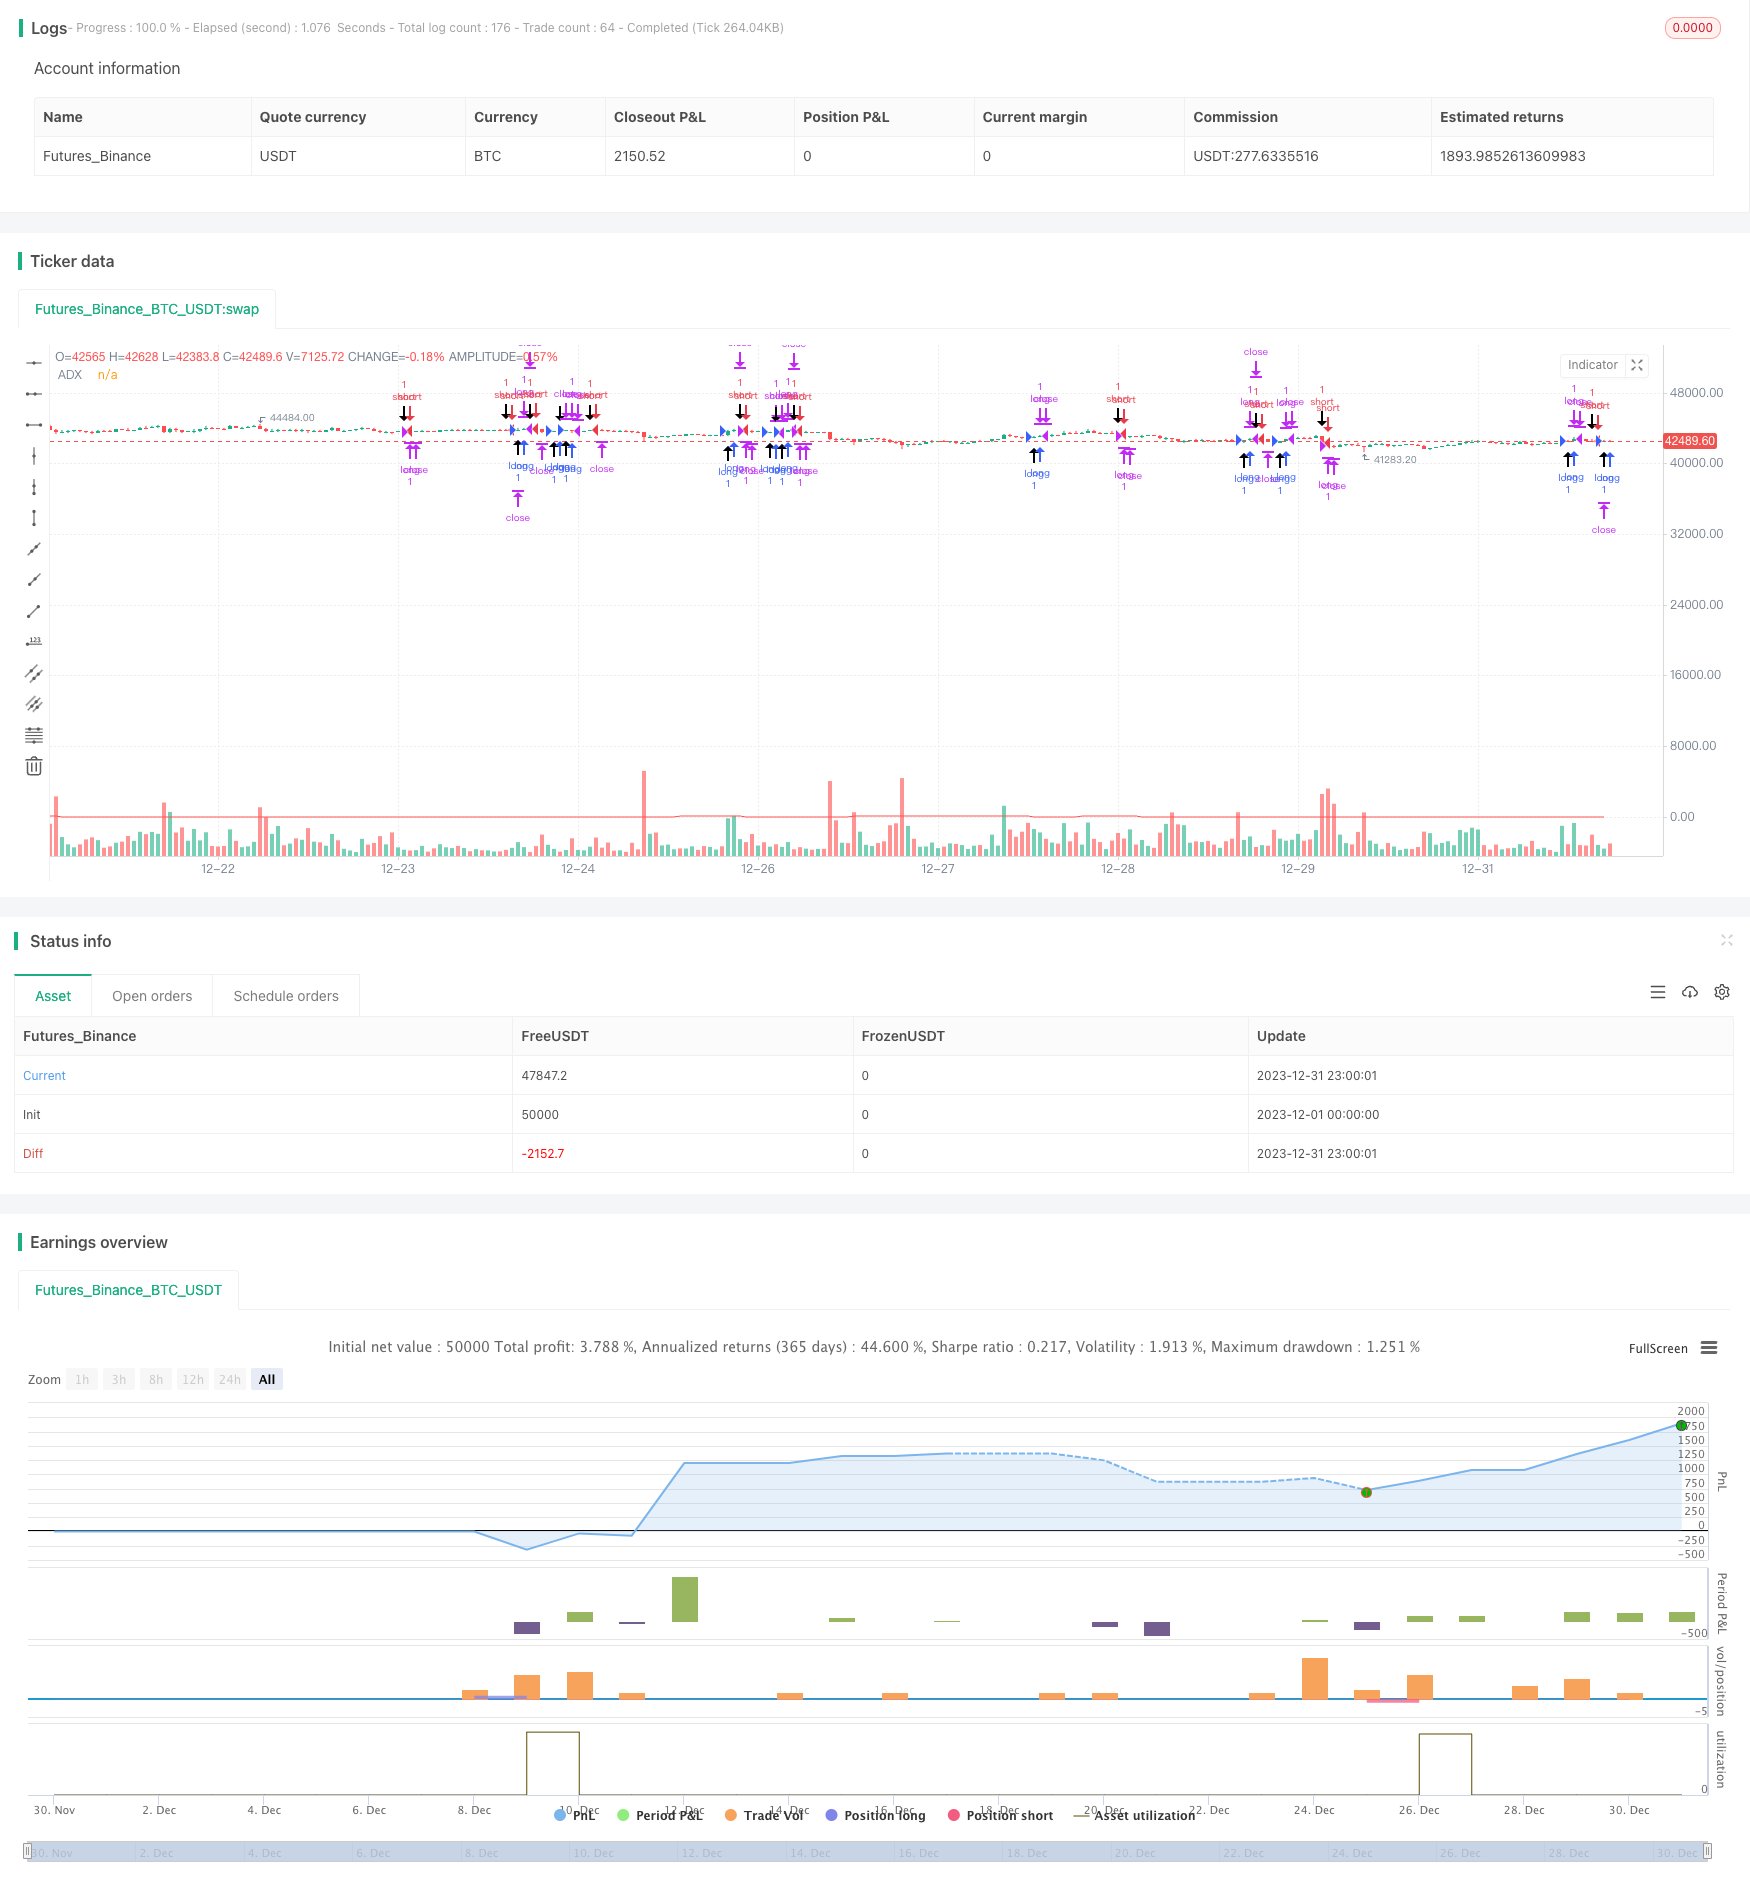
Стратегия следования тренду сырой нефти на основе индикатора ADX

Обзор
Эта стратегия основана на стратегии торговли фьючерсами на нефть, разработанной Кевином Дэви. Эта стратегия использует показатели ADX для определения тенденций на рынке нефти, в сочетании с принципом ценового прорыва, чтобы реализовать простую и практичную стратегию автоматической торговли нефтью.
Стратегический принцип
- Расчет показателя ADX на 14 циклов
- Когда ADX > 10, считать, что ситуация в тренде
- Если цена закрытия выше, чем цена закрытия до 65 K-линий, это указывает на то, что цена прорвалась, что является сигналом для длинной позиции.
- Если цена закрытия ниже, чем цена закрытия до 65 K-линий, это означает, что цена прорвалась, что является сигналом для короткой позиции
- Установка остановок и остановок после входа
Стратегия основывается на определении трендов по индикатору ADX и создании торговых сигналов в зависимости от ценовых прорывов в фиксированных циклах в условиях тренда. Вся логика стратегии очень проста и понятна.
Анализ преимуществ стратегии
- Используйте ADX, чтобы оценить тренды и не упустить возможности
- Прорыв цены в фиксированном цикле дает сигнал, лучше отслеживает эффект
- Интуитивно понятный и простой в понимании и изменении код
- Kevin Davey, многолетний экспериментальный тест, некривая совместимость
Анализ стратегических рисков
- ADX как основной показатель, чувствителен к выбору параметров и выбору прорыва
- Прорыв фиксированного цикла может пропустить часть возможностей
- Неправильное установление стоп-стоп может привести к увеличению убытков
- Вероятность расхождения эффекта от фиксированного диска и отслеживания
Направление оптимизации стратегии
- Оптимизация параметров ADX и прорывных циклов
- Динамическая корректировка увеличения объема держания
- Постоянно изменяем и совершенствуем стратегию на основе результатов обратной связи и проверки на месте
- Внедрение технологий машинного обучения и глубокого обучения для оптимизации стратегии
Подвести итог
Эта стратегия в целом является очень практичной стратегией торговли нефтью. Она использует показатель ADX, чтобы оценить тенденцию очень разумно, принцип ценового прорыва прост и эффективен. В то же время, как открытая бесплатная стратегия Кевина Дэви, она имеет сильную практическую надежность.
/*backtest
start: 2023-12-01 00:00:00
end: 2023-12-31 23:59:59
period: 1h
basePeriod: 15m
exchanges: [{"eid":"Futures_Binance","currency":"BTC_USDT"}]
*/

// Strategy idea coded from EasyLanguage to Pinescript
//@version=5
strategy("Kevin Davey Crude free crude oil strategy", shorttitle="CO Fut", format=format.price, precision=2, overlay = true, calc_on_every_tick = true)
adxlen = input(14, title="ADX Smoothing")
dilen = input(14, title="DI Length")
dirmov(len) =>
	up = ta.change(high)
	down = -ta.change(low)
	plusDM = na(up) ? na : (up > down and up > 0 ? up : 0)
	minusDM = na(down) ? na : (down > up and down > 0 ? down : 0)
	truerange = ta.rma(ta.tr, len)
	plus = fixnan(100 * ta.rma(plusDM, len) / truerange)
	minus = fixnan(100 * ta.rma(minusDM, len) / truerange)
	[plus, minus]
adx(dilen, adxlen) =>
	[plus, minus] = dirmov(dilen)
	sum = plus + minus
	adx = 100 * ta.rma(math.abs(plus - minus) / (sum == 0 ? 1 : sum), adxlen)
sig = adx(dilen, adxlen)
plot(sig, color=color.red, title="ADX")

buy = sig > 10 and (close - close[65]) > 0 and (close - close[65])[1] < 0
sell = sig > 10 and (close - close[65]) < 0 and (close - close[65])[1] > 0

plotshape(buy, style = shape.arrowup, location = location.belowbar,size = size.huge)
plotshape(sell, style = shape.arrowdown, location = location.abovebar,size = size.huge)

if buy
	strategy.entry("long", strategy.long)
if sell
	strategy.entry("short", strategy.short)

if strategy.position_size != 0
	strategy.exit("long", profit = 450, loss = 300)
	strategy.exit("short", profit = 450, loss = 300)


// GetTickValue() returns the currency value of the instrument's
// smallest possible price movement.
GetTickValue() =>
    syminfo.mintick * syminfo.pointvalue

// On the last historical bar, make a label to display the
// instrument's tick value
if barstate.islastconfirmedhistory
    label.new(x=bar_index + 1, y=close, style=label.style_label_left,
         color=color.black, textcolor=color.white, size=size.large,
         text=syminfo.ticker + " has a tick value of:\n" +
             syminfo.currency + " " + str.tostring(GetTickValue()))