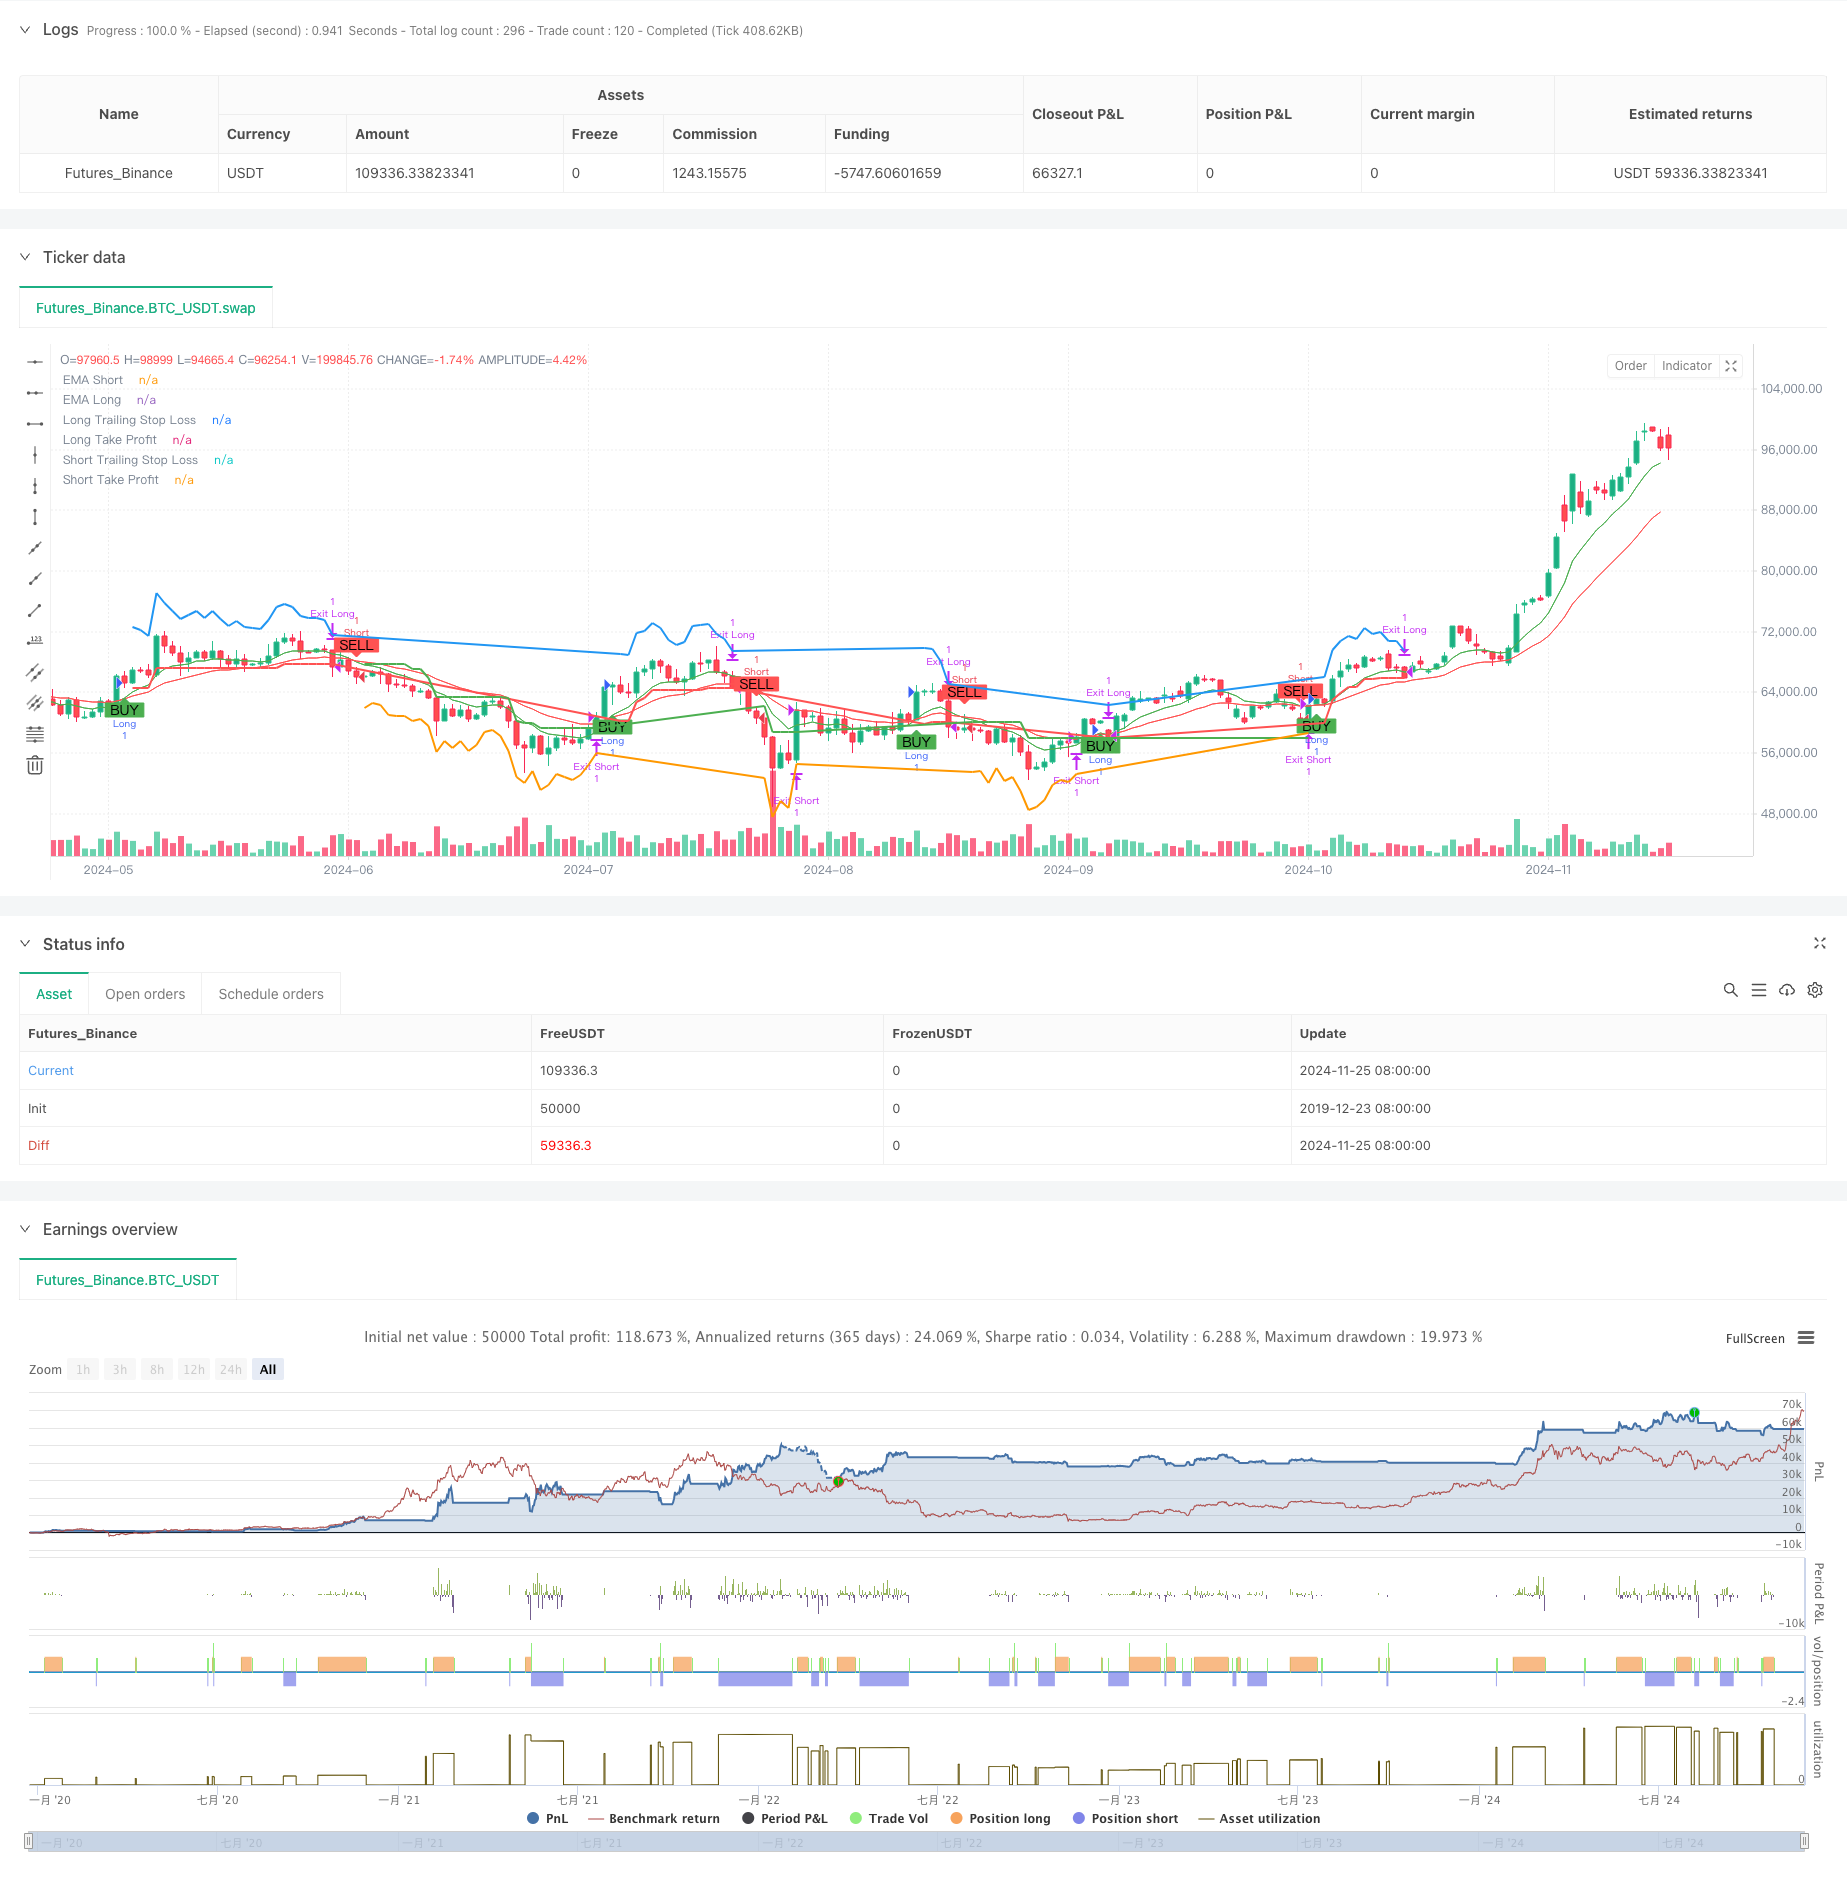
Обзор
Это стратегия отслеживания тенденций, которая сочетает в себе многоциклический анализ и управление волатильностью. В основе стратегии лежит решение о направлении тренда с использованием бинарного пересечения, фильтрация перепродажи через RSI, подтверждение общей тенденции с помощью более высоких временных циклов EMA, а также динамическое управление остановками и прибыльными целями с использованием ATR.
Стратегический принцип
Основная логика торговли в стратегии состоит из следующих ключевых частей:
- Идентификация тренда: использование пересечения коротких и длительных ЭМА для идентификации изменений в тренде, при котором при потере долгосрочной ЭМА появляются сигналы плюс-макс, а при потере долгосрочной ЭМА появляются сигналы пустоты.
- Подтверждение тренда: введение более высоких временных циклов EMA в качестве фильтра тренда, позволяющего сделать больше только тогда, когда цена находится выше высоких циклических EMA, и наоборот, позволяет сделать пустое.
- Волатильность фильтрации: использование RSI для решения о перепродаже, чтобы предотвратить вход в случае чрезмерного преследования.
- Управление позициями: динамическая установка ATR-устанавливающих стоп- и торгово-прибыльных целей, автоматическая корректировка стоп-позиций с изменением цены, защита как прибыльной, так и невыгодной.
- Многомерная защита: стратегия построения целостной системы принятия решений о сделках с помощью комплексного использования нескольких технических показателей.
Стратегические преимущества
- Высокая надежность сигналов: значительно повышена надежность торговых сигналов благодаря совместному использованию нескольких технических показателей.
- Управление рисками: используется динамическая система остановок, основанная на ATR, которая может адаптироваться к остановке в зависимости от волатильности рынка
- Точная оценка тенденций: использование методов многоциклического анализа повышает точность оценки основных тенденций.
- Гибкость целевой прибыли: настройка take-profit также основана на динамической корректировке ATR, что гарантирует прибыль, но не позволяет преждевременно покинуть поле.
- Адаптируемость: стратегические параметры могут быть адаптированы к различным рыночным условиям.
Стратегический риск
- Риск рыночных потрясений: частота торговли может привести к убыткам в условиях боковых колебаний.
- Риск скольжения: в периоды сильных колебаний реальная цена сделки может отличаться от теоретической.
- Риск ложного прорыва: возможно возврат после кратковременного прорыва, что приводит к остановке проигрыша.
- Чувствительность параметров: различные комбинации параметров оказывают большое влияние на эффективность стратегии и требуют тщательного тестирования.
Направление оптимизации стратегии
- Идентификация рыночной обстановки: можно добавить индикатор интенсивности тренда, автоматически снизить позиции или приостановить торговлю на колеблющемся рынке.
- Оптимизация времени входа: может быть использована в сочетании с трафиковыми показателями для повышения надежности входного сигнала.
- Динамическая параметровая настройка: можно автоматически настраивать циклы EMA и кратность ATR в зависимости от рыночных колебаний.
- Схема строительства складов в партиях: можно разработать механизм строительства и уменьшения складов в партиях, чтобы снизить риск единого ценового пункта.
- Оптимизация управления позициями: можно корректировать размер позиций в зависимости от риска счета и динамики волатильности рынка.
Подвести итог
Это хорошо разработанная стратегия отслеживания тенденций, которая реализует лучшие рисково-прибыльные характеристики с помощью многоциклического анализа и управления волатильностью. Основное преимущество стратегии заключается в органическом сочетании нескольких технических показателей, которые гарантируют надежность торговли и эффективное управление рисками. Хотя существуют некоторые потенциальные риски, все же есть место для улучшения общей эффективности стратегии с помощью постоянной оптимизации и совершенствования.
/*backtest
start: 2019-12-23 08:00:00
end: 2024-11-26 00:00:00
period: 1d
basePeriod: 1d
exchanges: [{"eid":"Futures_Binance","currency":"BTC_USDT"}]
*/

//@version=5
strategy("Trend Following with ATR and MTF Confirmation", overlay=true)

// Parameters
emaShortPeriod = input.int(9, title="Short EMA Period", minval=1)
emaLongPeriod = input.int(21, title="Long EMA Period", minval=1)
rsiPeriod = input.int(14, title="RSI Period", minval=1)
rsiOverbought = input.int(70, title="RSI Overbought", minval=50)
rsiOversold = input.int(30, title="RSI Oversold", minval=1)
atrPeriod = input.int(14, title="ATR Period", minval=1)
atrMultiplier = input.float(1.5, title="ATR Multiplier", minval=0.1)
takeProfitATRMultiplier = input.float(2.0, title="Take Profit ATR Multiplier", minval=0.1)

// Multi-timeframe settings
htfEMAEnabled = input.bool(true, title="Use Higher Timeframe EMA Confirmation?", inline="htf")
htfEMATimeframe = input.timeframe("D", title="Higher Timeframe", inline="htf")

// Select trade direction
tradeDirection = input.string("Both", title="Trade Direction", options=["Both", "Long", "Short"])

// Calculating indicators
emaShort = ta.ema(close, emaShortPeriod)
emaLong = ta.ema(close, emaLongPeriod)
rsiValue = ta.rsi(close, rsiPeriod)
atrValue = ta.atr(atrPeriod)

// Higher timeframe EMA confirmation
htfEMALong = request.security(syminfo.tickerid, htfEMATimeframe, ta.ema(close, emaLongPeriod))

// Trading conditions
longCondition = ta.crossover(emaShort, emaLong) and rsiValue < rsiOverbought and (not htfEMAEnabled or close > htfEMALong)
shortCondition = ta.crossunder(emaShort, emaLong) and rsiValue > rsiOversold and (not htfEMAEnabled or close < htfEMALong)

// Plotting EMAs
plot(emaShort, title="EMA Short", color=color.green)
plot(emaLong, title="EMA Long", color=color.red)

// Trailing Stop-Loss and Take-Profit levels
var float trailStopLoss = na
var float trailTakeProfit = na

// Exit conditions
var bool exitLongCondition = na
var bool exitShortCondition = na

if (strategy.position_size != 0)
    if (strategy.position_size > 0) // Long Position
        trailStopLoss := na(trailStopLoss) ? close - atrValue * atrMultiplier : math.max(trailStopLoss, close - atrValue * atrMultiplier)
        trailTakeProfit := close + atrValue * takeProfitATRMultiplier
        exitLongCondition := close <= trailStopLoss or close >= trailTakeProfit
        strategy.exit("Exit Long", "Long", stop=trailStopLoss, limit=trailTakeProfit, when=exitLongCondition)
    else // Short Position
        trailStopLoss := na(trailStopLoss) ? close + atrValue * atrMultiplier : math.min(trailStopLoss, close + atrValue * atrMultiplier)
        trailTakeProfit := close - atrValue * takeProfitATRMultiplier
        exitShortCondition := close >= trailStopLoss or close <= trailTakeProfit
        strategy.exit("Exit Short", "Short", stop=trailStopLoss, limit=trailTakeProfit, when=exitShortCondition)

// Strategy Entry
if (longCondition and (tradeDirection == "Both" or tradeDirection == "Long"))
    strategy.entry("Long", strategy.long)

if (shortCondition and (tradeDirection == "Both" or tradeDirection == "Short"))
    strategy.entry("Short", strategy.short)

// Plotting Buy/Sell signals
plotshape(series=longCondition, title="Buy Signal", location=location.belowbar, color=color.green, style=shape.labelup, text="BUY")
plotshape(series=shortCondition, title="Sell Signal", location=location.abovebar, color=color.red, style=shape.labeldown, text="SELL")

// Plotting Trailing Stop-Loss and Take-Profit levels
plot(strategy.position_size > 0 ? trailStopLoss : na, title="Long Trailing Stop Loss", color=color.red, linewidth=2, style=plot.style_line)
plot(strategy.position_size < 0 ? trailStopLoss : na, title="Short Trailing Stop Loss", color=color.green, linewidth=2, style=plot.style_line)
plot(strategy.position_size > 0 ? trailTakeProfit : na, title="Long Take Profit", color=color.blue, linewidth=2, style=plot.style_line)
plot(strategy.position_size < 0 ? trailTakeProfit : na, title="Short Take Profit", color=color.orange, linewidth=2, style=plot.style_line)

// Alerts
alertcondition(longCondition, title="Buy Alert", message="Buy Signal Triggered")
alertcondition(shortCondition, title="Sell Alert", message="Sell Signal Triggered")
alertcondition(exitLongCondition, title="Long Exit Alert", message="Long Position Closed")
alertcondition(exitShortCondition, title="Short Exit Alert", message="Short Position Closed")