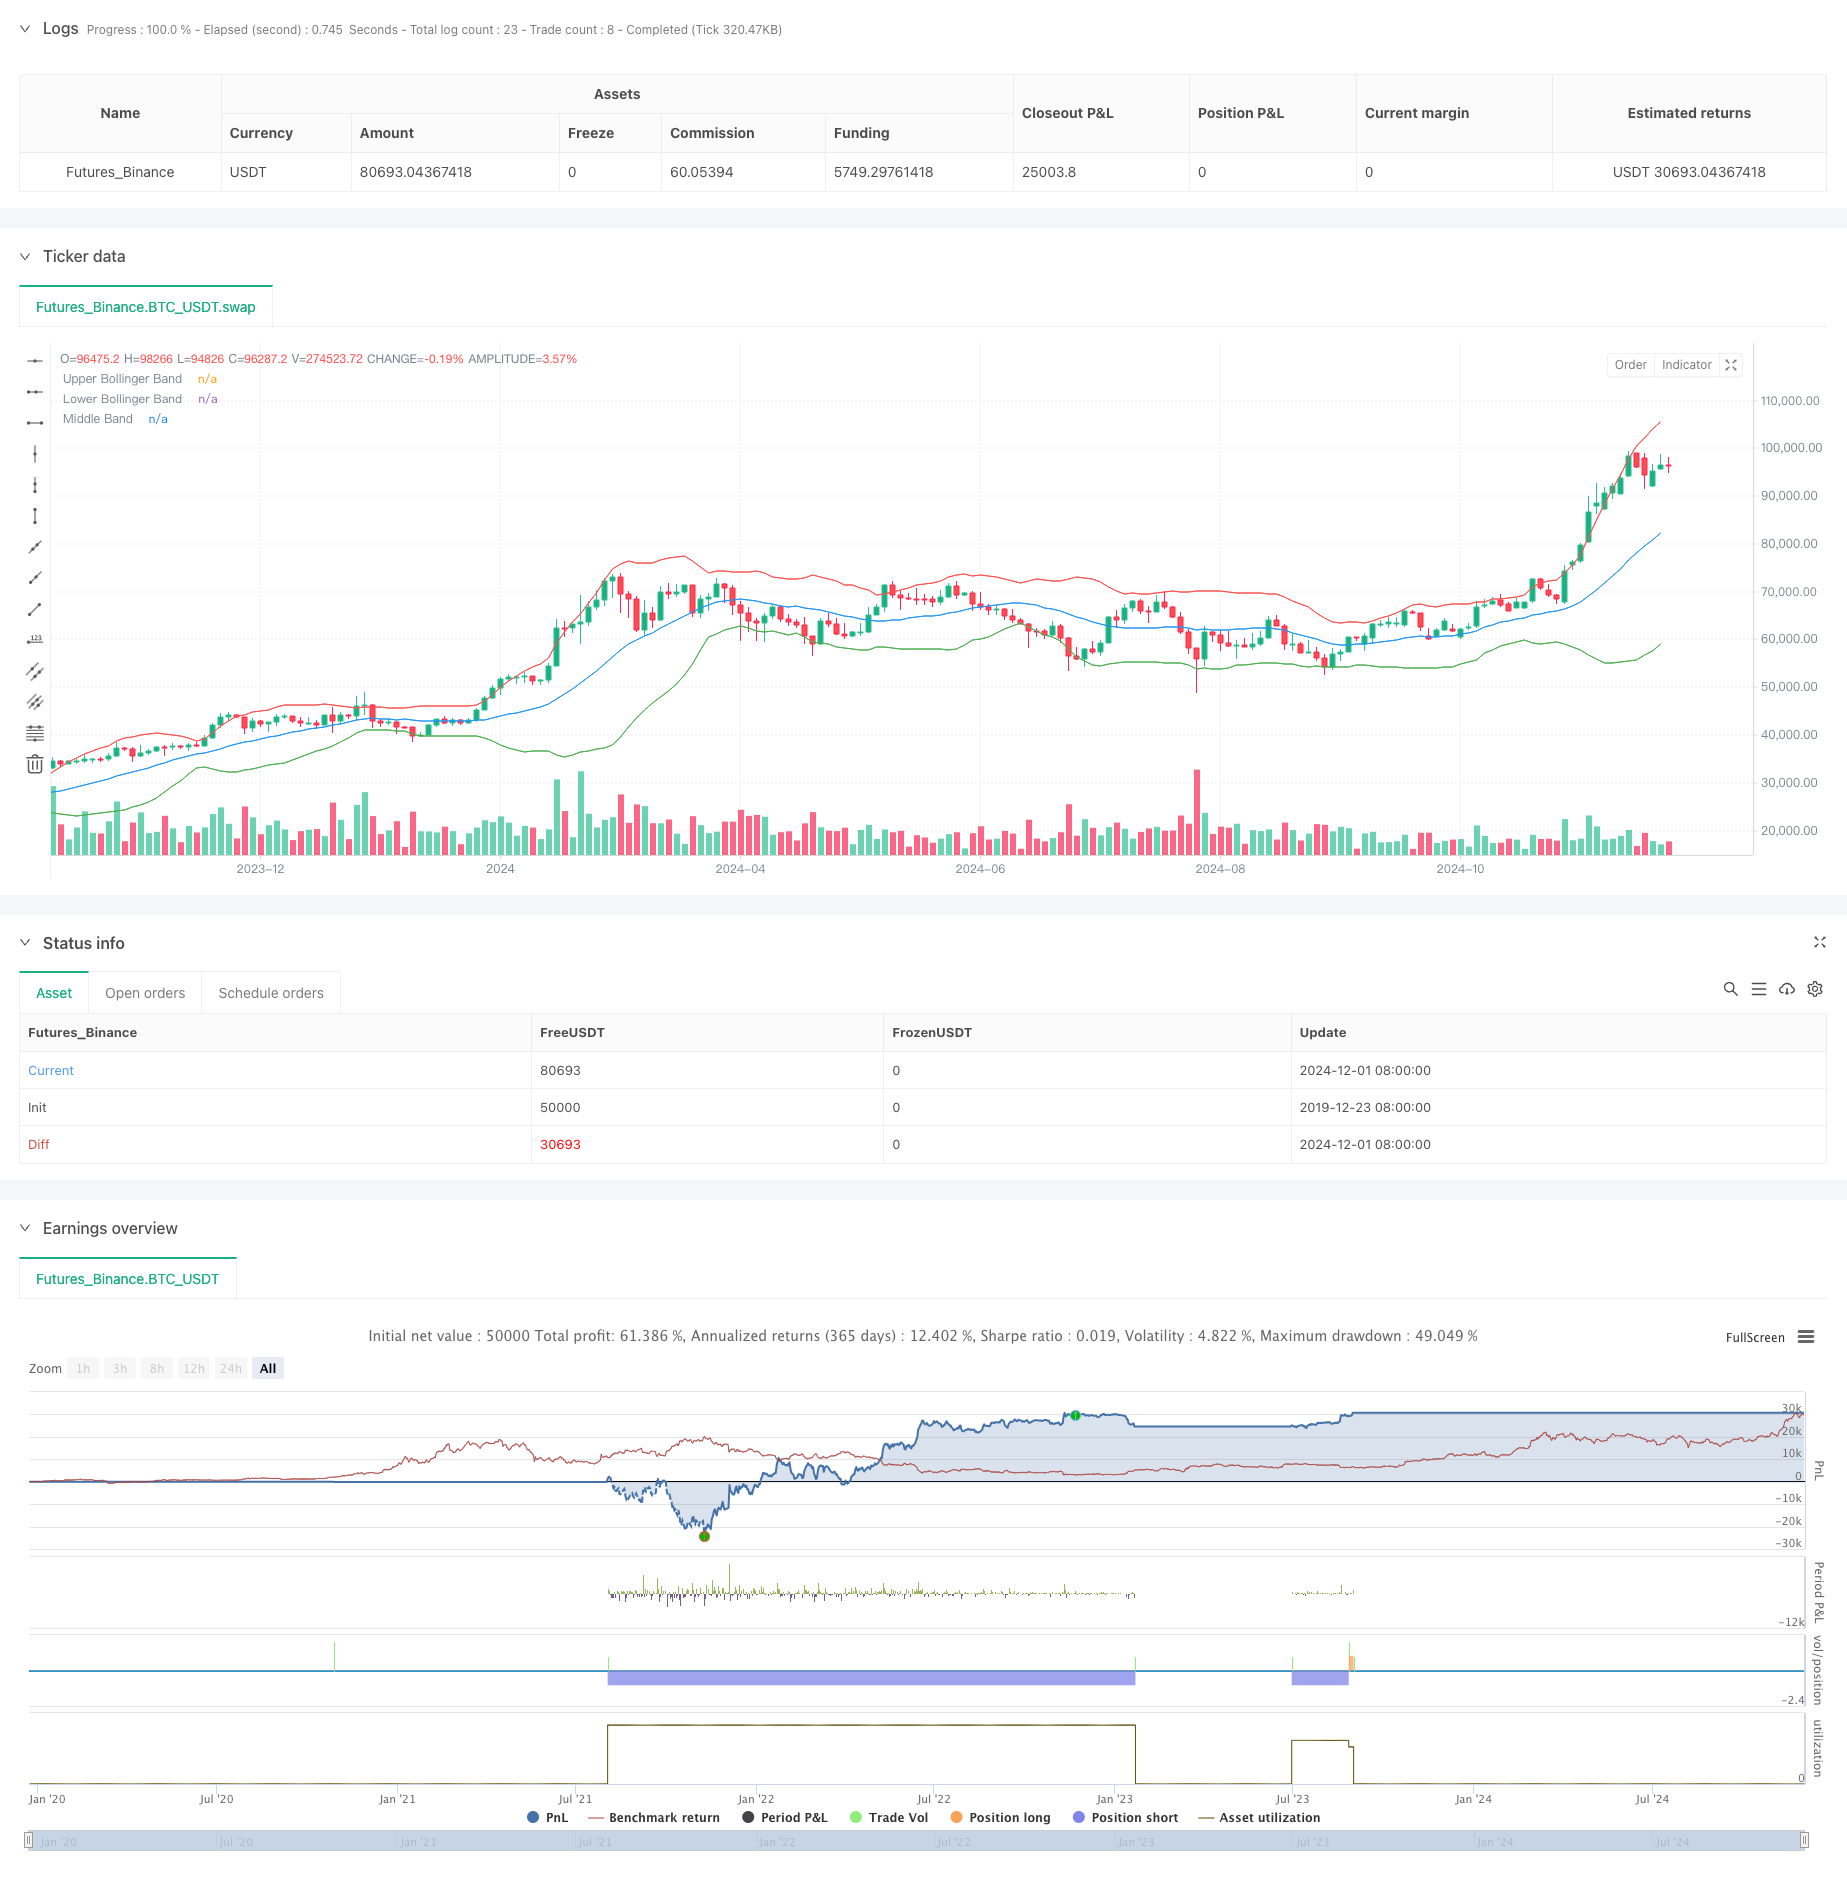
Обзор
Стратегия представляет собой высокочастотную торговую систему, объединяющую индикатор пояса бурин с ценовым прорывом. Стратегия отслеживает связь между ценой и положением пояса бурин в сочетании с предварительными сигналами прорыва высоких и низких точек, чтобы совершать обратную торговлю при перепродаже на рынке. Система использует риск-прибыль в размере 1:1, устанавливает стоп-стоп и визуально отображает ключевые цены, чтобы помочь трейдерам визуально понять движение рынка.
Стратегический принцип
Основная логика стратегии основана на двух основных критериях: когда цена пробивает предыдущую высокую точку и предыдущая высокая точка находится ниже полей буринской полосы, вызывается многосигнал; когда цена падает до предыдущей низкой точки и предыдущая низкая точка находится выше полей буринской полосы, вызывается сигнал пустоты. Параметры буринской полосы используют 20-циклическую скользящую среднюю с двойной стандартной разницей для определения диапазона колебаний рынка и системы сверхпокупа и сверхпродажи. После вызывания торгового сигнала, автоматически устанавливаются соответствующие стоп-стопы и целевые точки и визуализируются с помощью различных линий стиля.
Стратегические преимущества
- Сочетание двух типов трейдинга - прорыв тренда и возвращение к средней стоимости позволяет сохранять стабильность в различных рыночных условиях.
- Управление позициями с фиксированным соотношением риска и прибыли способствует долгосрочной стабильной прибыли
- Повышение оперативности стратегии с помощью визуализации входа, остановки и целевых позиций
- Использование индикатора Брин-Бенда помогает идентифицировать состояние перепродажи на рынке, повышая точность торгов
- Стратегическая логика проста, понятна и легко применяется
Стратегический риск
- Высокочастотные сделки могут иметь более высокие транзакционные издержки, необходимо учитывать влияние комиссий
- Частые ложные прорывы могут возникать в условиях поперечного колебания рынка
- Фиксированный риск-прибыль может быть недостаточно хорошим для понимания основных тенденций.
- Привязка к параметрам по ленте Брин может не подходить для всех рыночных условий
- Необходимость мониторинга рынка в режиме реального времени для обеспечения своевременного исполнения сигналов
Направление оптимизации стратегии
- Введение показателей загрузки в качестве подтверждения сигнала, повышение надежности прорыва
- Параметры Бринских полос, динамически корректируемые в зависимости от рыночных колебаний
- Добавление фильтров трендов, чтобы избежать частых сделок на горизонтальном рынке
- Подумайте о добавлении временных фильтров, чтобы избежать торговли в неактивные часы
- Разработка адаптивных механизмов определения риска и прибыли
Подвести итог
Это целостная торговая система, интегрирующая несколько концепций технического анализа. Благодаря тому, что индикаторы бурин-пояса сочетаются с ценовыми прорывами, стратегия может захватить возможности для обратного обмена в зонах перепродажи на рынке. Хотя есть определенное пространство для оптимизации, основополагающая структура системы имеет хорошую масштабируемость и практическую ценность.
/*backtest
start: 2019-12-23 08:00:00
end: 2024-12-03 00:00:00
period: 2d
basePeriod: 2d
exchanges: [{"eid":"Futures_Binance","currency":"BTC_USDT"}]
*/

//@version=5
strategy("Bollinger Band Scalping", overlay=true)

// Input for Bollinger Bands length and standard deviation
bbLength = input(20, title="Bollinger Bands Length")
stdDev = input(2.0, title="Bollinger Bands Std Dev")

// Calculate and plot the Bollinger Bands
basis = ta.sma(close, bbLength)
deviation = stdDev * ta.stdev(close, bbLength)
upperBB = basis + deviation
lowerBB = basis - deviation

// Get previous candle's values
prevHigh = high[1]   // Previous candle high
prevLow = low[1]     // Previous candle low

// Buy Signal Condition: Current high crossed above previous high and previous high is below the lower Bollinger Band
buyCondition = ta.crossover(high, prevHigh) and (prevHigh < lowerBB[1])

// Sell Signal Condition: Current low crossed below previous low and previous low is above the upper Bollinger Band
sellCondition = ta.crossunder(low, prevLow) and (prevLow > upperBB[1])

// Entry and exit for Buy signals
if (buyCondition)
    strategy.entry("Buy", strategy.long)
    // Calculate target and stop loss
    stopLossPrice = prevLow
    targetPrice = prevHigh + (prevHigh - stopLossPrice)  // 1:1 RR target

    // Set stop loss and target orders
    strategy.exit("Sell", "Buy", limit=targetPrice, stop=stopLossPrice)

    // // Plot entry line
    // line.new(x1=bar_index, y1=prevHigh, x2=bar_index + 12, y2=prevHigh, color=color.green, width=2, style=line.style_solid)
    // // Plot stop loss line
    // line.new(x1=bar_index, y1=stopLossPrice, x2=bar_index + 12, y2=stopLossPrice, color=color.red, width=1, style=line.style_dashed)
    // // Plot target line
    // line.new(x1=bar_index, y1=targetPrice, x2=bar_index + 12, y2=targetPrice, color=color.blue, width=2, style=line.style_solid)

// Entry and exit for Sell signals
if (sellCondition)
    strategy.entry("Sell", strategy.short)
    // Calculate target and stop loss
    stopLossPriceSell = prevHigh
    targetPriceSell = prevLow - (stopLossPriceSell - prevLow)  // 1:1 RR target

    // Set stop loss and target orders
    strategy.exit("Cover", "Sell", limit=targetPriceSell, stop=stopLossPriceSell)

    // // Plot entry line
    // line.new(x1=bar_index, y1=prevLow, x2=bar_index + 12, y2=prevLow, color=color.red, width=2, style=line.style_solid)
    // // Plot stop loss line
    // line.new(x1=bar_index, y1=stopLossPriceSell, x2=bar_index + 12, y2=stopLossPriceSell, color=color.green, width=1, style=line.style_dashed)
    // // Plot target line
    // line.new(x1=bar_index, y1=targetPriceSell, x2=bar_index + 12, y2=targetPriceSell, color=color.blue, width=2, style=line.style_solid)

// Plotting Bollinger Bands with 70% transparency
plot(upperBB, color=color.red, title="Upper Bollinger Band", transp=70)
plot(lowerBB, color=color.green, title="Lower Bollinger Band", transp=70)
plot(basis, color=color.blue, title="Middle Band", transp=70)