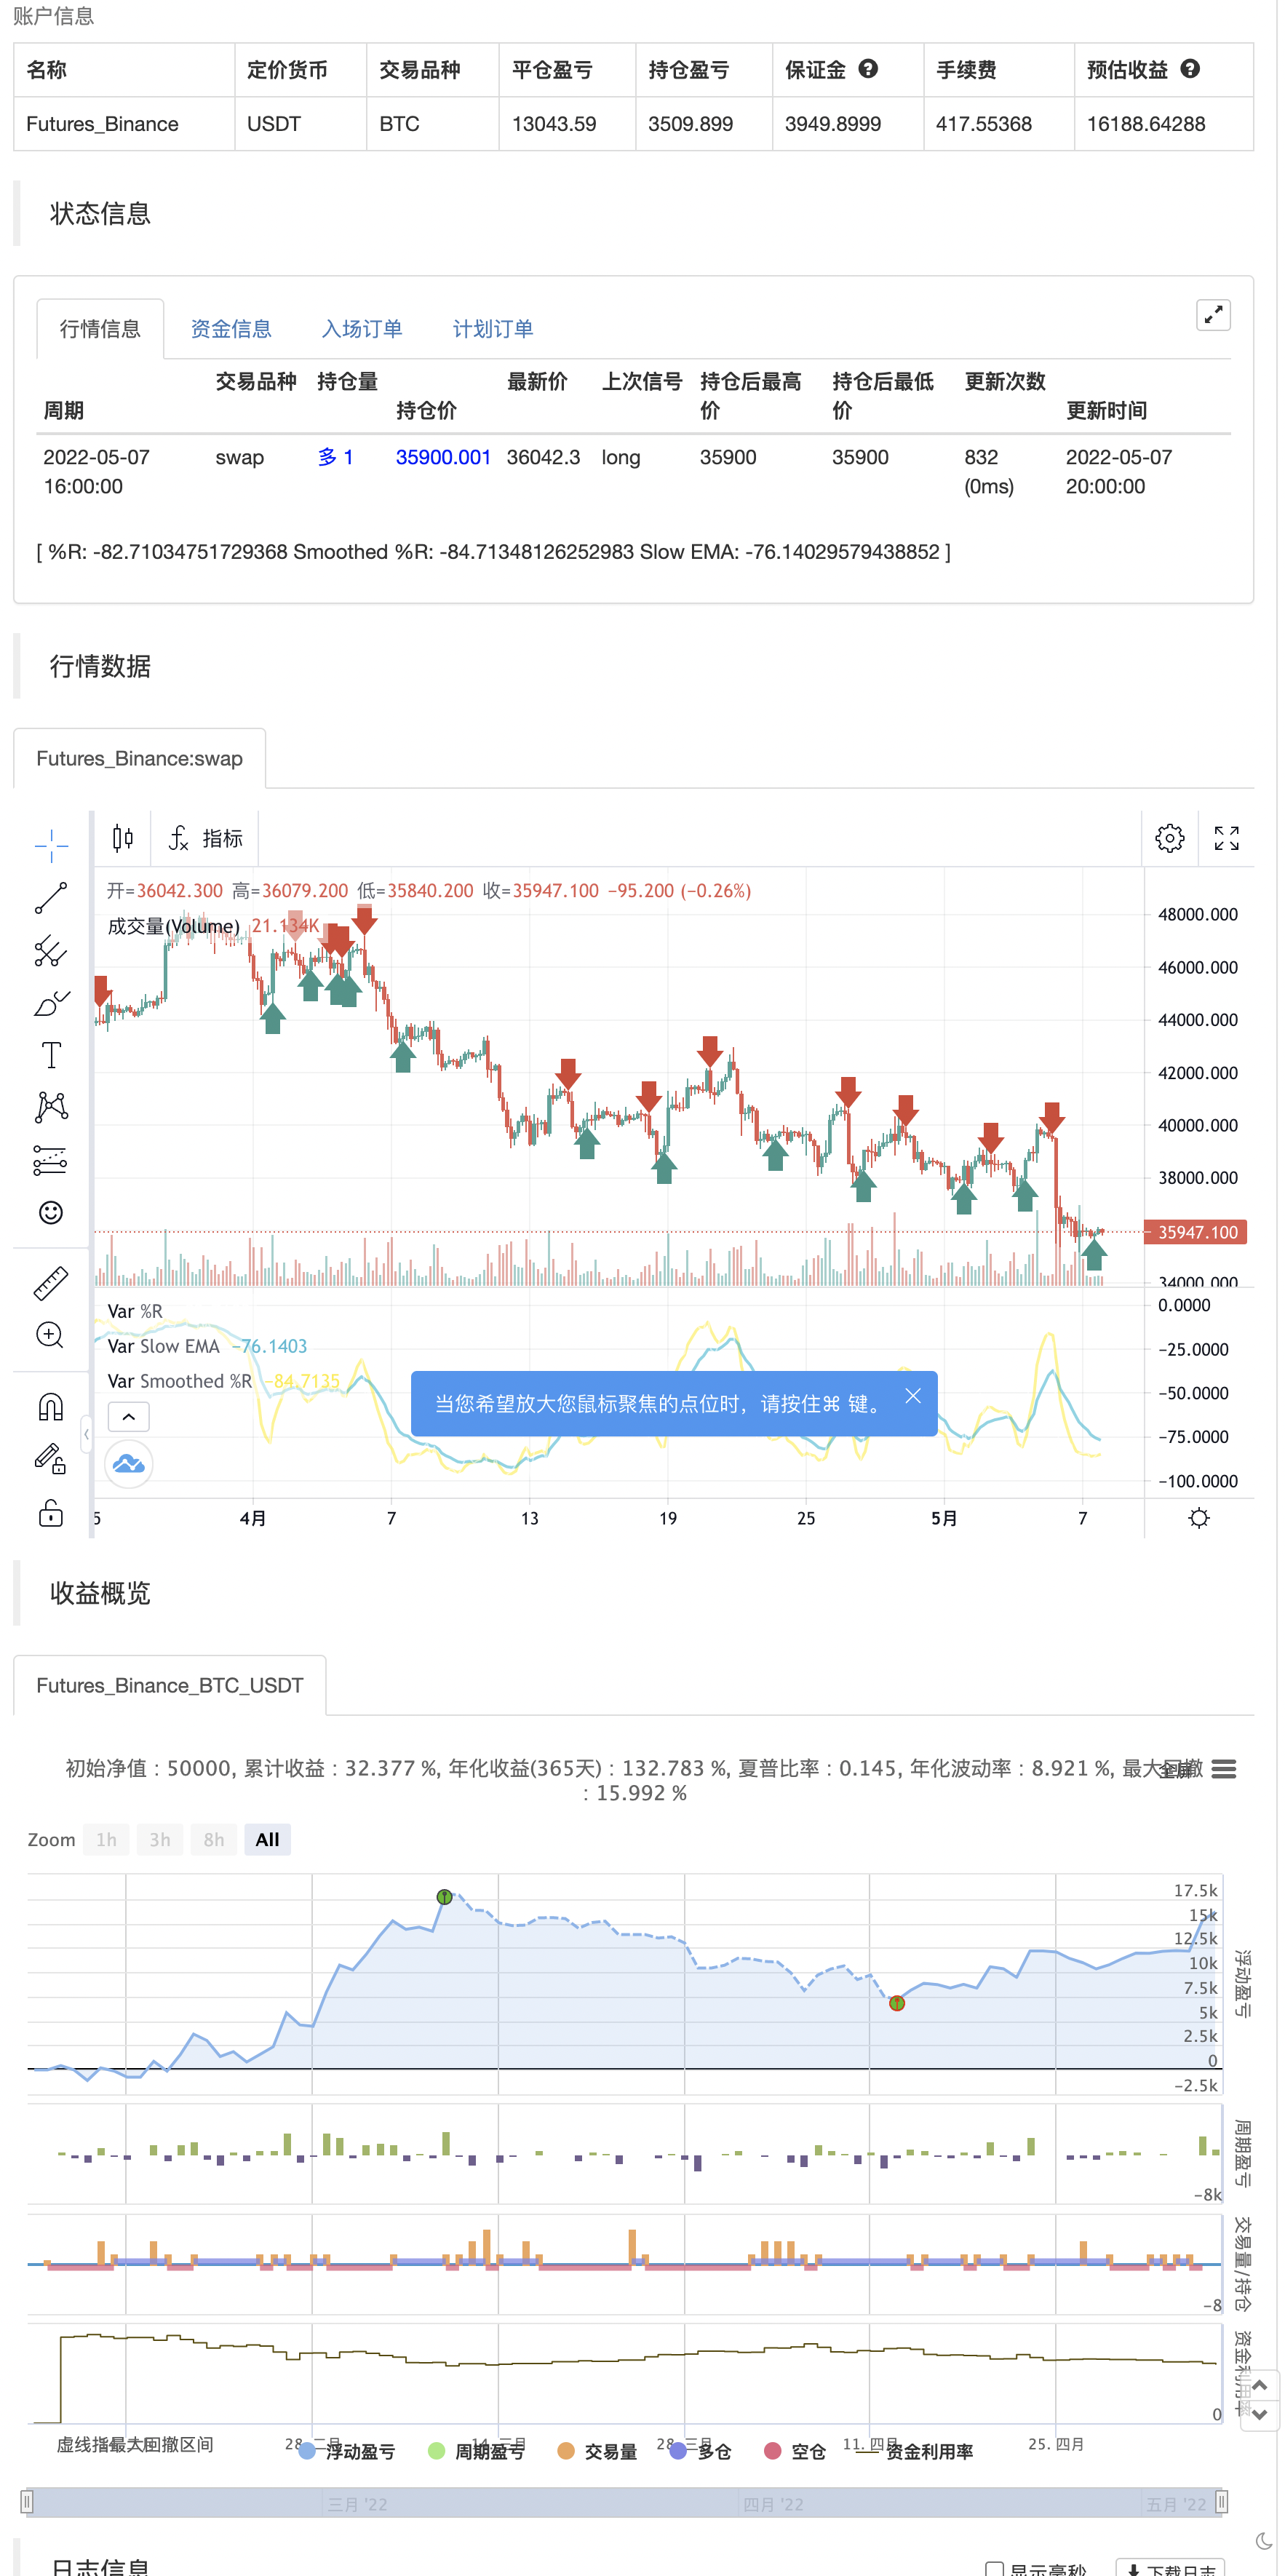
ولیمز %R - ہموار
مصنف:چاؤ ژانگ، تاریخ: 2022-05-09 12:04:48ٹیگز:ڈبلیو ایم اےای ایم اے
ٹریڈنگ ویو کی وضاحت سے: ولیمز٪ آر (٪ آر) ایک رفتار پر مبنی اوسیلیٹر ہے جو تکنیکی تجزیہ میں استعمال ہوتا ہے ، بنیادی طور پر زیادہ سے زیادہ خریدنے اور زیادہ فروخت ہونے والی حالتوں کی نشاندہی کرنے کے لئے۔ % آر صارف کی وضاحت کردہ بیک بیک مدت کے لئے موجودہ بند اور اعلی ترین اعلی کے درمیان موازنہ پر مبنی ہے۔ % آر 0 اور -100 کے درمیان دوڑتا ہے (منفی اقدار کو نوٹ کریں) صفر کے قریب پڑھنے سے زیادہ زیادہ خریدنے کی حالتوں اور -100 کے قریب پڑھنے سے زیادہ فروخت کی نشاندہی ہوتی ہے۔ عام طور پر٪ آر زیادہ سے زیادہ خریدنے اور زیادہ فروخت کی حالتوں کے ساتھ ساتھ رفتار میں مجموعی تبدیلیوں کی بنیاد پر سیٹ اپ تیار کرسکتا ہے۔
کیا خاص ہے؟ یہ اشارے اصل ولیمز٪ آر اشارے میں دو اضافی ای ایم اے لائنیں شامل کرتا ہے۔ ڈیفالٹ ای ایم اے کی لمبائی 5 اور 13 ہے۔ نتیجہ 2 ہموار اوسط لائنیں ہیں ، جو پڑھنے میں آسان ہیں۔ اس اشارے میں شامل ہیں:
- ای ایم اے کراسز کے لئے سگنل۔ ای ایم اے کراسز تصدیق شدہ رجحان کی تبدیلیوں کی نشاندہی کرنے میں مدد کرسکتے ہیں۔ ڈیفالٹ رنگ سبز اور سرخ ہیں
- تیز رفتار ای ایم اے لائن پر رجحان کی تبدیلی کے لئے سگنل۔ ڈیفالٹ رنگ نیلے اور نارنجی ہیں
بالش/بیئرش کراس اوورز اور الٹ کے لئے دستیاب انتباہات۔
لطف اٹھائیں!
بیک ٹسٹ

/*backtest
start: 2022-02-08 00:00:00
end: 2022-05-08 00:00:00
period: 4h
basePeriod: 15m
exchanges: [{"eid":"Futures_Binance","currency":"BTC_USDT"}]
*/

// This source code is subject to the terms of the Mozilla Public License 2.0 at https://mozilla.org/MPL/2.0/
// © platsn

//@version=5
indicator(title='Williams %R - Smoothed', shorttitle='The Smooth Willy')

// Williams %R
length = input.int(defval=34, minval=1)
upper = ta.highest(length)
lower = ta.lowest(length)

output = 100 * (close - upper) / (upper - lower)

fast_period = input(defval=5, title='Smoothed %R Length')
slow_period = input(defval=13, title='Slow EMA Length')

fast_ema = ta.wma(output,fast_period)
slow_ema = ta.ema(output,slow_period)

// Plot
//h1 = hline(-20, title='Upper Band')
//h2 = hline(-80, title='Lower Band')
//fill(h1, h2, title='Background', transp=90)

plot(output, title='%R', color=color.new(color.white, 80), linewidth=1)
plot(fast_ema, title='Smoothed %R', color=color.new(color.yellow, 0), linewidth=2)
plot(slow_ema, title='Slow EMA', color=color.new(color.aqua, 0), linewidth=2)

bullX = ta.crossover(fast_ema, slow_ema)
bearX = ta.crossunder(fast_ema, slow_ema)
bullreverse = fast_ema[2] > fast_ema[1] and fast_ema > fast_ema[1] and fast_ema < -30
bearreverse = fast_ema[2] < fast_ema[1] and fast_ema < fast_ema[1] and fast_ema > -70

plotX = input.bool(true, "Show EMA Crossovers")
plotRev = input.bool(true, "Show trend reversals")

//plotshape(plotX and bearX ,"Cross down", color=color.red, style=shape.triangledown, location = location.top, size =size.tiny, offset=-1)
//plotshape(plotX and bullX ,"Cross up", color=color.green, style=shape.triangleup, location = location.bottom, size =size.tiny, offset=-1)
//plotshape(plotRev and bearreverse ,"Bear reversal", color=color.orange, style=shape.triangledown, location = location.top, size =size.tiny, offset=-1)
//plotshape(plotRev and bullreverse ,"Bull reversal", color=color.blue, style=shape.triangleup, location = location.bottom, size =size.tiny, offset=-1)

//alertcondition(bearX,"Bearish Crossover", "Bearish cross on William %R")
//alertcondition(bullX,"Bullish Crossover", "Bullish cross on William %R")
//alertcondition(bearreverse,"Bearish Reversal", "Bearish Reversal on William %R")
//alertcondition(bullreverse,"Billish Reversal", "Bullish Reversal on William %R")

if plotRev and bullreverse
    strategy.entry("Enter Long", strategy.long)
else if plotRev and bearreverse
    strategy.entry("Enter Short", strategy.short)
- کم سکینر حکمت عملی کریپٹو
- چلتی اوسط کراس الرٹ، ملٹی ٹائم فریم (MTF)
- ریڈ کے حجم تیز رفتار سمت توانائی کا تناسب
- توانائی کی سلاخوں کے ساتھ ریڈ کے ڈبل ویڈر
- بہترین نگلنگ + بریک آؤٹ حکمت عملی
- HALFTREND + HEMA + SMA (غلط سگنل کی حکمت عملی)
- چلتی اوسط اور بولنگر بینڈ پر مبنی مقداری تجارتی حکمت عملی
- سوئنگ ہول/آر ایس آئی/ای ایم اے حکمت عملی
- ہیل چلتی اوسط کی بنیاد پر EMA رجحان کا تعین کرنے کی عکاسی کی حکمت عملی
- ریڈ کے مومنٹم بارز
- بڑے سنیپر انتباہات R3.0 + چیکنگ Volatility حالت + TP RSI
- چنڈے کرول سٹاپ
- RSI کراس حکمت عملی کے ساتھ CCI + EMA
- ای ایم اے بینڈ + لیلیڈ سی + بولنگر بینڈ ٹرینڈ کیچنگ حکمت عملی
- RSI MTF Ob+Os
- ایم اے سی ڈی ولی حکمت عملی
- آر ایس آئی - خرید فروخت سگنل
- ہیکن-اشی رجحان
- HA مارکیٹ تعصب
- Ichimoku بادل ہموار Oscillator
- QQE MOD + ایس ایس ایل ہائبرڈ + ودہ اتار دھماکہ
- خرید/فروخت Strat
- ای ایم اے اور اے ڈی ایکس کے ساتھ ٹرپل سپر ٹرینڈ
- ٹام ڈی مارک ترتیب گرمی کا نقشہ
- جے ایم اے + ڈبلیو ایم اے کثیر اناج کے ذریعہ
- MAGIC MACD
- سگنل کے ساتھ Z اسکور
- زینون آسان اتار چڑھاؤ کی حکمت عملی پائن زبان ورژن
- 3EMA + بولنگر + PIVOT
- کثیر اناج کی طرف سے بیگیٹ