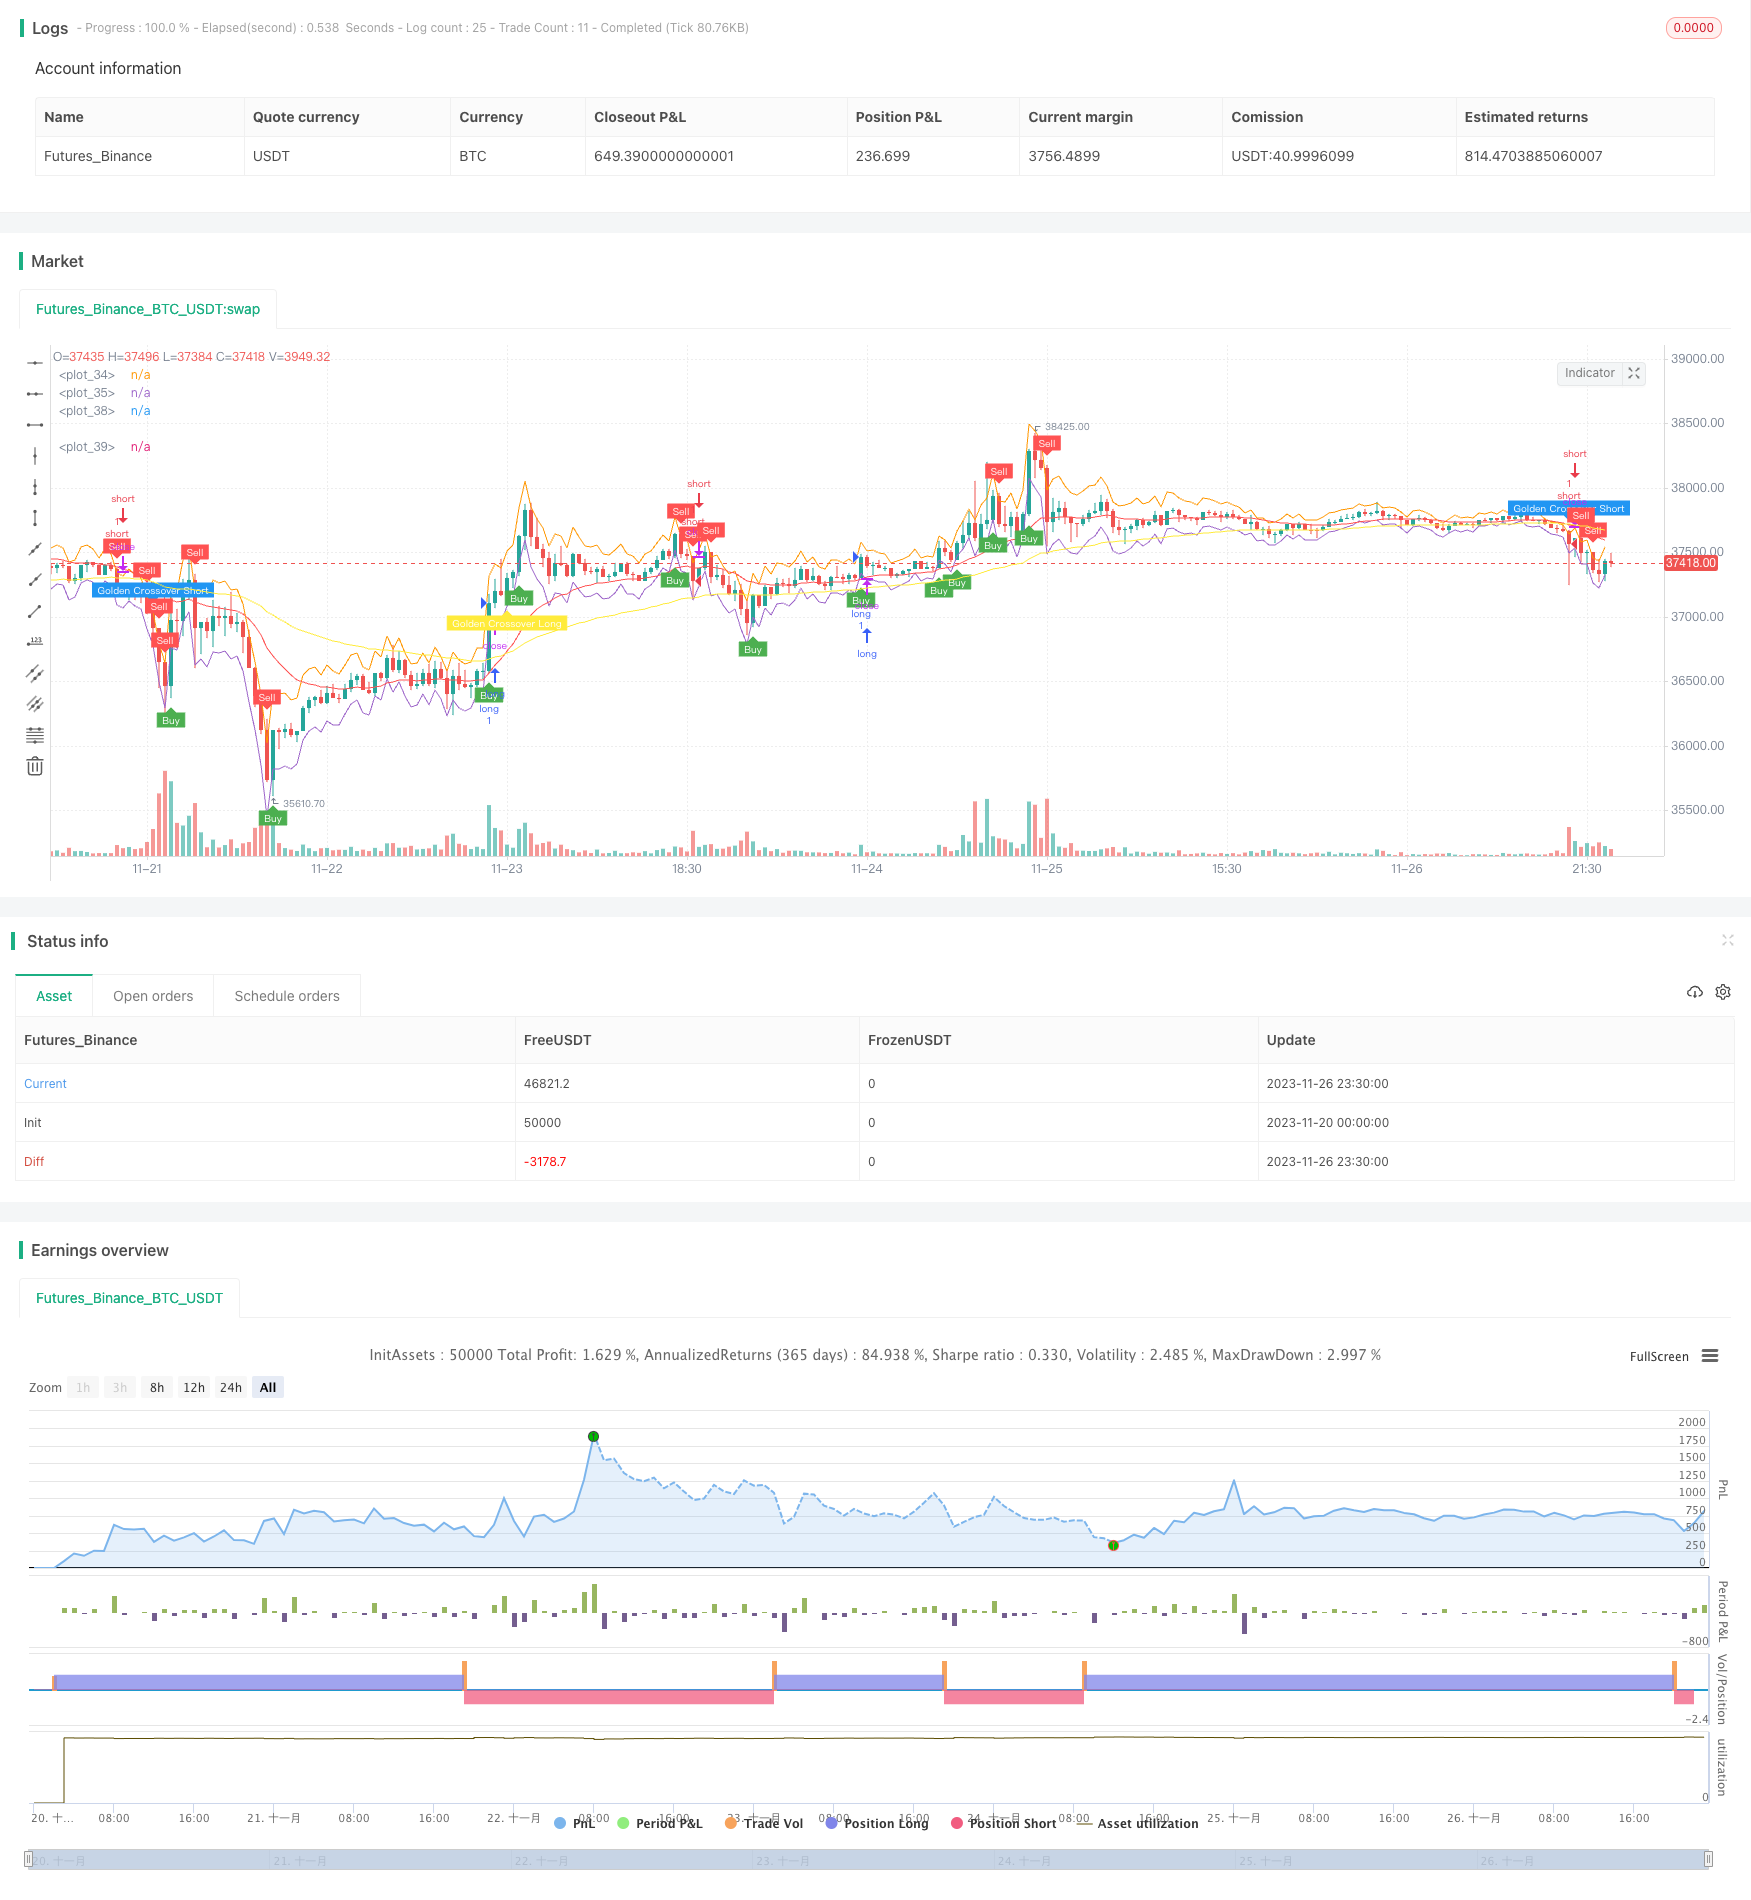
RSI اور ATR چینلز پر مبنی سپر اسکیلپنگ کی حکمت عملی
مصنف:چاؤ ژانگ، تاریخ: 2023-11-28 15:15:14ٹیگز:

RSI اور ATR چینل پر مبنی سپر اسکیلپنگ حکمت عملی
جائزہ
یہ حکمت عملی رشتہ دار طاقت انڈیکس (آر ایس آئی) اور اوسط حقیقی رینج (اے ٹی آر) چینل پر مبنی ہے ، جو 5 منٹ اور 15 منٹ کے ٹائم فریم کے لئے موزوں ہے ، جو سپر اسکیلپنگ حکمت عملی کی قسم سے تعلق رکھتا ہے۔ یہ آر ایس آئی اشارے کے ذریعہ لمبی / مختصر سمت کے اندراج کے مقامات کا تعین کرتا ہے اور اے ٹی آر چینل کو اسٹاپ نقصان اور منافع حاصل کرنے کے لئے استعمال کرتا ہے ، جس سے اعلی تعدد کی تجارت کا احساس ہوتا ہے۔
حکمت عملی کا اصول
- اہم رجحان کی سمت کا اندازہ کرنے کے لئے 21 دن کے ایکسپونینشل موونگ ایوریج (ای ایم اے) اور 65 دن کے ای ایم اے کو گولڈن کراس اور مردہ کراس بنانے کے لئے استعمال کریں۔
- جب آر ایس آئی 50 سے نیچے ہوتا ہے تو یہ bearish ہوتا ہے۔ جب 50 سے اوپر ہوتا ہے تو یہ bullish ہوتا ہے، خرید و فروخت کے سگنل بھیجتا ہے۔
- اے ٹی آر چینل کے اوپری اور نچلے بینڈ یہ ہیں: قریب + اے ٹی آر اور قریب-اے ٹی آر۔ جب قریب اے ٹی آر کے اوپری بینڈ سے ٹوٹ جاتا ہے تو فروخت کریں اور جب یہ نچلے بینڈ سے ٹوٹ جاتا ہے تو خریدیں۔
- سٹاپ نقصان کو 2 گنا ATR پر سیٹ کریں اور منافع کو 5 گنا ATR پر لے جائیں۔
فوائد کا تجزیہ
- اہم رجحان کا تعین کرنے کے لئے سنہری کراس اور مردہ کراس کا استعمال کرتے ہوئے، رجحان کے خلاف تجارت سے بچنے.
- آر ایس آئی بہتر اندراج کے وقت کی نشاندہی کرسکتا ہے۔
- اے ٹی آر چینل اسٹاپ نقصان اور منافع کے پوائنٹس کو مؤثر طریقے سے مقرر کرتا ہے، منافع نقصان کا تناسب بہت بہتر بناتا ہے.
- تیز منافع کے ساتھ اعلی تعدد scalping ٹریڈنگ کے لئے موزوں.
خطرے کا تجزیہ
- مارکیٹ کو قریب سے دیکھنے کی ضرورت ہے، ورنہ اندراج یا سٹاپ نقصان کے نقطہ نظر کو یاد کرنے سے بہت بڑا نقصان ہوسکتا ہے۔
- رجحان سازی کی مارکیٹ میں، متعدد اضافی پوزیشنیں ہوسکتی ہیں، پوزیشن سائزنگ کا اچھا کنٹرول کی ضرورت ہے.
- کثرت سے تجارت کرنے کے لیے کافی سرمایہ درکار ہے۔
اصلاح کی سمت
- زیادہ معقول سٹاپ نقصان اور منافع لینے کے لئے ATR پیرامیٹرز کو بہتر بنائیں.
- داخلہ کے معیار کو بہتر بنانے کے لئے دیگر اشارے فلٹرز شامل کریں.
- آٹو سٹاپ نقصان اور منافع لینے کے افعال شامل کریں.
- دارالحکومت کے انتظام اور پوزیشن سائزنگ کنٹرول ماڈیول شامل کریں.
خلاصہ
یہ حکمت عملی ہائی فریکوئنسی اسکیلپنگ ٹریڈنگ کی قسم سے تعلق رکھتی ہے۔ یہ تیزی سے تجارت کے لئے آر ایس آئی اشارے اور اے ٹی آر چینل کے ذریعے اندراج اور خارجی مقامات طے کرتا ہے۔ فوائد اچھے رسک کنٹرول کے ساتھ تیز منافع ہیں ، جو رجحان کے ساتھ تجارت کے لئے موزوں ہیں۔ تاہم ، کثرت سے تجارت کی حمایت کرنے کے لئے کافی سرمایہ کے ساتھ قریب سے مارکیٹ کی نگرانی کی ضرورت ہے۔ مجموعی طور پر ، یہ حکمت عملی رجحان کی تجارت کے لئے اچھی کارکردگی کا مظاہرہ کرتی ہے اور اصلاح کے ذریعہ منافع بخش ہونے میں مزید بہتری آسکتی ہے۔
/*backtest
start: 2023-11-20 00:00:00
end: 2023-11-27 00:00:00
period: 30m
basePeriod: 15m
exchanges: [{"eid":"Futures_Binance","currency":"BTC_USDT"}]
*/

//@version=4
strategy("Super Scalper - 5 Min 15 Min", overlay=true)

// Create Indicator's
shortSMA = ema(close, 21)
longSMA = ema(close, 65)
rsi = rsi(close, 14)
atr = atr(14)

// Specify  conditions
longCondition = open < close-atr
shortCondition = open > atr+close
GoldenLong = crossover(shortSMA,longSMA)
Goldenshort = crossover(longSMA,shortSMA)

plotshape(shortCondition, title="Sell Label", text="Sell", location=location.abovebar, style=shape.labeldown, size=size.tiny, color=color.red, textcolor=color.white, transp=0)
plotshape(longCondition, title="Buy Label", text="Buy", location=location.belowbar, style=shape.labelup, size=size.tiny, color=color.green, textcolor=color.white, transp=0)
plotshape(Goldenshort, title="Golden Sell Label", text="Golden Crossover Short", location=location.abovebar, style=shape.labeldown, size=size.tiny, color=color.blue, textcolor=color.white, transp=0)
plotshape(GoldenLong, title="Golden Buy Label", text="Golden Crossover Long", location=location.belowbar, style=shape.labelup, size=size.tiny, color=color.yellow, textcolor=color.white, transp=0)
// Execute trade if condition is True
if (longCondition)
    stopLoss = low - atr * 2
    takeProfit = high + atr * 5
    strategy.entry("long", strategy.long, 1, when = rsi > 50)


if (shortCondition)
    stopLoss = high + atr * 2
    takeProfit = low - atr * 5
    strategy.entry("short", strategy.short, 1, when = rsi < 50)


// Plot ATR bands to chart
plot(atr+close)
plot(close-atr)

// Plot Moving Averages
plot(shortSMA, color = color.red)
plot(longSMA, color = color.yellow)
- خام مال کی رفتار انڈیکس کی حکمت عملی
- ڈبل کچھی کی کامیابی کی حکمت عملی
- لہر کے رجحان پر مبنی مقداری تجارتی حکمت عملی
- Ichimoku Kumo موڑ سونے جذب کرنے کی حکمت عملی
- جزوی منافع لینے کی حکمت عملی کے ساتھ مرحلہ وار ٹریلنگ اسٹاپ
- ایس ٹی آئی اور سی سی آئی ہل حرکت پذیر اوسط رجحان کی نگرانی کی حکمت عملی
- ریورس انجینئرنگ آر ایس آئی حکمت عملی
- دوہری سی سی آئی مقداری حکمت عملی
- دوہری EMA کراس اوور بریک آؤٹ حکمت عملی
- ملٹی ٹائم فریم ایم اے سی ڈی حکمت عملی
- ڈونچیئن رجحان کی حکمت عملی
- کثیر ایس ایم اے چلتی اوسط کراس اوور حکمت عملی
- ملٹی آر ایس آئی اشارے ٹریڈنگ کی حکمت عملی
- سپر ٹرینڈ حکمت عملی کے ساتھ ٹریلنگ سٹاپ نقصان
- وزن شدہ چلتی اوسط بریک آؤٹ الٹ کرنے کی حکمت عملی
- حرکت پذیر اوسط رشتہ دار طاقت انڈیکس حکمت عملی
- ADX ذہین ٹرینڈ ٹریکنگ حکمت عملی
- آر ایس آئی مومنٹم مجموعی حکمت عملی
- قیمت کے فرق پر مبنی ٹریلنگ سٹاپ نقصان کی حکمت عملی
- حرکت پذیر اوسط بریک آؤٹ کی حکمت عملی