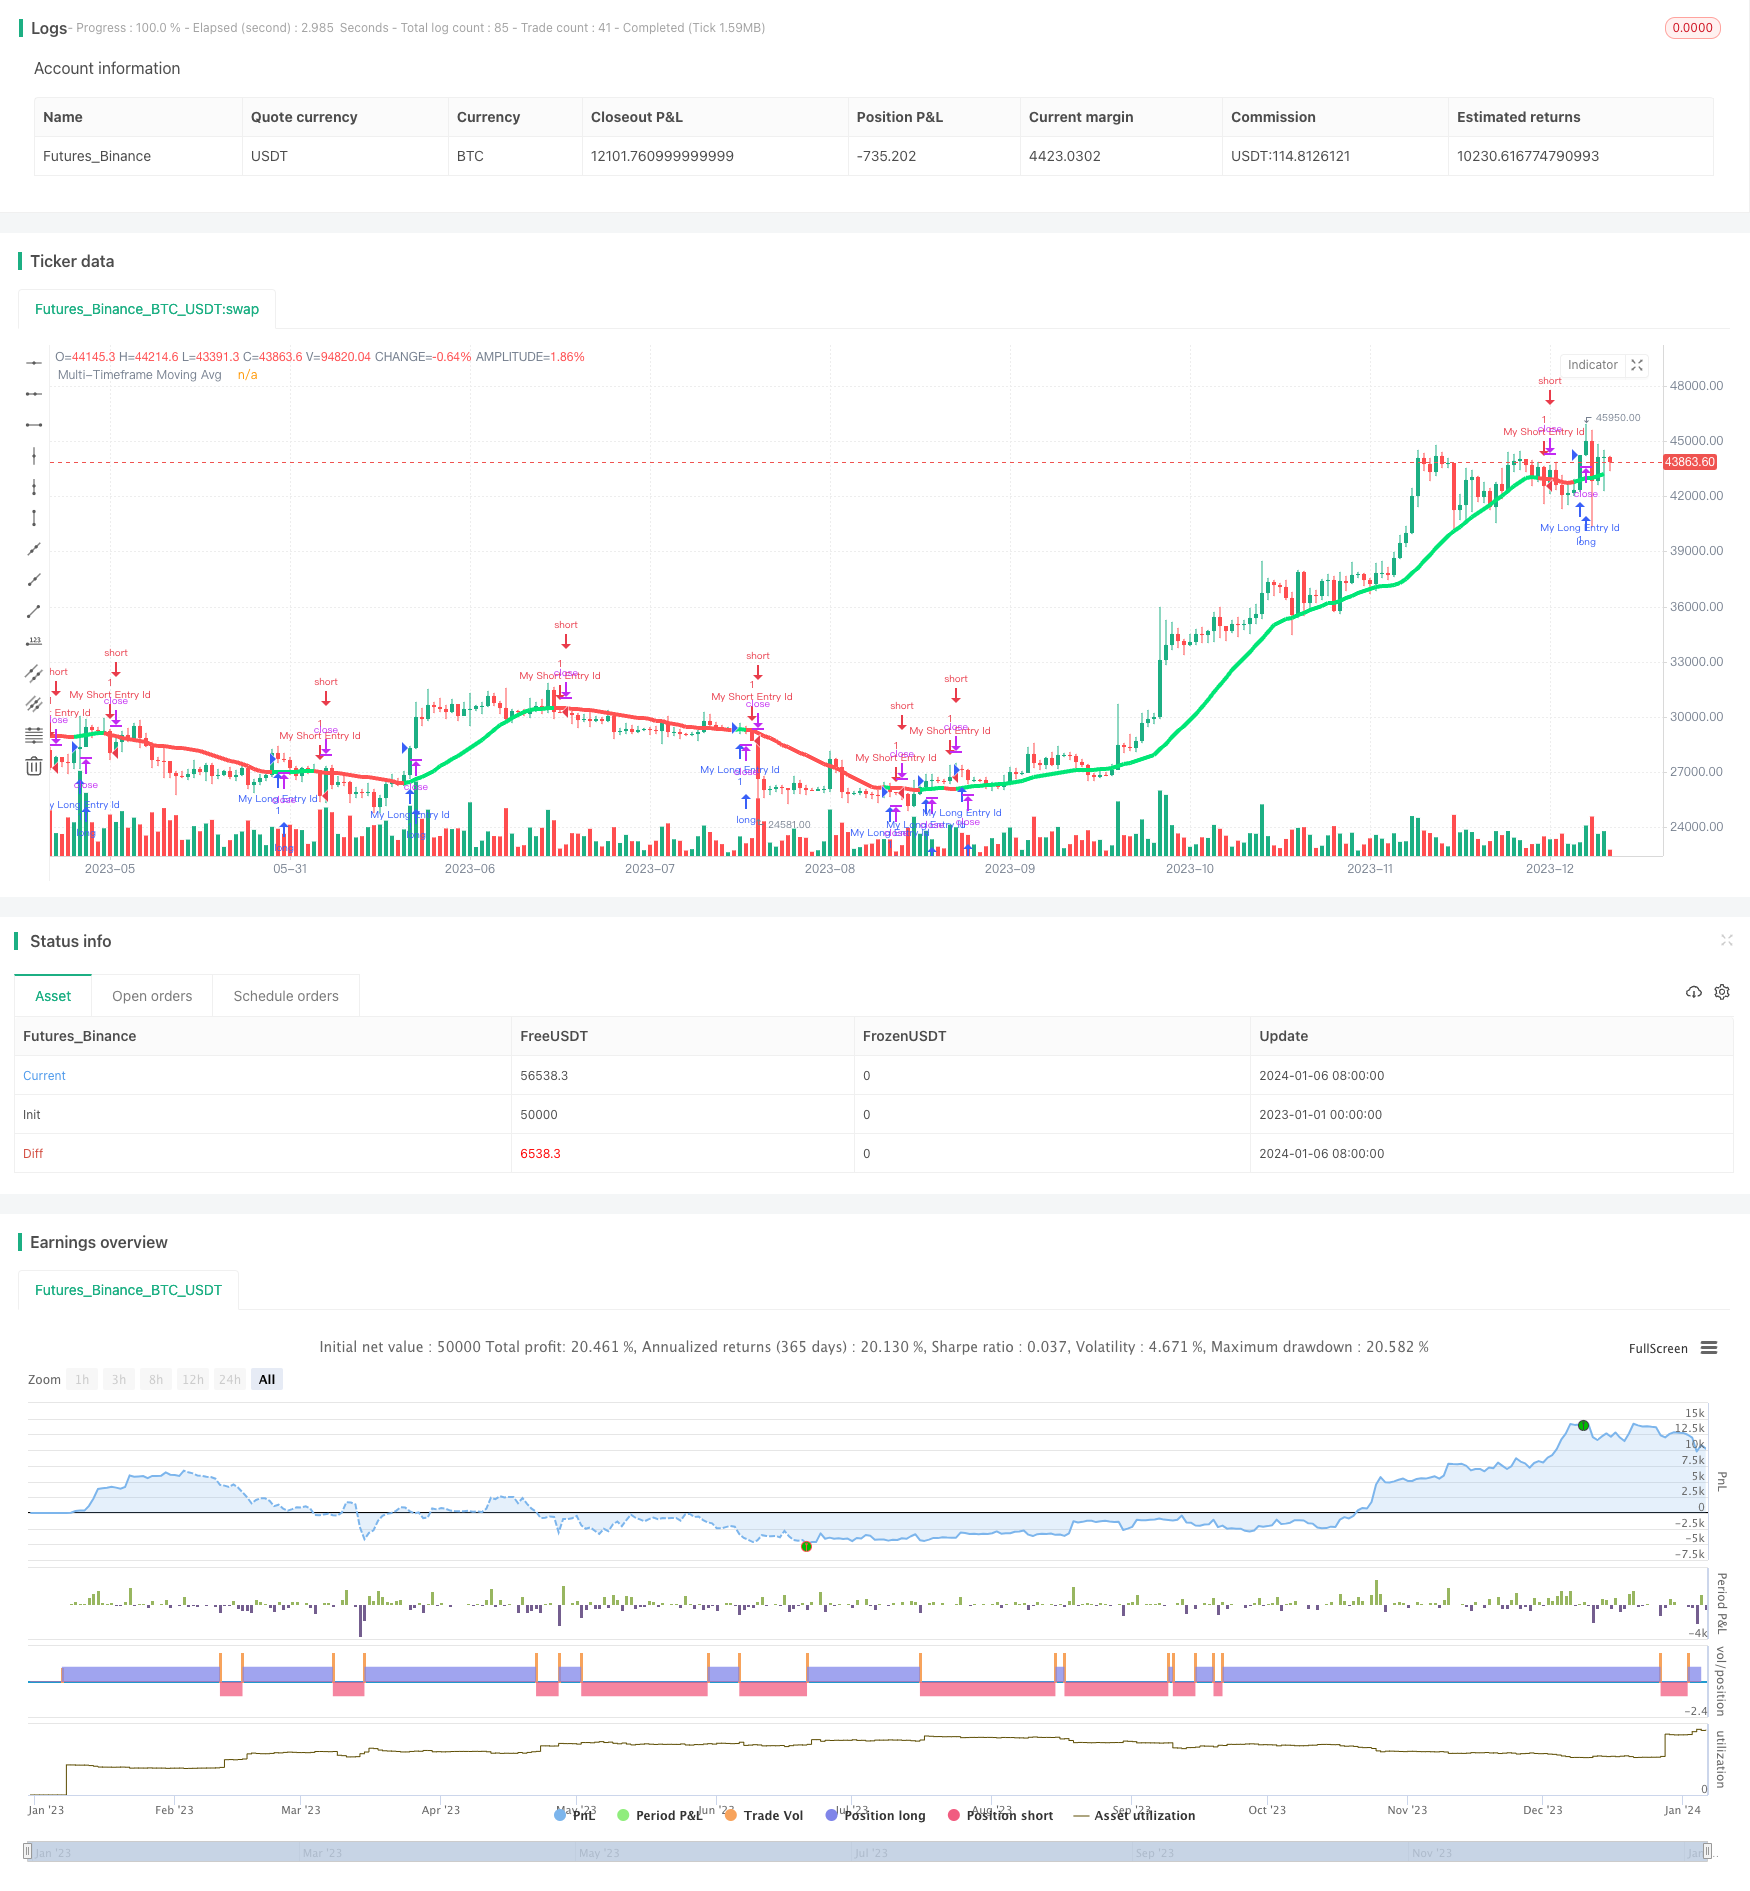
موونگ ایوریج کراس اوور سگنل کی حکمت عملی
تخلیق کی تاریخ:
2024-01-08 15:54:32
آخر میں ترمیم کریں:
2024-01-08 15:54:32
کاپی:
0
کلکس کی تعداد:
686
1
پر توجہ دیں
1628
پیروکار

جائزہ
یہ حکمت عملی خرید و فروخت کے سگنل دینے کے لیے مختلف قسم کی حرکت پذیر اوسط کی حساب کتاب اور ان کا نقشہ بنا کر حرکت پذیر اوسط کے درمیان کراس سگنل کو حاصل کرتی ہے۔
حکمت عملی کا اصول
- حکمت عملی میں مختلف قسم کے چلتی اوسطوں کا انتخاب کرنے کی اجازت ہے ، بشمول SMA ، EMA ، WMA وغیرہ۔
- حکمت عملی ایک اہم منتقل اوسط کا حساب لگاتی ہے اور دوسری منتقل اوسط کا انتخاب کرنے کی بھی اجازت دیتی ہے۔
- بنیادی اور سیکنڈری منتقل اوسط کی کراسنگ کی طرف سے مارکیٹ کی خالی حالت کا اندازہ لگائیں۔
- خریدنے کا اشارہ اس وقت پیدا ہوتا ہے جب ایک اہم حرکت پذیر اوسط پر اپنی مقررہ مدت کے لئے ایک حرکت پذیر اوسط ہوتا ہے۔ فروخت کا اشارہ اس وقت پیدا ہوتا ہے جب ایک اہم حرکت پذیر اوسط کے نیچے اپنی مقررہ مدت کے لئے ایک حرکت پذیر اوسط ہوتا ہے۔
- اس طرح ، ایک متحرک اوسط کی کراسنگ کی طرف سے ، مارکیٹ کی خالی حالت کا زیادہ واضح اندازہ لگایا جاسکتا ہے۔
اسٹریٹجک فوائد
- مختلف ضروریات کو پورا کرنے کے لئے اپنی مرضی کے مطابق چلتی اوسط کی اقسام
- سگنل کو مزید واضح کرنے کے لئے ایک دوسری منتقل اوسط شامل کی جاسکتی ہے۔
- اپنی مرضی کے مطابق منتقل اوسط مدت مختلف وقت کی مدت کے لئے لاگو ہوتا ہے.
- ہموار رنگ رینڈرینگ، گرافکس کو زیادہ واضح بنانے کے لئے
- کراس سگنل میکانزم کا استعمال کرتے ہوئے، کثیر فضائی حالت کا تعین کرنے کے لئے درست.
حکمت عملی کے خطرات اور اصلاحات
- منتقل اوسط تاخیر کا شکار ہے اور غلط سگنل کا امکان ہے۔ مناسب طریقے سے منتخب کردہ منحنی خطوط کو منتقل اوسط کے مطابق بنایا جاسکتا ہے۔
- غلط طور پر ترتیب دی گئی حرکت پذیر اوسط کی مدت سے تجارت کے مواقع ضائع ہوسکتے ہیں۔ زیادہ سے زیادہ مجموعوں کی جانچ کرکے بہترین پیرامیٹرز تلاش کریں۔
- دیگر اشارے جیسے ٹرانزیکشن حجم توانائی اشارے وغیرہ کے ساتھ مل کر جانچ پڑتال کی سفارش کی جاتی ہے ، جس سے خطرے کو کم کیا جاسکتا ہے۔
- سگنل کی درستگی کو بہتر بنانے کے لئے ، سگنل کی حرکت پذیری اوسط کو کرل اوسط میں تبدیل کرنے پر غور کیا جاسکتا ہے۔
- حکمت عملی کو بہتر بنانے کے لئے ایل ایس ٹی ایم جیسے گہری سیکھنے کے ماڈل کے ساتھ مل کر۔
خلاصہ کریں۔
اس حکمت عملی کا مجموعی نظریہ واضح ہے ، اور اس میں چلتی اوسط کی کراسنگ کے اصول کا استعمال کیا گیا ہے تاکہ مارکیٹ میں زیادہ جگہ کی صورتحال کا اندازہ لگایا جاسکے ، اور مختلف ضروریات کو پورا کرنے کے لئے پیرامیٹرز کو اپنی مرضی کے مطابق بنایا جاسکے۔ اس کے ساتھ ساتھ کچھ پریشانیاں بھی ہیں ، لیکن ماڈل اور پیرامیٹرز کو بہتر بنانے کے ذریعے اس میں بہتری لائی جاسکتی ہے۔ مجموعی طور پر ، یہ حکمت عملی چلتی اوسط پر مبنی تجارتی حکمت عملی کی ایک عمدہ نمائندگی کرتی ہے۔
حکمت عملی کا ماخذ کوڈ
/*backtest
start: 2023-01-01 00:00:00
end: 2024-01-07 00:00:00
period: 1d
basePeriod: 1h
exchanges: [{"eid":"Futures_Binance","currency":"BTC_USDT"}]
*/

//@version=3
strategy("Moving averages-Strategy", overlay=true)
//Created by user ChrisMoody 4-24-2014
//Plots The Majority of Moving Averages
//Defaults to Current Chart Time Frame --- But Can Be Changed to Higher Or Lower Time Frames
//2nd MA Capability with Show Crosses Feature

//inputs
src = close
useCurrentRes = input(true, title="Use Current Chart Resolution?")
resCustom = input(title="Use Different Timeframe? Uncheck Box Above",defval="D")
len = input(20, title="Moving Average Length - LookBack Period")
atype = input(1,minval=1,maxval=7,title="1=SMA, 2=EMA, 3=WMA, 4=HullMA, 5=VWMA, 6=RMA, 7=TEMA")
cc = input(true,title="Change Color Based On Direction?")
smoothe = input(2, minval=1, maxval=10, title="Color Smoothing - 1 = No Smoothing")
doma2 = input(false, title="Optional 2nd Moving Average")
len2 = input(50, title="Moving Average Length - Optional 2nd MA")
atype2 = input(1,minval=1,maxval=7,title="1=SMA, 2=EMA, 3=WMA, 4=HullMA, 5=VWMA, 6=RMA, 7=TEMA")
cc2 = input(true,title="Change Color Based On Direction 2nd MA?")
warn = input(false, title="***You Can Turn On The Show Dots Parameter Below Without Plotting 2nd MA to See Crosses***")
warn2 = input(false, title="***If Using Cross Feature W/O Plotting 2ndMA - Make Sure 2ndMA Parameters are Set Correctly***")
sd = input(false, title="Show Dots on Cross of Both MA's")


res = useCurrentRes ? timeframe.period : resCustom
//hull ma definition
hullma = wma(2*wma(src, len/2)-wma(src, len), round(sqrt(len)))
//TEMA definition
ema1 = ema(src, len)
ema2 = ema(ema1, len)
ema3 = ema(ema2, len)
tema = 3 * (ema1 - ema2) + ema3

avg = atype == 1 ? sma(src,len) : atype == 2 ? ema(src,len) : atype == 3 ? wma(src,len) : atype == 4 ? hullma : atype == 5 ? vwma(src, len) : atype == 6 ? rma(src,len) : tema
//2nd Ma - hull ma definition
hullma2 = wma(2*wma(src, len2/2)-wma(src, len2), round(sqrt(len2)))
//2nd MA TEMA definition
sema1 = ema(src, len2)
sema2 = ema(sema1, len2)
sema3 = ema(sema2, len2)
stema = 3 * (sema1 - sema2) + sema3

avg2 = atype2 == 1 ? sma(src,len2) : atype2 == 2 ? ema(src,len2) : atype2 == 3 ? wma(src,len2) : atype2 == 4 ? hullma2 : atype2 == 5 ? vwma(src, len2) : atype2 == 6 ? rma(src,len2) : tema

out = avg
out_two = avg2

out1 = request.security(syminfo.tickerid, res, out)
out2 = request.security(syminfo.tickerid, res, out_two)

ma_up = out1 >= out1[smoothe]
ma_down = out1 < out1[smoothe]

col = cc ? ma_up ? lime : ma_down ? red : aqua : aqua
col2 = cc2 ? ma_up ? lime : ma_down ? red : aqua : aqua

circleYPosition = out2

plot(out1, title="Multi-Timeframe Moving Avg", style=line, linewidth=4, color = col)
plot(doma2 and out2 ? out2 : na, title="2nd Multi-TimeFrame Moving Average", style=circles, linewidth=4, color=col2)
plot(sd and cross(out1, out2) ? circleYPosition : na,style=cross, linewidth=5, color=yellow)


longCondition = crossover(out1, out1[smoothe])
if (longCondition)
    strategy.entry("My Long Entry Id", strategy.long)

shortCondition = crossunder(out1, out1[smoothe])
if (shortCondition)
    strategy.entry("My Short Entry Id", strategy.short)