Cuộc thảo luận về phương pháp thử nghiệm chiến lược dựa trên Random Ticker Generator
Tác giả:FMZ~Lydia, Tạo: 2024-12-02 11:26:13, Cập nhật: 2024-12-02 21:39:39
Lời giới thiệu
Hệ thống backtesting của nền tảng FMZ Quant Trading là một hệ thống backtesting liên tục lặp lại, cập nhật và nâng cấp. Nó thêm các chức năng và tối ưu hóa hiệu suất dần dần từ chức năng backtesting cơ bản ban đầu. Với sự phát triển của nền tảng, hệ thống backtesting sẽ tiếp tục được tối ưu hóa và nâng cấp. Hôm nay chúng ta sẽ thảo luận một chủ đề dựa trên hệ thống backtesting:
Nhu cầu
Trong lĩnh vực giao dịch định lượng, việc phát triển và tối ưu hóa các chiến lược không thể tách rời khỏi việc xác minh dữ liệu thị trường thực tế. Tuy nhiên, trong các ứng dụng thực tế, do môi trường thị trường phức tạp và thay đổi, dựa vào dữ liệu lịch sử để kiểm tra lại có thể không đủ, chẳng hạn như thiếu bảo hiểm các điều kiện thị trường cực đoan hoặc kịch bản đặc biệt. Do đó, thiết kế một máy tạo thị trường ngẫu nhiên hiệu quả đã trở thành một công cụ hiệu quả cho các nhà phát triển chiến lược định lượng.
Khi chúng ta cần để cho chiến lược theo dõi lại dữ liệu lịch sử trên một sàn giao dịch hoặc tiền tệ nhất định, chúng ta có thể sử dụng nguồn dữ liệu chính thức của nền tảng FMZ để kiểm tra lại.
Ý nghĩa của việc sử dụng dữ liệu ticker ngẫu nhiên là:
-
- Đánh giá độ vững chắc của các chiến lược Generator ticker ngẫu nhiên có thể tạo ra nhiều kịch bản thị trường có thể, bao gồm biến động cực cao, biến động thấp, thị trường xu hướng và thị trường biến động.
Chiến lược có thể thích nghi với xu hướng và biến động thay đổi? Liệu chiến lược sẽ gây ra tổn thất lớn trong điều kiện thị trường cực đoan?
-
- Xác định các điểm yếu tiềm tàng trong chiến lược Bằng cách mô phỏng một số tình huống thị trường bất thường (như các sự kiện thiên nga đen giả thuyết), các điểm yếu tiềm năng trong chiến lược có thể được phát hiện và cải thiện.
Chiến lược có quá phụ thuộc vào một cấu trúc thị trường nhất định không? Có nguy cơ quá chuẩn không?
-
- Tối ưu hóa các thông số chiến lược Dữ liệu được tạo ngẫu nhiên cung cấp một môi trường thử nghiệm đa dạng hơn cho tối ưu hóa tham số chiến lược, mà không phải dựa hoàn toàn vào dữ liệu lịch sử. Điều này cho phép bạn tìm thấy phạm vi tham số của chiến lược một cách toàn diện hơn và tránh bị giới hạn trong các mô hình thị trường cụ thể trong dữ liệu lịch sử.
-
- Lấp đầy khoảng trống trong dữ liệu lịch sử Trong một số thị trường (như thị trường mới nổi hoặc thị trường giao dịch tiền tệ nhỏ), dữ liệu lịch sử có thể không đủ để bao gồm tất cả các điều kiện thị trường có thể.
-
- Phát triển lặp đi lặp lại nhanh Sử dụng dữ liệu ngẫu nhiên để thử nghiệm nhanh có thể tăng tốc độ lặp lại phát triển chiến lược mà không dựa vào điều kiện thị trường thời gian thực hoặc làm sạch và tổ chức dữ liệu tốn thời gian.
Tuy nhiên, cũng cần phải đánh giá chiến lược một cách hợp lý Đối với dữ liệu ticker được tạo ngẫu nhiên, xin lưu ý:
-
- Mặc dù các nhà tạo thị trường ngẫu nhiên có ích, tầm quan trọng của chúng phụ thuộc vào chất lượng dữ liệu được tạo ra và thiết kế kịch bản mục tiêu:
-
- Logic sản xuất cần phải gần với thị trường thực: Nếu thị trường được tạo ngẫu nhiên hoàn toàn không liên lạc với thực tế, kết quả thử nghiệm có thể thiếu giá trị tham chiếu. Ví dụ, máy phát điện có thể được thiết kế dựa trên các đặc điểm thống kê thị trường thực tế (như phân bố biến động, tỷ lệ xu hướng).
-
- Nó không thể thay thế hoàn toàn thử nghiệm dữ liệu thực: dữ liệu ngẫu nhiên chỉ có thể bổ sung cho việc phát triển và tối ưu hóa các chiến lược.
Sau khi nói nhiều như vậy, làm thế nào chúng ta có thể "lập trình" một số dữ liệu? Làm thế nào chúng ta có thể "lập trình" dữ liệu cho hệ thống backtesting để sử dụng thuận tiện, nhanh chóng và dễ dàng?
Ý tưởng thiết kế
Bài viết này được thiết kế để cung cấp một điểm khởi đầu để thảo luận và cung cấp một tính toán tạo ticker ngẫu nhiên tương đối đơn giản. Trên thực tế, có nhiều thuật toán mô phỏng, mô hình dữ liệu và các công nghệ khác có thể được áp dụng. Do không gian thảo luận hạn chế, chúng tôi sẽ không sử dụng các phương pháp mô phỏng dữ liệu phức tạp.
Kết hợp chức năng nguồn dữ liệu tùy chỉnh của hệ thống backtesting nền tảng, chúng tôi đã viết một chương trình bằng Python.
-
- Tạo một bộ dữ liệu K-line ngẫu nhiên và ghi chúng vào một tệp CSV để ghi liên tục, để dữ liệu được tạo có thể được lưu.
-
- Sau đó tạo một dịch vụ để cung cấp hỗ trợ nguồn dữ liệu cho hệ thống backtesting.
-
- Hiển thị dữ liệu đường K được tạo trong biểu đồ.
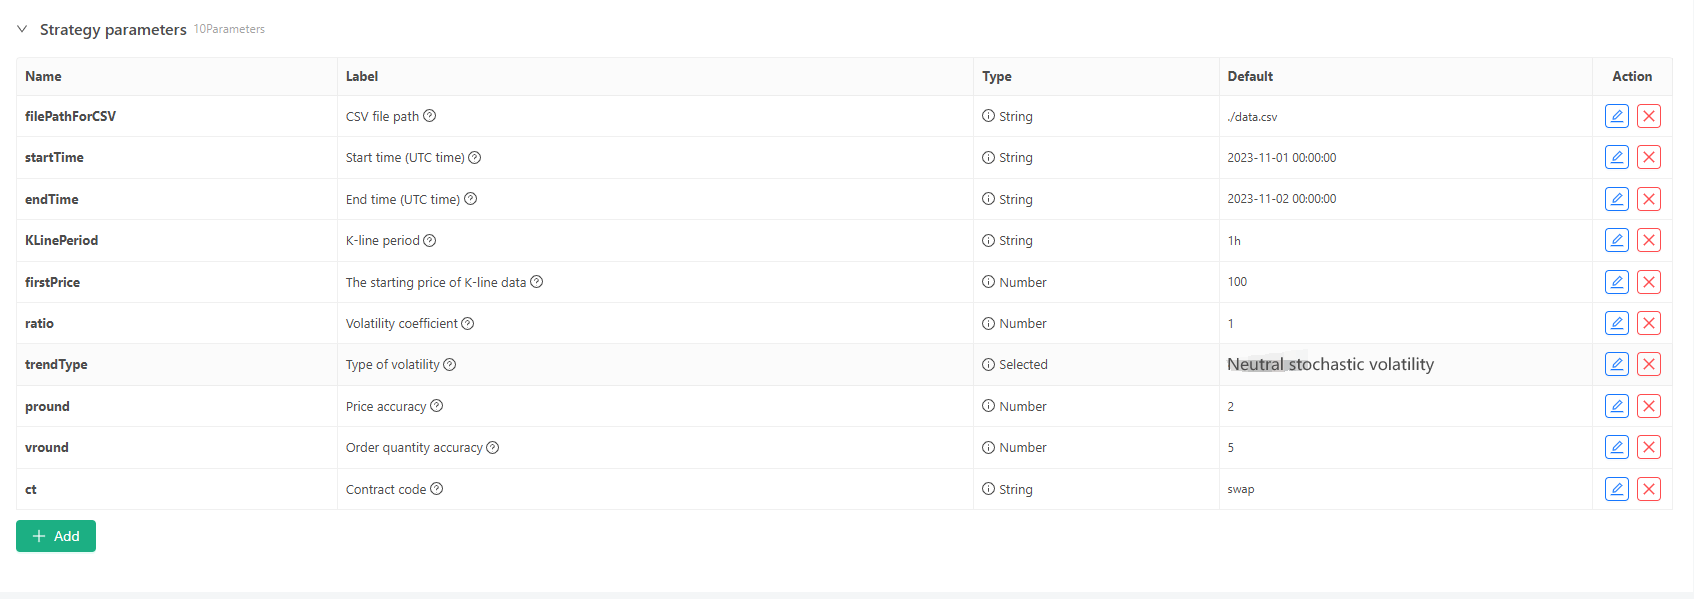
Đối với một số tiêu chuẩn tạo và lưu trữ tệp dữ liệu đường K, các điều khiển tham số sau đây có thể được xác định:

-
Chế độ tạo dữ liệu ngẫu nhiên Để mô phỏng kiểu biến động của dữ liệu đường K, một thiết kế đơn giản chỉ đơn giản là sử dụng xác suất của các số ngẫu nhiên dương và âm. Khi dữ liệu được tạo ra không nhiều, nó có thể không phản ánh mô hình thị trường cần thiết. Nếu có một phương pháp tốt hơn, phần mã này có thể được thay thế. Dựa trên thiết kế đơn giản này, điều chỉnh phạm vi tạo số ngẫu nhiên và một số hệ số trong mã có thể ảnh hưởng đến hiệu ứng dữ liệu được tạo ra.
-
Kiểm tra dữ liệu Dữ liệu đường K được tạo ra cũng cần được kiểm tra tính hợp lý, để kiểm tra xem giá mở cao và giá đóng thấp có vi phạm định nghĩa hay không và để kiểm tra tính liên tục của dữ liệu đường K.
Hệ thống kiểm tra lại Random Ticker Generator
import _thread
import json
import math
import csv
import random
import os
import datetime as dt
from http.server import HTTPServer, BaseHTTPRequestHandler
from urllib.parse import parse_qs, urlparse

arrTrendType = ["down", "slow_up", "sharp_down", "sharp_up", "narrow_range", "wide_range", "neutral_random"]

def url2Dict(url):
    query = urlparse(url).query
    params = parse_qs(query)
    result = {key: params[key][0] for key in params}
    return result

class Provider(BaseHTTPRequestHandler):
    def do_GET(self):
        global filePathForCSV, pround, vround, ct
        try:
            self.send_response(200)
            self.send_header("Content-type", "application/json")
            self.end_headers()

            dictParam = url2Dict(self.path)
            Log("the custom data source service receives the request, self.path:", self.path, "query parameter:", dictParam)

            eid = dictParam["eid"]
            symbol = dictParam["symbol"]
            arrCurrency = symbol.split(".")[0].split("_")
            baseCurrency = arrCurrency[0]
            quoteCurrency = arrCurrency[1]
            fromTS = int(dictParam["from"]) * int(1000)
            toTS = int(dictParam["to"]) * int(1000)
            priceRatio = math.pow(10, int(pround))
            amountRatio = math.pow(10, int(vround))

            data = {
                "detail": {
                    "eid": eid,
                    "symbol": symbol,
                    "alias": symbol,
                    "baseCurrency": baseCurrency,
                    "quoteCurrency": quoteCurrency,
                    "marginCurrency": quoteCurrency,
                    "basePrecision": vround,
                    "quotePrecision": pround,
                    "minQty": 0.00001,
                    "maxQty": 9000,
                    "minNotional": 5,
                    "maxNotional": 9000000,
                    "priceTick": 10 ** -pround,
                    "volumeTick": 10 ** -vround,
                    "marginLevel": 10,
                    "contractType": ct
                },
                "schema" : ["time", "open", "high", "low", "close", "vol"],
                "data" : []
            }

            listDataSequence = []
            with open(filePathForCSV, "r") as f:
                reader = csv.reader(f)
                header = next(reader)
                headerIsNoneCount = 0
                if len(header) != len(data["schema"]):
                    Log("The CSV file format is incorrect, the number of columns is different, please check!", "#FF0000")
                    return
                for ele in header:
                    for i in range(len(data["schema"])):
                        if data["schema"][i] == ele or ele == "":
                            if ele == "":
                                headerIsNoneCount += 1
                            if headerIsNoneCount > 1:
                                Log("The CSV file format is incorrect, please check!", "#FF0000")
                                return
                            listDataSequence.append(i)
                            break

                while True:
                    record = next(reader, -1)
                    if record == -1:
                        break
                    index = 0
                    arr = [0, 0, 0, 0, 0, 0]
                    for ele in record:
                        arr[listDataSequence[index]] = int(ele) if listDataSequence[index] == 0 else (int(float(ele) * amountRatio) if listDataSequence[index] == 5 else int(float(ele) * priceRatio))
                        index += 1
                    data["data"].append(arr)
            Log("data.detail: ", data["detail"], "Respond to backtesting system requests.")
            self.wfile.write(json.dumps(data).encode())
        except BaseException as e:
            Log("Provider do_GET error, e:", e)
        return

def createServer(host):
    try:
        server = HTTPServer(host, Provider)
        Log("Starting server, listen at: %s:%s" % host)
        server.serve_forever()
    except BaseException as e:
        Log("createServer error, e:", e)
        raise Exception("stop")

class KlineGenerator:
    def __init__(self, start_time, end_time, interval):
        self.start_time = dt.datetime.strptime(start_time, "%Y-%m-%d %H:%M:%S")
        self.end_time = dt.datetime.strptime(end_time, "%Y-%m-%d %H:%M:%S")
        self.interval = self._parse_interval(interval)
        self.timestamps = self._generate_time_series()

    def _parse_interval(self, interval):
        unit = interval[-1]
        value = int(interval[:-1])

        if unit == "m":
            return value * 60
        elif unit == "h":
            return value * 3600
        elif unit == "d":
            return value * 86400
        else:
            raise ValueError("Unsupported K-line period, please use 'm', 'h', or 'd'.")

    def _generate_time_series(self):
        timestamps = []
        current_time = self.start_time
        while current_time <= self.end_time:
            timestamps.append(int(current_time.timestamp() * 1000))
            current_time += dt.timedelta(seconds=self.interval)
        return timestamps

    def generate(self, initPrice, trend_type="neutral", volatility=1):
        data = []
        current_price = initPrice
        angle = 0
        for timestamp in self.timestamps:
            angle_radians = math.radians(angle % 360)
            cos_value = math.cos(angle_radians)

            if trend_type == "down":
                upFactor = random.uniform(0, 0.5)
                change = random.uniform(-0.5, 0.5 * upFactor) * volatility * random.uniform(1, 3)
            elif trend_type == "slow_up":
                downFactor = random.uniform(0, 0.5)
                change = random.uniform(-0.5 * downFactor, 0.5) * volatility * random.uniform(1, 3)
            elif trend_type == "sharp_down":
                upFactor = random.uniform(0, 0.5)
                change = random.uniform(-10, 0.5 * upFactor) * volatility * random.uniform(1, 3)
            elif trend_type == "sharp_up":
                downFactor = random.uniform(0, 0.5)
                change = random.uniform(-0.5 * downFactor, 10) * volatility * random.uniform(1, 3)
            elif trend_type == "narrow_range":
                change = random.uniform(-0.2, 0.2) * volatility * random.uniform(1, 3)
            elif trend_type == "wide_range":
                change = random.uniform(-3, 3) * volatility * random.uniform(1, 3)
            else:
                change = random.uniform(-0.5, 0.5) * volatility * random.uniform(1, 3)

            change = change + cos_value * random.uniform(-0.2, 0.2) * volatility
            open_price = current_price
            high_price = open_price + random.uniform(0, abs(change))
            low_price = max(open_price - random.uniform(0, abs(change)), random.uniform(0, open_price))
            close_price = open_price + change if open_price + change < high_price and open_price + change > low_price else random.uniform(low_price, high_price)

            if (high_price >= open_price and open_price >= close_price and close_price >= low_price) or (high_price >= close_price and close_price >= open_price and open_price >= low_price):
                pass
            else:
                Log("Abnormal data:", high_price, open_price, low_price, close_price, "#FF0000")

            high_price = max(high_price, open_price, close_price)
            low_price = min(low_price, open_price, close_price)

            base_volume = random.uniform(1000, 5000)
            volume = base_volume * (1 + abs(change) * 0.2)

            kline = {
                "Time": timestamp,
                "Open": round(open_price, 2),
                "High": round(high_price, 2),
                "Low": round(low_price, 2),
                "Close": round(close_price, 2),
                "Volume": round(volume, 2),
            }
            data.append(kline)
            current_price = close_price
            angle += 1
        return data

    def save_to_csv(self, filename, data):
        with open(filename, mode="w", newline="") as csvfile:
            writer = csv.writer(csvfile)
            writer.writerow(["", "open", "high", "low", "close", "vol"])
            for idx, kline in enumerate(data):
                writer.writerow(
                    [kline["Time"], kline["Open"], kline["High"], kline["Low"], kline["Close"], kline["Volume"]]
                )

        Log("Current path:", os.getcwd())
        with open("data.csv", "r") as file:
            lines = file.readlines()
            if len(lines) > 1:
                Log("The file was written successfully. The following is part of the file content:")
                Log("".join(lines[:5]))
            else:
                Log("Failed to write the file, the file is empty!")

def main():
    Chart({})
    LogReset(1)

    try:
        # _thread.start_new_thread(createServer, (("localhost", 9090), ))
        _thread.start_new_thread(createServer, (("0.0.0.0", 9090), ))
        Log("Start the custom data source service thread, and the data is provided by the CSV file.", ", Address/Port: 0.0.0.0:9090", "#FF0000")
    except BaseException as e:
        Log("Failed to start custom data source service!")
        Log("error message:", e)
        raise Exception("stop")

    while True:
        cmd = GetCommand()
        if cmd:
            if cmd == "createRecords":
                Log("Generator parameters:", "Start time:", startTime, "End time:", endTime, "K-line period:", KLinePeriod, "Initial price:", firstPrice, "Type of volatility:", arrTrendType[trendType], "Volatility coefficient:", ratio)
                generator = KlineGenerator(
                    start_time=startTime,
                    end_time=endTime,
                    interval=KLinePeriod,
                )
                kline_data = generator.generate(firstPrice, trend_type=arrTrendType[trendType], volatility=ratio)
                generator.save_to_csv("data.csv", kline_data)
                ext.PlotRecords(kline_data, "%s_%s" % ("records", KLinePeriod))
        LogStatus(_D())
        Sleep(2000)
Thực hành trong hệ thống kiểm tra ngược
- Tạo ví dụ chiến lược trên, cấu hình tham số và chạy nó.
- Các giao dịch trực tiếp (các trường hợp chiến lược) cần phải được chạy trên docker được triển khai trên máy chủ, nó cần một IP mạng công cộng, để hệ thống backtesting có thể truy cập nó và thu thập dữ liệu.
- Nhấp vào nút tương tác, và chiến lược sẽ bắt đầu tạo dữ liệu ticker ngẫu nhiên tự động.

- Dữ liệu được tạo sẽ được hiển thị trên biểu đồ để quan sát dễ dàng, và dữ liệu sẽ được ghi lại trong tệp data.csv cục bộ.

- Bây giờ chúng ta có thể sử dụng dữ liệu được tạo ngẫu nhiên này và sử dụng bất kỳ chiến lược nào để kiểm tra lại:

/*backtest
start: 2024-10-01 08:00:00
end: 2024-10-31 08:55:00
period: 1h
basePeriod: 1h
exchanges: [{"eid":"Futures_Binance","currency":"BTC_USDT","feeder":"http://xxx.xxx.xxx.xxx:9090"}]
args: [["ContractType","quarter",358374]]
*/
Theo thông tin trên, cấu hình và điều chỉnh.http://xxx.xxx.xxx.xxx:9090là địa chỉ IP máy chủ và cổng mở của chiến lược tạo ticker ngẫu nhiên.
Đây là nguồn dữ liệu tùy chỉnh, có thể được tìm thấy trong phần nguồn dữ liệu tùy chỉnh của tài liệu API nền tảng.
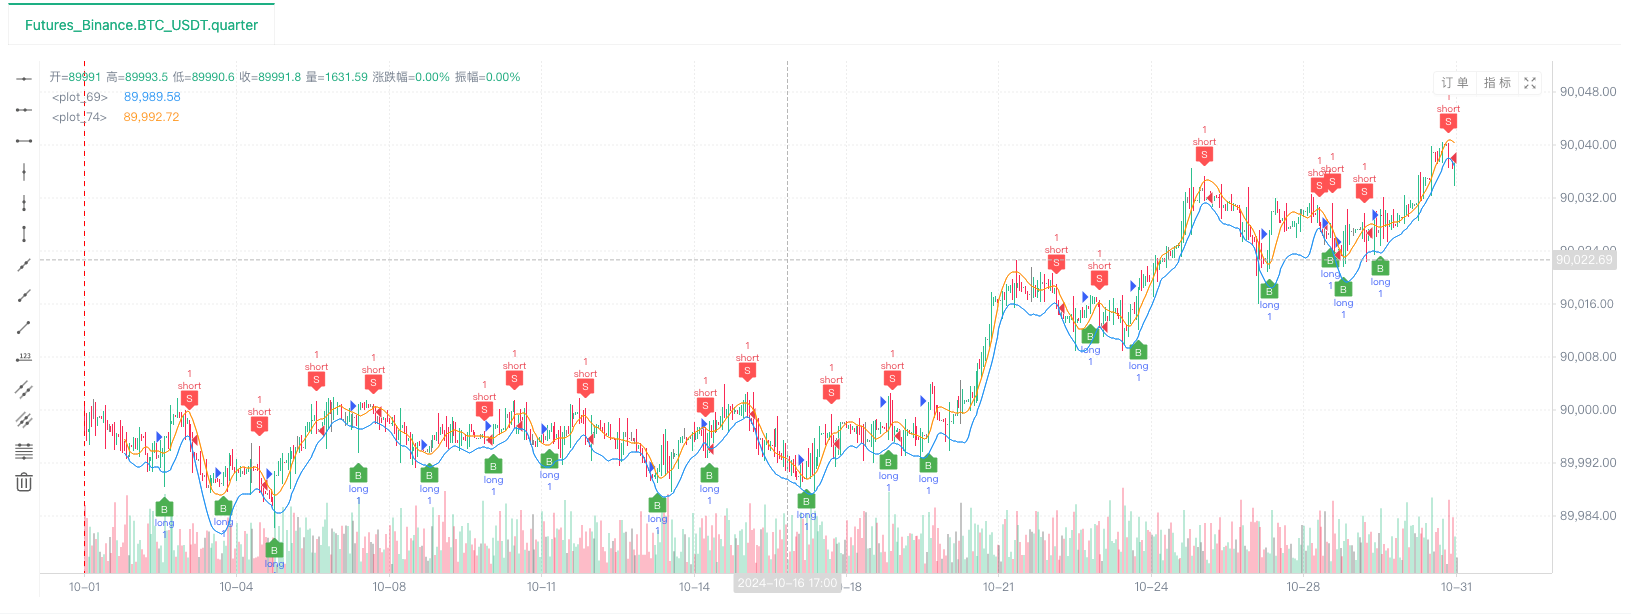
- Sau khi hệ thống backtest thiết lập nguồn dữ liệu, chúng ta có thể kiểm tra dữ liệu thị trường ngẫu nhiên:


Tại thời điểm này, hệ thống backtest được thử nghiệm với dữ liệu mô phỏng
- Oh, vâng, tôi gần như quên đề cập đến nó! lý do tại sao chương trình Python của random ticker generator tạo ra một giao dịch trực tiếp là để tạo thuận lợi cho việc chứng minh, vận hành và hiển thị dữ liệu K-line được tạo ra.
Mã nguồn chiến lược:Hệ thống kiểm tra lại Random Ticker Generator
Cảm ơn vì đã ủng hộ và đọc.
- DEX giao dịch định lượng thực hành ((1) -- dYdX v4 hướng dẫn sử dụng
- Giới thiệu về bộ phận Lead-Lag trong tiền kỹ thuật số (3)
- Giới thiệu về Trọng tài Lead-Lag trong Cryptocurrency (2)
- Giới thiệu về bộ phận Lead-Lag trong tiền kỹ thuật số (2)
- Thảo luận về tiếp nhận tín hiệu bên ngoài của nền tảng FMZ: Một giải pháp hoàn chỉnh để tiếp nhận tín hiệu với dịch vụ Http tích hợp trong chiến lược
- Phân tích nhận tín hiệu bên ngoài nền tảng FMZ: Chiến lược xây dựng dịch vụ HTTP để nhận tín hiệu
- Giới thiệu về Trọng tài Lead-Lag trong Cryptocurrency (1)
- Giới thiệu về bộ phận Lead-Lag trong tiền kỹ thuật số (1)
- Cuộc thảo luận về tiếp nhận tín hiệu bên ngoài của nền tảng FMZ: API mở rộng VS Chiến lược Dịch vụ HTTP tích hợp
- Phân tích nhận tín hiệu bên ngoài nền tảng FMZ: API mở rộng vs chiến lược dịch vụ HTTP tích hợp
- Khám phá phương pháp thử nghiệm chiến lược dựa trên trình tạo thị trường ngẫu nhiên
- Tính năng mới của FMZ Quant: Sử dụng chức năng _Serve để tạo dịch vụ HTTP dễ dàng
- Các nhà phát minh định lượng tính năng mới: dễ dàng tạo dịch vụ HTTP bằng chức năng _Serve
- FMZ Quant Trading Platform Hướng dẫn truy cập giao thức tùy chỉnh
- Chiến lược mua lại và theo dõi tỷ lệ tài trợ FMZ
- Chiến lược tiếp cận và giám sát tỷ lệ vốn FMZ
- Một mẫu chiến lược cho phép bạn sử dụng WebSocket Market liền mạch
- Một mẫu chính sách cho phép bạn sử dụng WebSocket một cách liền mạch
- Hướng dẫn truy cập vào giao dịch định lượng của nhà phát minh
- Làm thế nào để xây dựng một chiến lược giao dịch đa tiền tệ phổ quát nhanh chóng sau khi nâng cấp FMZ