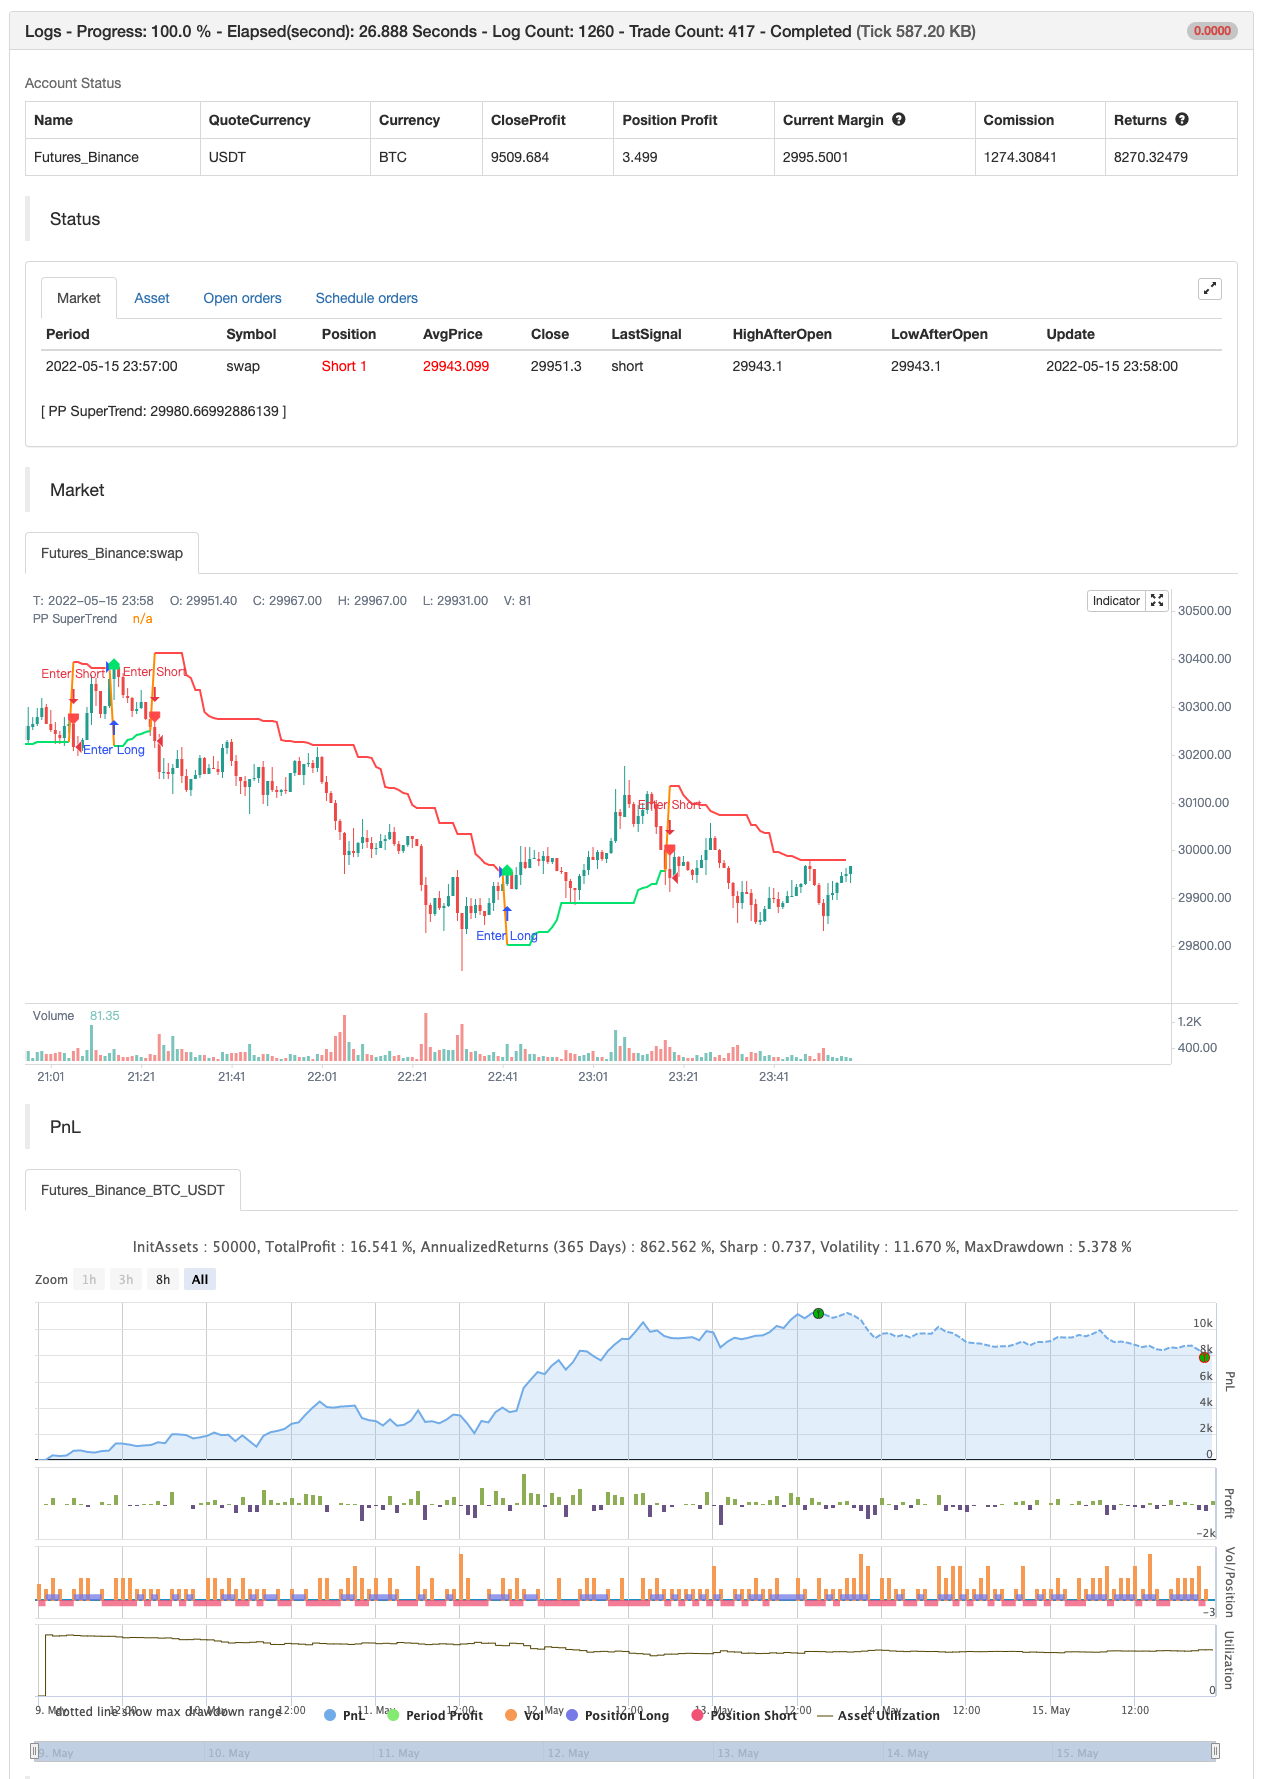
Điểm trung tâm siêu xu hướng
Tác giả:ChaoZhang, Ngày: 2022-05-17 15:45:37Tags:TrụcATR
Xin chào mọi người.
Có rất nhiều loại siêu xu hướng xung quanh. gần đây tôi đã nghĩ về một siêu xu hướng dựa trên điểm trục sau đó tôi đã viết kịch bản
Ý tưởng đằng sau kịch bản này là tìm điểm pivot, tính toán trung bình của chúng và giống như trong siêu xu hướng tạo các băng tần cao hơn / thấp hơn bởi ATR. Như bạn có thể thấy trong thuật toán kịch bản cho trọng lượng cho các điểm pivot quá khứ, điều này được thực hiện để làm mịn nó một chút.
backtest

/*backtest
start: 2022-05-09 00:00:00
end: 2022-05-15 23:59:00
period: 1m
basePeriod: 1m
exchanges: [{"eid":"Futures_Binance","currency":"BTC_USDT"}]
*/

// This source code is subject to the terms of the Mozilla Public License 2.0 at https://mozilla.org/MPL/2.0/
// © LonesomeTheBlue

//@version=4
study("Pivot Point SuperTrend", overlay = true)
prd = input(defval = 3, title="Pivot Point Period", minval = 1, maxval = 50)
Factor=input(defval = 2, title = "ATR Factor", minval = 1, step = 0.1)
Pd=input(defval = 6, title = "ATR Period", minval=1)
showpivot = input(defval = false, title="Show Pivot Points")
showlabel = input(defval = true, title="Show Buy/Sell Labels")
showcl = input(defval = false, title="Show PP Center Line")
showsr = input(defval = false, title="Show Support/Resistance")

// get Pivot High/Low
float ph = pivothigh(prd, prd)
float pl = pivotlow(prd, prd)

// drawl Pivot Points if "showpivot" is enabled
plotshape(ph and showpivot, text="H",  style=shape.labeldown, color=na, textcolor=color.red, location=location.abovebar, transp=0, offset = -prd)
plotshape(pl and showpivot, text="L",  style=shape.labeldown, color=na, textcolor=color.lime, location=location.belowbar, transp=0, offset = -prd)

// calculate the Center line using pivot points
var float center = na
float lastpp = ph ? ph : pl ? pl : na
if lastpp
    if na(center)
        center := lastpp
    else
        //weighted calculation
        center := (center * 2 + lastpp) / 3

// upper/lower bands calculation
Up = center - (Factor * atr(Pd))
Dn = center + (Factor * atr(Pd))

// get the trend
float TUp = na
float TDown = na
Trend = 0
TUp := close[1] > TUp[1] ? max(Up, TUp[1]) : Up
TDown := close[1] < TDown[1] ? min(Dn, TDown[1]) : Dn
Trend := close > TDown[1] ? 1: close < TUp[1]? -1: nz(Trend[1], 1)
Trailingsl = Trend == 1 ? TUp : TDown

// plot the trend
linecolor = Trend == 1 and nz(Trend[1]) == 1 ? color.lime : Trend == -1 and nz(Trend[1]) == -1 ? color.red : na
plot(Trailingsl, color = linecolor ,  linewidth = 2, title = "PP SuperTrend")

plot(showcl ? center : na, color = showcl ? center < hl2 ? color.blue : color.red : na)

// check and plot the signals
bsignal = Trend == 1 and Trend[1] == -1
ssignal = Trend == -1 and Trend[1] == 1
plotshape(bsignal and showlabel ? Trailingsl : na, title="Buy", text="Buy", location = location.absolute, style = shape.labelup, size = size.tiny, color = color.lime, textcolor = color.black, transp = 0)
plotshape(ssignal and showlabel ? Trailingsl : na, title="Sell", text="Sell", location = location.absolute, style = shape.labeldown, size = size.tiny, color = color.red, textcolor = color.white, transp = 0)

//get S/R levels using Pivot Points
float resistance = na
float support = na
support := pl ? pl : support[1]
resistance := ph ? ph : resistance[1]

// if enabled then show S/R levels
plot(showsr and support ? support : na, color = showsr and support ? color.lime : na, style = plot.style_circles, offset = -prd)
plot(showsr and resistance ? resistance : na, color = showsr and resistance ? color.red : na, style = plot.style_circles, offset = -prd)

// alerts
alertcondition(Trend == 1 and Trend[1] == -1, title='Buy Signal', message='Buy Signal')
alertcondition(Trend == -1 and Trend[1] == 1, title='Sell Signal', message='Sell Signal')
alertcondition(change(Trend), title='Trend Changed', message='Trend Changed')


if Trend == 1 and Trend[1] == -1
    strategy.entry("Enter Long", strategy.long)
else if Trend == -1 and Trend[1] == 1
    strategy.entry("Enter Short", strategy.short)
Nội dung liên quan
- Đường trục hỗ trợ và kháng cự tự điều chỉnh chiến lược giao dịch định lượng
- Chiến lược siêu xu hướng Villa Dynamic Pivot
- Chiến lược giao dịch trong phạm vi biến động dựa trên các chỉ số dao động ngẫu nhiên
- Chiến lược theo dõi xu hướng động
- Chiến lược quản lý vị trí và lựa chọn động dựa trên tỷ lệ biến động
- SUPERTREND theo dõi xu hướng chiến lược ngăn chặn và ngăn chặn nhiều đầu
- Tiến trình Fibonacci với các đoạn phá vỡ
- Máy xay
- Cửa ra đèn chùm
- HalfTrend theo dõi xu hướng không có gì để mua chiến lược hạn chế dừng lỗ
Nhiều hơn nữa
- Tỷ lệ năng lượng hướng tăng tốc theo khối lượng RedK
- Donchian Breakout không sơn lại
- RedK Momentum Bars
- SuperJump quay lại Bollinger Band
- Xu hướng Fukuiz
- Bốt của Johnny.
- SSL lai
- Cửa ra đèn chùm
- RISOTTO
- Chiến lược trong ngày của EMA
- Supertrend+4 chuyển động
- ZigZag dựa trên động lượng
- VuManChu Cipher B + Divergences chiến lược
- Khái niệm Dual SuperTrend
- Super Scalper
- Kiểm tra ngược - Chỉ số
- Trendycious
- Sma BTC killer
- Mẫu cảnh báo ML
- Tiến trình Fibonacci với các đoạn phá vỡ