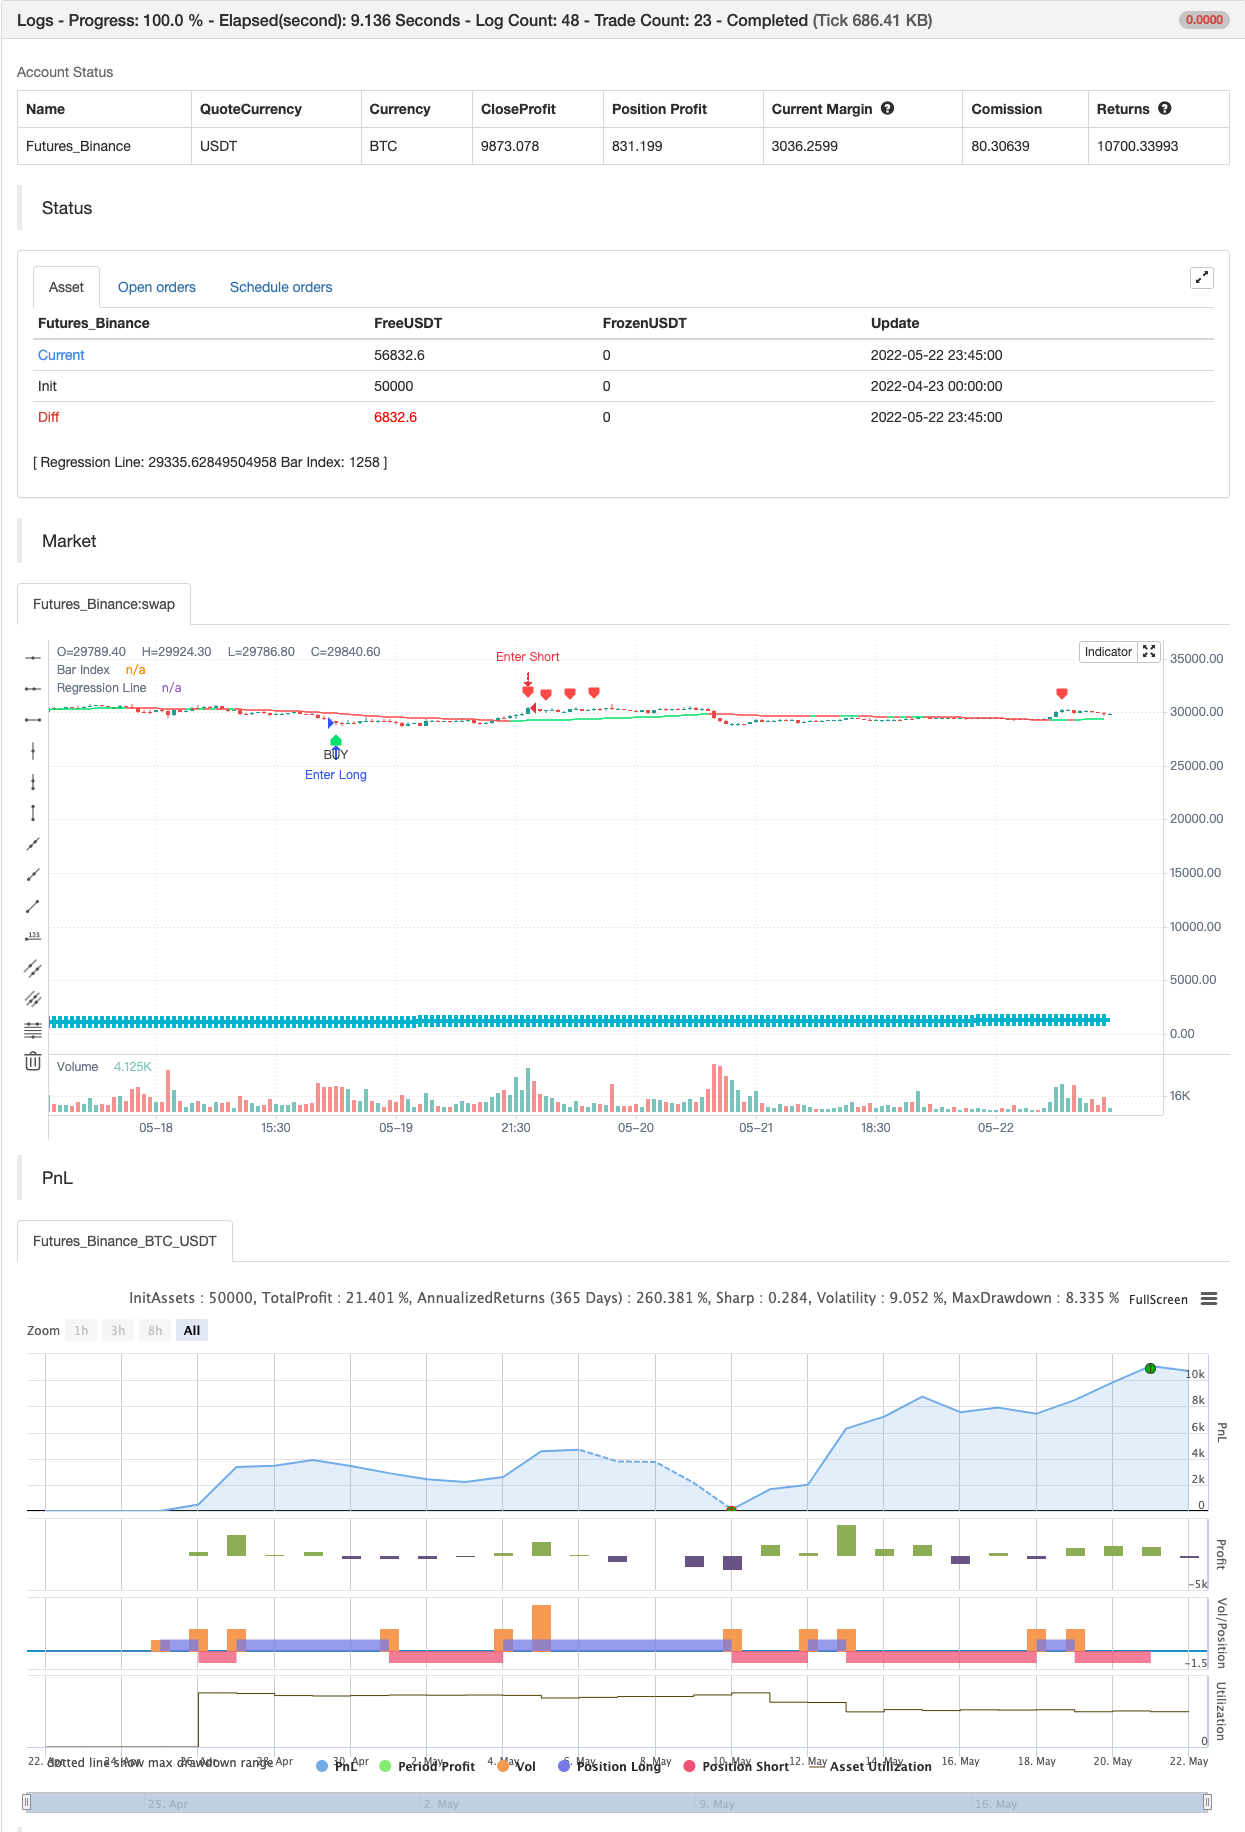
Phục hồi tuyến tính ++
Tác giả:ChaoZhang, Ngày: 2022-05-24 14:17:42Tags:DEV
EU cho nhu cầu công chúng
Công thức hồi quy tuyến tính Tính toán bị xóa với cảnh báo
Đây là kịch bản hồi quy tuyến tính cho các nhà giao dịch yêu thích các tính năng phong phú
Đặc điểm ++ Multi khung thời gian -> Nguồn hồi quy từ biểu đồ khác nhau ++ Màu sắc tùy chỉnh -> Điều này bao gồm các đường thông ++ Smoothing -> Allow Filtered Regression; Lưu ý: Sử dụng 1 Defaults cho dòng gốc. + + Các cảnh báo về kênh / phạm vi vượt qua
Sử dụng ++ Sử dụng điều này cho BreakOuts và Reversals ++ Script này không được sử dụng độc lập
Rủi ro Xin lưu ý, kịch bản này giống như các băng Bollinger và gây ra nguy cơ rơi vào phạm vi xu hướng. Các tín hiệu có thể tiếp tục chạy theo cùng một hướng trong khi thị trường đang đảo ngược.
Yêu cầu Nếu bạn có bất kỳ yêu cầu về tính năng nào, hãy bình luận dưới đây hoặc gửi email cho tôi. Tôi sẽ trả lời khi tôi có thể. Hãy tự do sử dụng điều này trên biểu đồ của bạn và chia sẻ ý tưởng của bạn
Đối với các nhà phát triển muốn sử dụng điều này trên biểu đồ của họ, Vui lòng sử dụng kịch bản này Công thức tính toán ban đầu được đăng ở đó
Ước gì các bạn thích nó.
backtest

/*backtest
start: 2022-04-23 00:00:00
end: 2022-05-22 23:59:00
period: 45m
basePeriod: 5m
exchanges: [{"eid":"Futures_Binance","currency":"BTC_USDT"}]
*/

// This source code is subject to the terms of the Mozilla Public License 2.0 at https://mozilla.org/MPL/2.0/
// © LucemAnb
// User Version

//@version=4
study("Linear Regression ++ [Lucem Anb]", "Lin Reg ++ [Lucem Anb]", overlay=true)


source      = input(close)
length      = input(100, minval=1)
offset      = input(0, minval=0)
dev         = input(2.0, "Deviation")
smoothing   = input(1, minval=1)
mtf_val     = input("", "Resolution", input.resolution)
line_thick  = input(4, "S&R Thickness", minval=1, maxval=4)
signals     = input("Recent", "Signals Display", options=["Recent", "All"])
p           = input("Lime", "Up Color", options=["Red", "Lime", "Orange", "Teal", "Yellow", "White", "Black"])
q           = input("Red", "Down Color", options=["Red", "Lime", "Orange", "Teal", "Yellow", "White", "Black"])
goto        = input(0, "End At Bar Index")

cc(x) => x=="Red"?color.red:x=="Lime"?color.lime:x=="Orange"?color.orange:x=="Teal"?
 color.teal:x=="Yellow"?color.yellow:x=="Black"?color.black:color.white
data(x) => sma(security(syminfo.tickerid, mtf_val!="" ? mtf_val : timeframe.period, x), smoothing)

linreg = data(linreg(source, length, offset))
linreg_p = data(linreg(source, length, offset+1))
plot(linreg, "Regression Line", cc(linreg>linreg[1]?p:q), editable=false)

x = bar_index
slope = linreg - linreg_p
intercept = linreg - x*slope
deviationSum = 0.0
for i=0 to length-1
    deviationSum:= deviationSum + pow(source[i]-(slope*(x-i)+intercept), 2)
deviation = sqrt(deviationSum/(length))
x1 = x-length
x2 = x
y1 = slope*(x-length)+intercept
y2 = linreg

updating = goto <= 0 or x < goto


dm_current = -deviation*dev + y2
dp_current = deviation*dev + y2
buy = crossunder(close, dm_current)
sell = crossover(close, dp_current)
alertcondition(buy, "Buy Lin Reg", "Crossing On the Lower Regression Channel")
alertcondition(sell, "Sell Lin Reg", "Crossing On the Higher Regression Channel")

plotshape(buy, "BUY", shape.labelup, location.belowbar, color.lime, text='BUY', textcolor=color.black, show_last=signals=="All"?99999999:length)
plotshape(sell, "SELL", shape.labeldown, location.abovebar, color.red, text='SELL', textcolor=color.white, show_last=signals=="All"?99999999:length)

plot(x, "Bar Index", color.aqua, line_thick, plot.style_cross, display=display.none)

if buy
    strategy.entry("Enter Long", strategy.long)
else if sell
    strategy.entry("Enter Short", strategy.short)
- Chiến lược quay trở lại giá trị trung bình
- DEV Trading Strategy dựa trên tỷ lệ biến động của chỉ số RSI tương đối mạnh yếu và SMA di chuyển
- Máy phát hiện đỉnh
- siêu xu hướng B
- Scalping Swing Trading Tool R1-4
- Chiến lược ngập + thoát tốt nhất
- Bollinger Awesome Alert R1
- Plugin đồng bộ đa sàn giao dịch
- Triangle Leverage (Lợi nhuận từ giá giao dịch của các đồng tiền nhỏ)
- bybit Reverse Contract Dynamic Grid (Mạng lưới đặc biệt)
- TradingView Alerts cho MT4 MT5 + biến động động
- Dòng ma trận
- Super Scalper - 5 phút 15 phút
- Chỉ số sức mạnh tương đối - Sự khác biệt - Libertus
- RedK Dual VADER với thanh năng lượng
- Khu vực hợp nhất - Sống
- Ước tính định lượng định chất
- Cảnh báo chéo trung bình chuyển động, nhiều khung thời gian (MTF)
- MACD Reloaded STRATEGY
- Đường trung bình di chuyển siêu xu hướng
- Giao dịch ABC
- 15MIN BTCUSDTPERP BOT
- Shannon Entropy V2
- SUPERTREND ATR WITH TRAILING STOP LOSS