Tiêu chí tối đa và tối thiểu dựa trên pivot
Tác giả:ChaoZhang, Ngày: 2022-05-25 18:18:49Tags:Trục
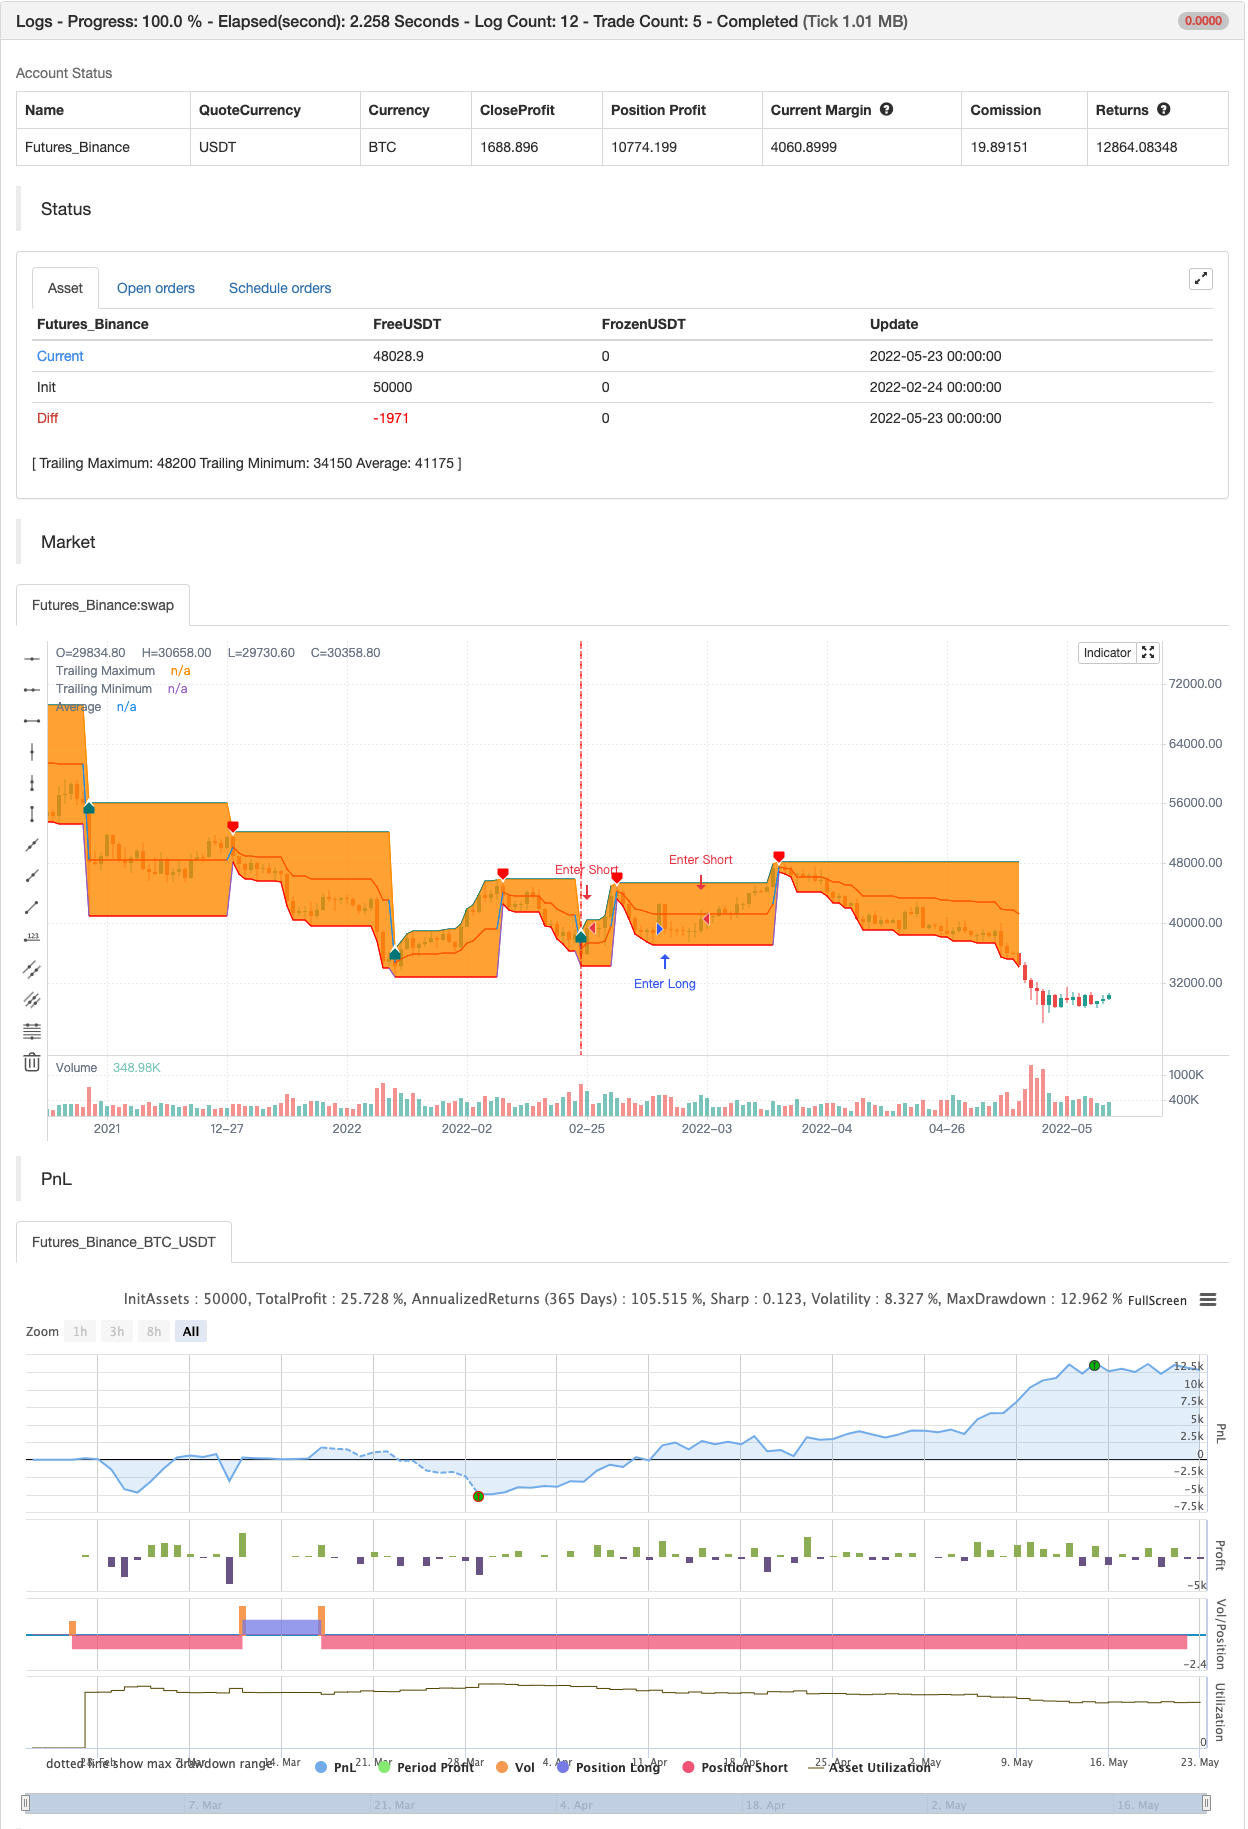
Chỉ số này trả về mức tối đa / tối thiểu và mức trung bình của chúng khi xảy ra điểm pivot cao / thấp, do đó cho phép làm nổi bật các mức hỗ trợ và kháng cự trong quá khứ và hiện tại.
Cài đặt
Chiều dài: Xác định đường quay cao / thấp, với các giá trị cao hơn cho phép phát hiện các đỉnh và đáy dài hơn.
Sử dụng
ảnh chụp
Chỉ số có thể làm nổi bật các điểm hỗ trợ và kháng cự - đây là những điểm mà giá bật khỏi đường trung bình. Những điểm này cuối cùng có thể được sử dụng để vẽ đường xu hướng.
ảnh chụp
Tối đa/tối thiểu và trung bình của chúng kéo dài đến thanh gần đây nhất, cho phép ứng dụng thời gian thực của chỉ số.
Ngoài ra, người dùng có thể dễ dàng phân tích các xu hướng trong quá khứ và xác định loại của chúng bằng cách quan sát hành vi tối đa / tối thiểu. Ví dụ, tối đa / tối thiểu không tạo ra mức cao hơn / thấp hơn mới sẽ chỉ ra thị trường dao động.
ảnh chụp
Tần suất mới cao hơn / thấp hơn cũng có thể giúp xác định xu hướng tăng / giảm như thế nào.
backtest

/*backtest
start: 2022-02-24 00:00:00
end: 2022-05-23 23:59:00
period: 1d
basePeriod: 1h
exchanges: [{"eid":"Futures_Binance","currency":"BTC_USDT"}]
*/

// This work is licensed under a Attribution-NonCommercial-ShareAlike 4.0 International (CC BY-NC-SA 4.0) https://creativecommons.org/licenses/by-nc-sa/4.0/
// © LuxAlgo

//@version=5
indicator("Pivot Based Trailing Maxima & Minima [LUX]",overlay=true,max_bars_back=500,max_lines_count=500)
length = input.int(14,minval=2,maxval=500)

max_color = input.color(color.teal,'Trailing Maximum Color',group='Style')
min_color = input.color(color.red,'Trailing Minimum Color',group='Style')
avg_color = input.color(#ff5d00,'Trailing Maximum Color',group='Style')

bull_fill = input.color(color.new(color.teal,80),'Uptrend Area',group='Style')
bear_fill = input.color(color.new(color.red,80),'Downtrend Area',group='Style')
//----
var max = 0.
var min = 0.

ph = ta.pivothigh(length,length)
pl = ta.pivotlow(length,length)

if ph or pl
    max := high[length]
    min := low[length]

max := math.max(high[length],max)
min := math.min(low[length],min)

avg = math.avg(max,min)

//----
plot1 = plot(max,'Trailing Maximum',ph or pl ? na : max_color,1,plot.style_linebr,offset=-length)
plot2 = plot(min,'Trailing Minimum',ph or pl ? na : min_color,1,plot.style_linebr,offset=-length)

fill_css = fixnan(ph ? bear_fill : pl ? bull_fill : na)
fill(plot1,plot2,ph or pl ? na : fill_css)

plot(avg,'Average',ph or pl ? na : avg_color,1,plot.style_linebr,offset=-length)

plotshape(pl ? pl : na,"Pivot High",shape.labelup,location.absolute,max_color,-length,text="▲",textcolor=color.white,size=size.tiny)
plotshape(ph ? ph : na,"Pivot Low",shape.labeldown,location.absolute,min_color,-length,text="▼",textcolor=color.white,size=size.tiny)

// //----
// n = bar_index

// max_prev = max
// min_prev = min
// avg_prev = avg
// max2 = max
// min2 = min

// if barstate.islast
//     for line_object in line.all
//         line.delete(line_object)

//     for i = 0 to length-1
//         max2 := math.max(high[length-1-i],max_prev)
//         min2 := math.min(low[length-1-i],min_prev)
//         avg2 = math.avg(max2,min2)

//         line1 = line.new(n-(length-i),max_prev,n-(length-1-i),max2,color=max_color)
//         line2 = line.new(n-(length-i),min_prev,n-(length-1-i),min2,color=min_color)
//         linefill.new(line1,line2,color.new(fill_css,80))

//         line.new(n-(length-i),avg_prev,n-(length-1-i),avg2,color=avg_color)

//         max_prev := max2
//         min_prev := min2
//         avg_prev := avg2


if pl
    strategy.entry("Enter Long", strategy.long)
else if ph
    strategy.entry("Enter Short", strategy.short)
- Chiến lược giao dịch nhiều chu kỳ thời gian kết hợp với chỉ số William
- Động lực hỗ trợ kháng cự và chiến lược giao thoa nhiều chỉ số với Brin
- Đường trục hỗ trợ và kháng cự tự điều chỉnh chiến lược giao dịch định lượng
- Chỉ số RSI Divergence
- Xu hướng chuyển động
- Sự khác biệt về khối lượng
- Điểm trung tâm siêu xu hướng
- Điểm trục cao thấp nhiều khung thời gian
- Chiến lược siêu xu hướng Villa Dynamic Pivot
- Các khối thứ tự trục trục
- 72s: Đường trung bình chuyển động thân xe thích nghi +
- Scalping EMA ADX RSI với Buy/Sell
- Sự khác biệt về khối lượng
- Super Trend Daily 2.0 BF
- Hull Moving Average Swing Trader
- FTSMA - Trend là bạn của bạn
- Range Filter Mua và bán
- Kênh SSL
- Chiến lược Hull Suite
- SAR Parabolic Mua và bán
- Nick Rypock Lái ngược (NRTR)
- ZigZag PA Chiến lược V4.1
- Mua/Bán trong ngày
- Phân đoạn bị phá vỡ: giấc mơ bị phá vỡ của ai đó là lợi nhuận của bạn!
- Tối đa hóa lợi nhuận PMax
- Chiến lược chiến thắng hoàn hảo
- Stochastic + RSI, Chiến lược đôi
- Chiến lược Swing Hull/rsi/EMA
- Scalping Swing Trading Tool R1-4
- Chiến lược ngập + thoát tốt nhất