Chiến lược siêu scalping dựa trên kênh RSI và ATR
Tác giả:ChaoZhang, Ngày: 2023-11-28 15:15:14Tags:

Chiến lược siêu scalping dựa trên RSI và kênh ATR
Tổng quan
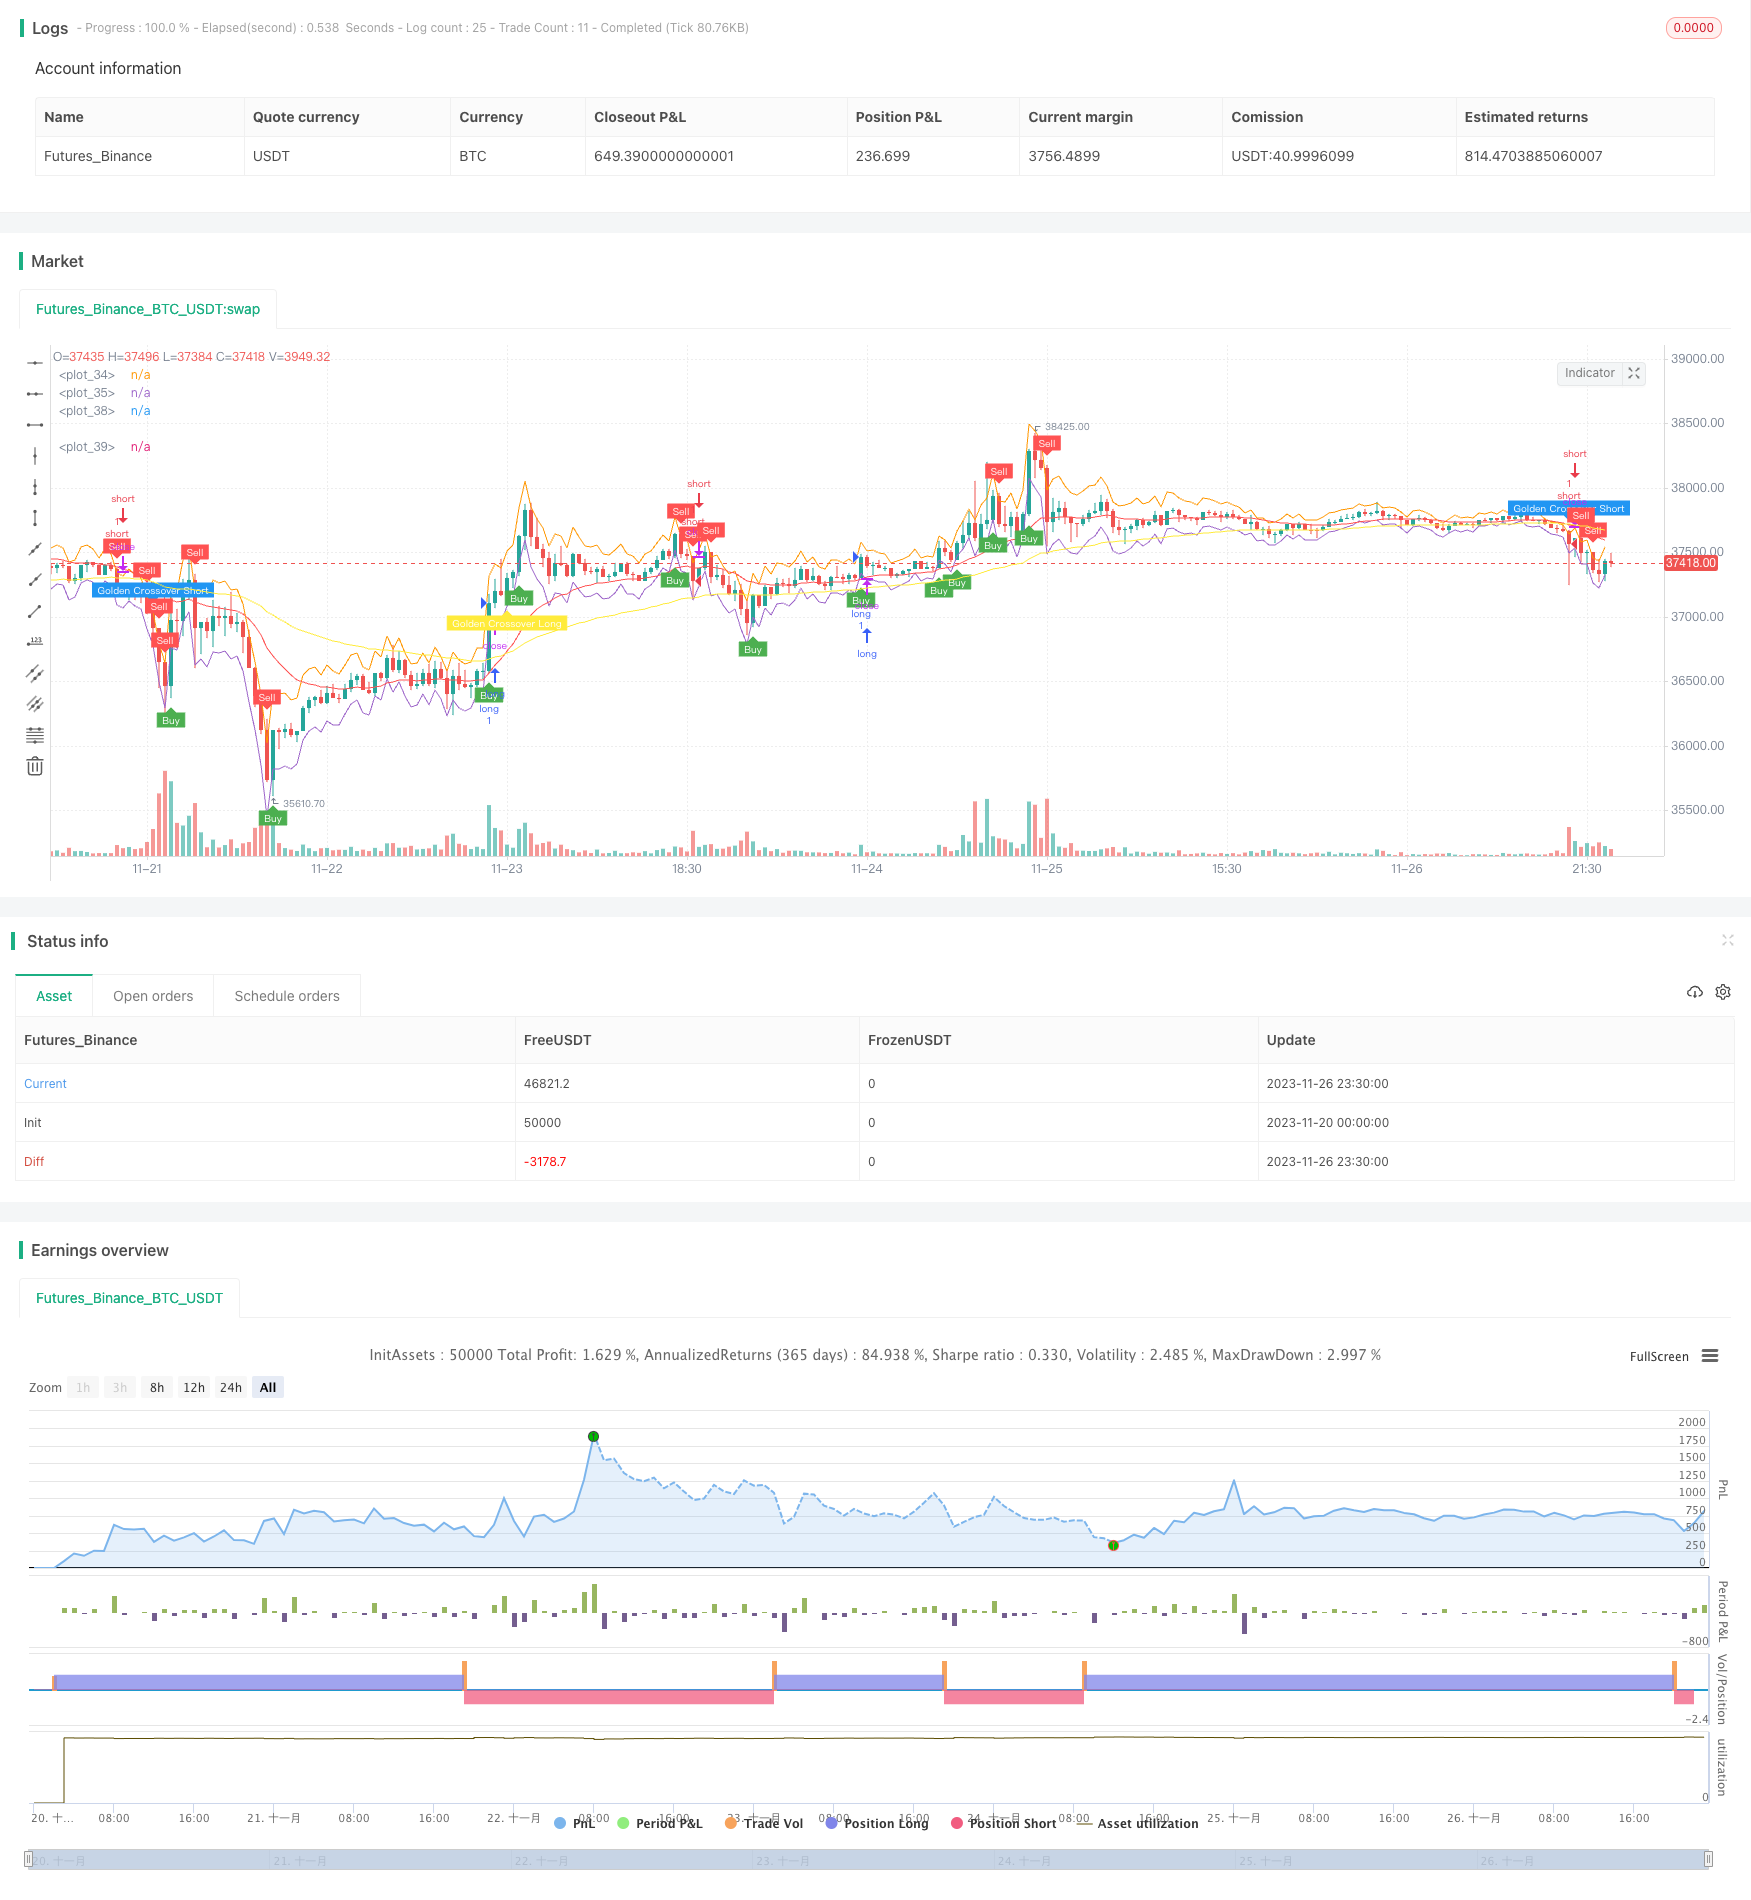
Chiến lược này dựa trên chỉ số sức mạnh tương đối (RSI) và kênh trung bình True Range (ATR), phù hợp với khung thời gian 5 phút và 15 phút, thuộc loại chiến lược siêu vỏ da. Nó xác định các điểm đầu vào hướng dài / ngắn thông qua chỉ số RSI và sử dụng kênh ATR để đặt dừng lỗ và kiếm lợi nhuận, nhận ra giao dịch tần số cao.
Nguyên tắc chiến lược
- Sử dụng đường trung bình chuyển động theo hàm số 21 ngày (EMA) và đường EMA 65 ngày để tạo thành đường chéo vàng và đường chéo chết, đánh giá hướng xu hướng chính.
- Khi chỉ số RSI dưới 50, nó giảm; khi trên 50, nó tăng, gửi ra tín hiệu mua và bán.
- Các băng tần trên và dưới của kênh ATR là: close+ATR và close-ATR. Bán khi close phá vỡ băng tần trên của ATR và mua khi nó phá vỡ băng tần dưới.
- Đặt stop loss ở mức 2 lần ATR và lấy lợi nhuận ở mức 5 lần ATR.
Phân tích lợi thế
- Sử dụng chữ thập vàng và chữ thập chết để xác định xu hướng chính, tránh giao dịch chống lại xu hướng.
- RSI có thể xác định thời điểm vào tốt hơn.
- Kênh ATR thiết lập điểm dừng lỗ và lấy lợi nhuận hiệu quả, cải thiện đáng kể tỷ lệ lợi nhuận-mất.
- Thích hợp cho giao dịch scalping tần số cao với lợi nhuận nhanh chóng.
Phân tích rủi ro
- Cần phải theo dõi thị trường chặt chẽ, nếu không việc bỏ lỡ các điểm nhập hoặc dừng lỗ có thể dẫn đến tổn thất lớn.
- Trong thị trường xu hướng, nhiều vị trí bổ sung có thể xảy ra, cần kiểm soát tốt kích thước vị trí.
- Cần đủ vốn để hỗ trợ giao dịch thường xuyên.
Hướng tối ưu hóa
- Tối ưu hóa các thông số ATR để dừng lỗ hợp lý hơn và kiếm lợi nhuận.
- Thêm các bộ lọc chỉ số khác để cải thiện chất lượng đầu vào.
- Thêm các hàm dừng tự động và lấy lợi nhuận.
- Bao gồm các mô-đun kiểm soát quản lý vốn và kích thước vị trí.
Tóm lại
Chiến lược này thuộc về loại giao dịch vỏ da tần số cao. Nó thiết lập các điểm nhập và xuất thông qua chỉ số RSI và kênh ATR để giao dịch nhanh. Những lợi thế là lợi nhuận nhanh với kiểm soát rủi ro tốt, phù hợp với giao dịch dọc theo xu hướng. Tuy nhiên, cần theo dõi thị trường chặt chẽ với đủ vốn hỗ trợ giao dịch thường xuyên. Nhìn chung, chiến lược này hoạt động tốt cho giao dịch xu hướng và có thể được cải thiện thêm về lợi nhuận thông qua tối ưu hóa.
/*backtest
start: 2023-11-20 00:00:00
end: 2023-11-27 00:00:00
period: 30m
basePeriod: 15m
exchanges: [{"eid":"Futures_Binance","currency":"BTC_USDT"}]
*/

//@version=4
strategy("Super Scalper - 5 Min 15 Min", overlay=true)

// Create Indicator's
shortSMA = ema(close, 21)
longSMA = ema(close, 65)
rsi = rsi(close, 14)
atr = atr(14)

// Specify  conditions
longCondition = open < close-atr
shortCondition = open > atr+close
GoldenLong = crossover(shortSMA,longSMA)
Goldenshort = crossover(longSMA,shortSMA)

plotshape(shortCondition, title="Sell Label", text="Sell", location=location.abovebar, style=shape.labeldown, size=size.tiny, color=color.red, textcolor=color.white, transp=0)
plotshape(longCondition, title="Buy Label", text="Buy", location=location.belowbar, style=shape.labelup, size=size.tiny, color=color.green, textcolor=color.white, transp=0)
plotshape(Goldenshort, title="Golden Sell Label", text="Golden Crossover Short", location=location.abovebar, style=shape.labeldown, size=size.tiny, color=color.blue, textcolor=color.white, transp=0)
plotshape(GoldenLong, title="Golden Buy Label", text="Golden Crossover Long", location=location.belowbar, style=shape.labelup, size=size.tiny, color=color.yellow, textcolor=color.white, transp=0)
// Execute trade if condition is True
if (longCondition)
    stopLoss = low - atr * 2
    takeProfit = high + atr * 5
    strategy.entry("long", strategy.long, 1, when = rsi > 50)


if (shortCondition)
    stopLoss = high + atr * 2
    takeProfit = low - atr * 5
    strategy.entry("short", strategy.short, 1, when = rsi < 50)


// Plot ATR bands to chart
plot(atr+close)
plot(close-atr)

// Plot Moving Averages
plot(shortSMA, color = color.red)
plot(longSMA, color = color.yellow)
- Chiến lược chỉ số động lực hàng hóa
- Chiến lược đột phá Double Turtle
- Chiến lược giao dịch định lượng dựa trên xu hướng sóng
- Chiến lược hấp thụ vàng của Ichimoku Kumo Twist
- Ngăn chặn kéo dài với chiến lược lấy lợi nhuận một phần
- Kỹ thuật theo dõi xu hướng trung bình động của TSI và CCI Hull
- Chiến lược RSI kỹ thuật ngược
- Chiến lược định lượng CCI kép
- Chiến lược thoát qua đường EMA kép
- Chiến lược MACD đa khung thời gian
- Chiến lược xu hướng Donchian
- Chiến lược chéo trung bình động đa SMA
- Chiến lược giao dịch các chỉ số RSI đa
- Chiến lược siêu xu hướng với lệnh dừng lỗ
- Chiến lược đảo ngược mức trung bình di chuyển cân nhắc
- Chiến lược chỉ số sức mạnh tương đối trung bình di chuyển
- ADX Chiến lược theo dõi xu hướng thông minh
- Chiến lược tổng hợp động lực RSI
- Chiến lược dừng lỗ theo sau dựa trên khoảng cách giá
- Chiến lược thoát trung bình di chuyển