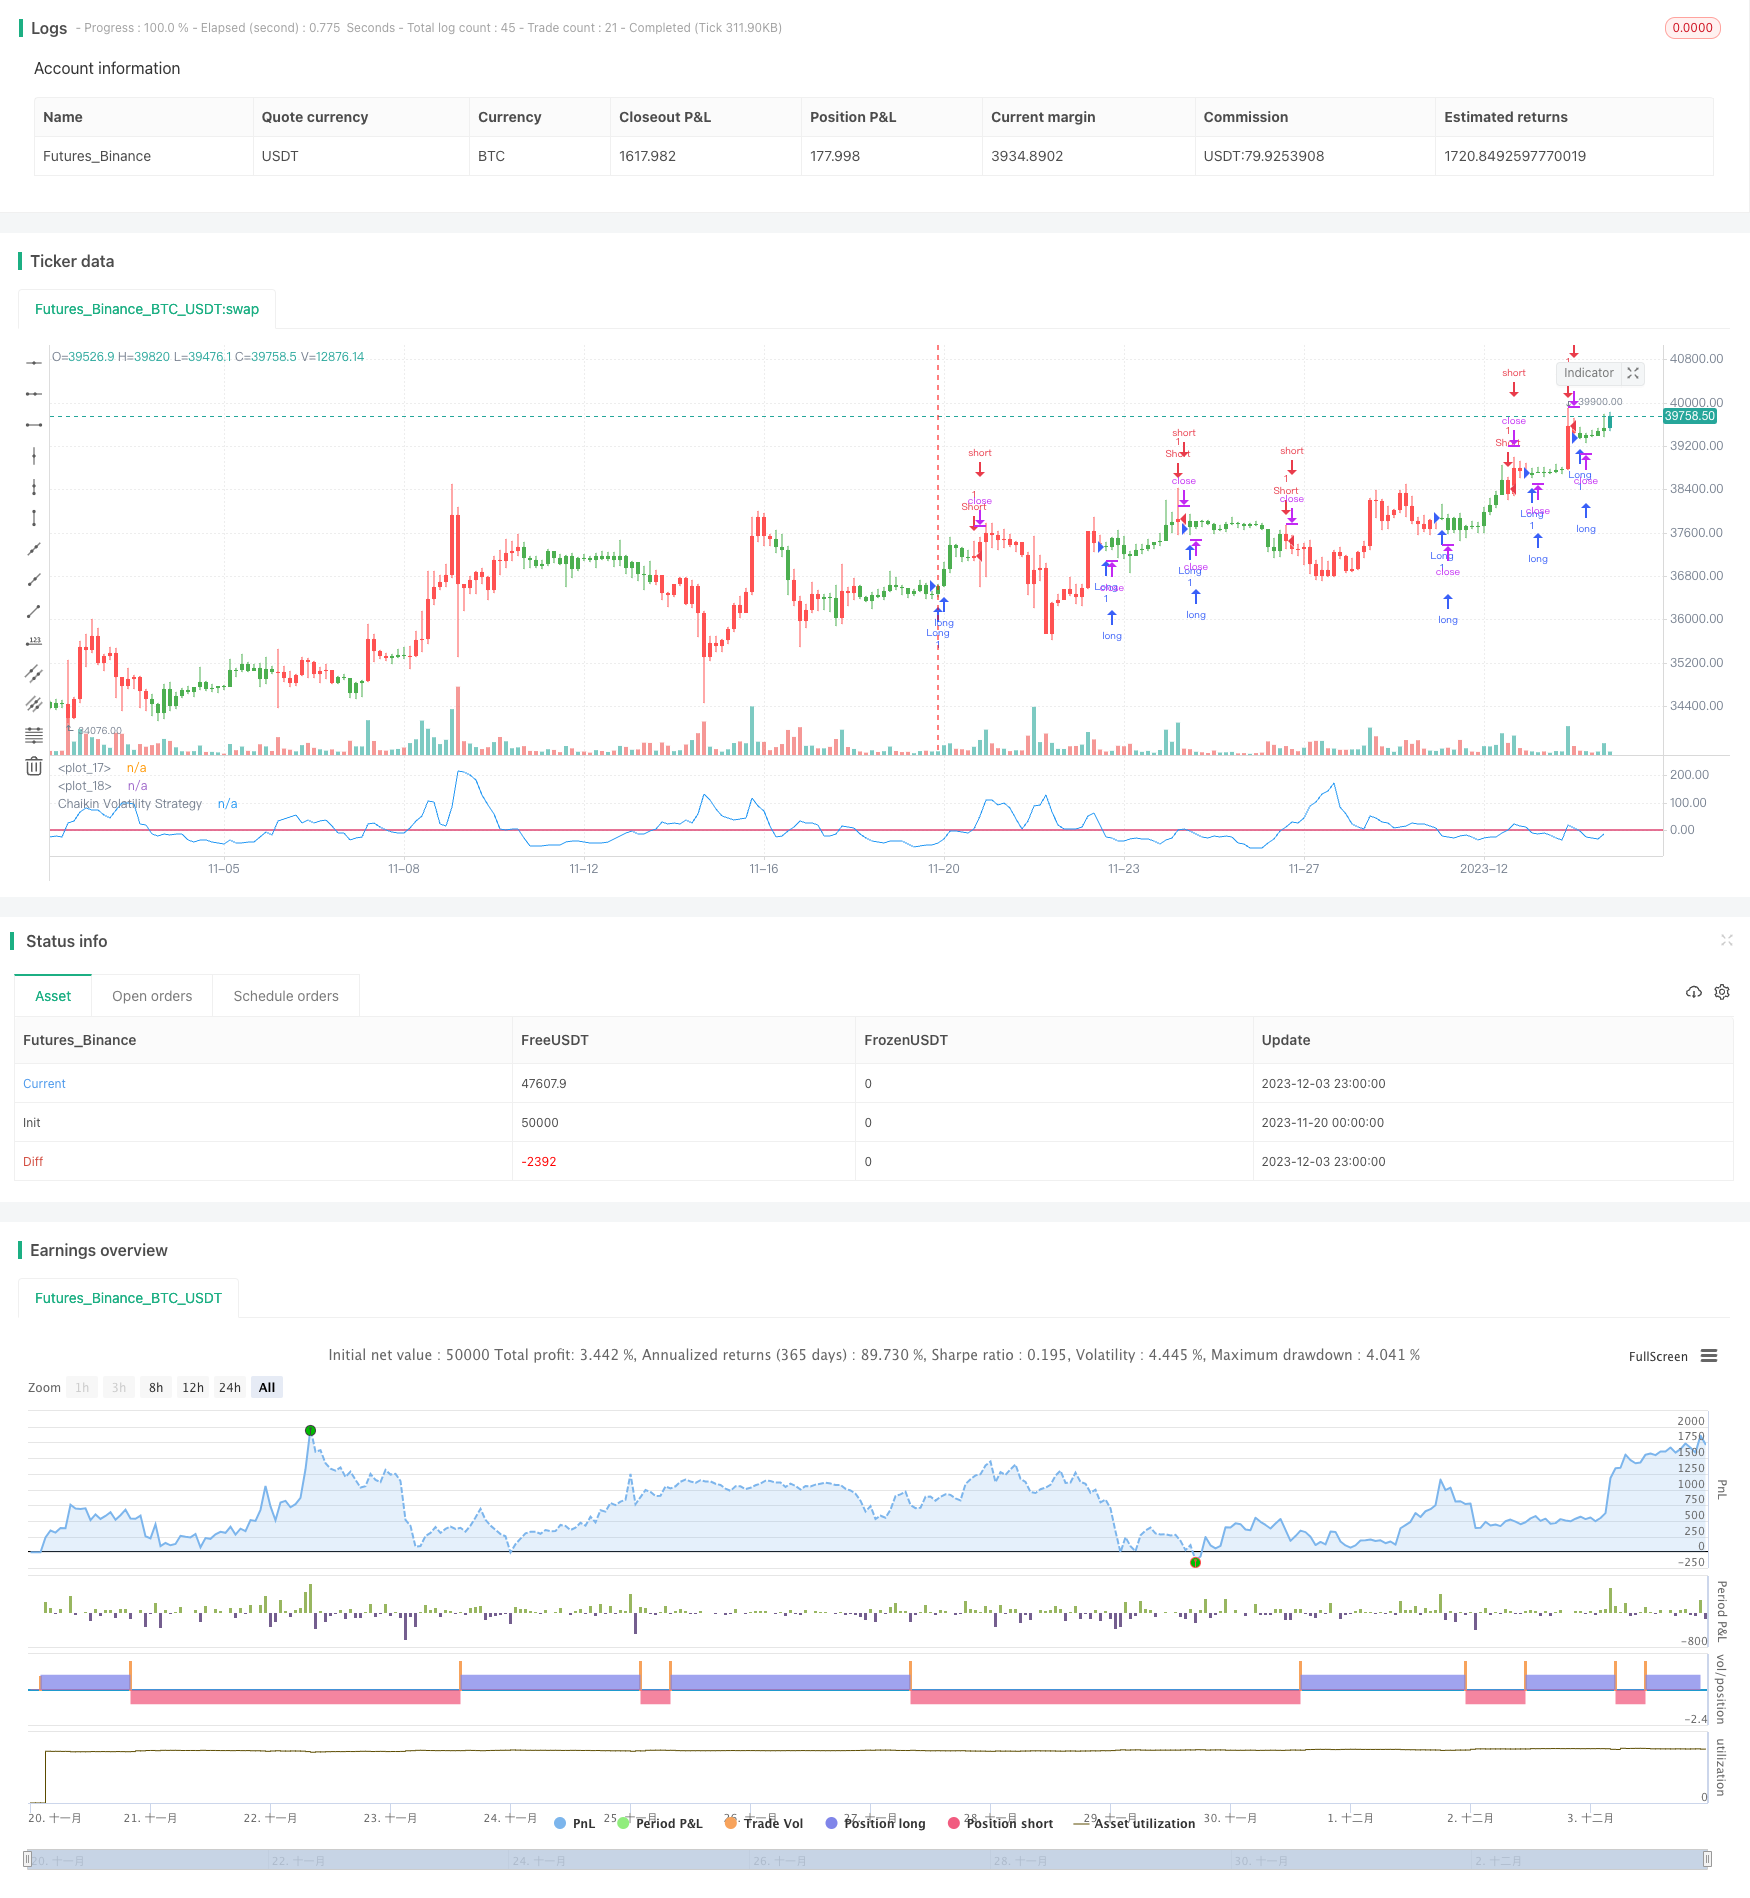
Chiến lược giao dịch ngắn hạn dựa trên chỉ số biến động Chaikin
Tác giả:ChaoZhang, Ngày: 21-12-2023 16:14:56Tags:

Tổng quan
Chiến lược này thiết kế một hệ thống giao dịch ngắn hạn dựa trên chỉ số biến động Chaikin để nắm bắt biến động thị trường ngắn hạn.
Chiến lược logic
Chỉ số biến động Chaikin định lượng biến động bằng cách đo chênh lệch giữa giá cao nhất và thấp nhất của một chứng khoán.
Lý thuyết cụ thể của chiến lược này là:
- Tính toán chỉ số biến động Chaikin (xROC_EMA)
- Thiết lập ngưỡng kích hoạt (Trigger)
- Đi dài khi xROC_EMA vượt trên Trigger; đi ngắn khi xROC_EMA vượt dưới Trigger
- Tùy chọn giao dịch theo hướng ngược
Phân tích lợi thế
Những lợi thế của chiến lược này bao gồm:
- Phản ứng nhanh, phù hợp với giao dịch ngắn hạn
- Các khoản rút tương đối nhỏ, một số hiệu ứng quản lý vốn
- Dễ thực hiện và dễ hiểu
- Điều chỉnh các tham số linh hoạt cho các môi trường thị trường khác nhau
Phân tích rủi ro
Ngoài ra còn có một số rủi ro:
- Tần suất giao dịch cao làm tăng rủi ro giao dịch quá mức
- Các thông số như Dài và Trigger có thể được trang bị quá mức
- Thâm hụt lỗ khi giao dịch đảo ngược
- Không thể lọc tiếng ồn thị trường hiệu quả, một số giao dịch sai
Giải pháp:
- Điều chỉnh các thông số để kiểm soát tần suất giao dịch
- Tối ưu hóa các thông số để ngăn ngừa quá tải
- Sử dụng các điểm dừng rộng hơn để cho phép một số giá khôi phục
- Thêm bộ lọc để giảm tín hiệu sai
Tối ưu hóa
Chiến lược có thể được cải thiện bằng cách:
- Bao gồm các chỉ số cấu trúc để xác định xu hướng và mức hỗ trợ
- Thêm bộ lọc như âm lượng và trung bình động để giảm whipsaws
- Điều chỉnh động các thông số dựa trên các điều kiện thị trường thay đổi
- Cải thiện các cơ chế dừng lỗ, ví dụ như dừng lại hoặc Chandelier Exit để khóa thêm lợi nhuận
Kết luận
Chiến lược có một logic đơn giản và rõ ràng phù hợp với giao dịch ngắn hạn. Các thông số linh hoạt có thể được điều chỉnh khi cần thiết. Rủi ro quá mức và tần suất giao dịch cao tồn tại.
/*backtest
start: 2023-11-20 00:00:00
end: 2023-12-04 00:00:00
period: 3h
basePeriod: 15m
exchanges: [{"eid":"Futures_Binance","currency":"BTC_USDT"}]
*/

//@version = 2
////////////////////////////////////////////////////////////
//  Copyright by HPotter v1.0 01/12/2016
// Chaikin's Volatility indicator compares the spread between a security's
// high and low prices. It quantifies volatility as a widening of the range
// between the high and the low price.
// You can use in the xPrice1 and xPrice2 any series: Open, High, Low, Close, HL2,
// HLC3, OHLC4 and ect...
// You can change long to short in the Input Settings
// Please, use it only for learning or paper trading. Do not for real trading.
///////////////////////////////////////////////////////////
strategy(title="Chaikin Volatility Strategy Backtest")
Length = input(10, minval=1)
ROCLength = input(12, minval=1)
Trigger = input(0, minval=1)
reverse = input(false, title="Trade reverse")
hline(0, color=purple, linestyle=line)
hline(Trigger, color=red, linestyle=line)
xPrice1 = high
xPrice2 = low
xPrice = xPrice1 - xPrice2
xROC_EMA = roc(ema(xPrice, Length), ROCLength)
pos = iff(xROC_EMA < Trigger, 1,
	   iff(xROC_EMA > Trigger, -1, nz(pos[1], 0)))
possig = iff(reverse and pos == 1, -1,
         iff(reverse and pos == -1, 1, pos))
if (possig == 1)
    strategy.entry("Long", strategy.long)
if (possig == -1)
    strategy.entry("Short", strategy.short)
barcolor(pos == -1 ? red: pos == 1 ? green : blue )
plot(xROC_EMA, color=blue, title="Chaikin Volatility Strategy")
Thêm nữa
- Chiến lược đột phá giá giao dịch định lượng
- Ehlers Fisher Stochastic Relative Vigor Index Chiến lược
- Chiến lược giao dịch thuật toán đột phá động lực kép và lọc biến động
- Chiến lược toàn diện đa trung bình động
- Chiến lược kết hợp RSI đảo ngược giá
- Cloud Nebula Dual Moving Average Breakthrough Strategy Chiến lược đột phá
- MACD Golden Cross Death Cross Xu hướng theo chiến lược
- Chiến lược theo xu hướng rùa
- Chiến lược xu hướng kênh Donchian hai lần xác nhận
- Chiến lược đảo ngược khoảnh khắc dựa trên mô hình đa yếu tố
- Chiến lược theo dõi xu hướng chéo hai MA
- Chiến lược siêu xu hướng ba
- Chiến lược dừng lỗ theo dõi động
- Chiến lược chuyển động trung bình chéo với dừng lỗ và lấy lợi nhuận
- Chiến lược đảo ngược đảo ngược trung bình dựa trên trung bình động
- Chiến lược giao dịch tần số cao dựa trên dải Bollinger
- Chiến lược giao dịch đám mây Ichimoku định lượng
- Chiến lược thúc đẩy dựa trên mô hình phá vỡ đáy kép
- Chiến lược xoắn ốc
- Chiến lược giao dịch đa thời gian dựa trên chỉ số biến động và dao động Stochastic