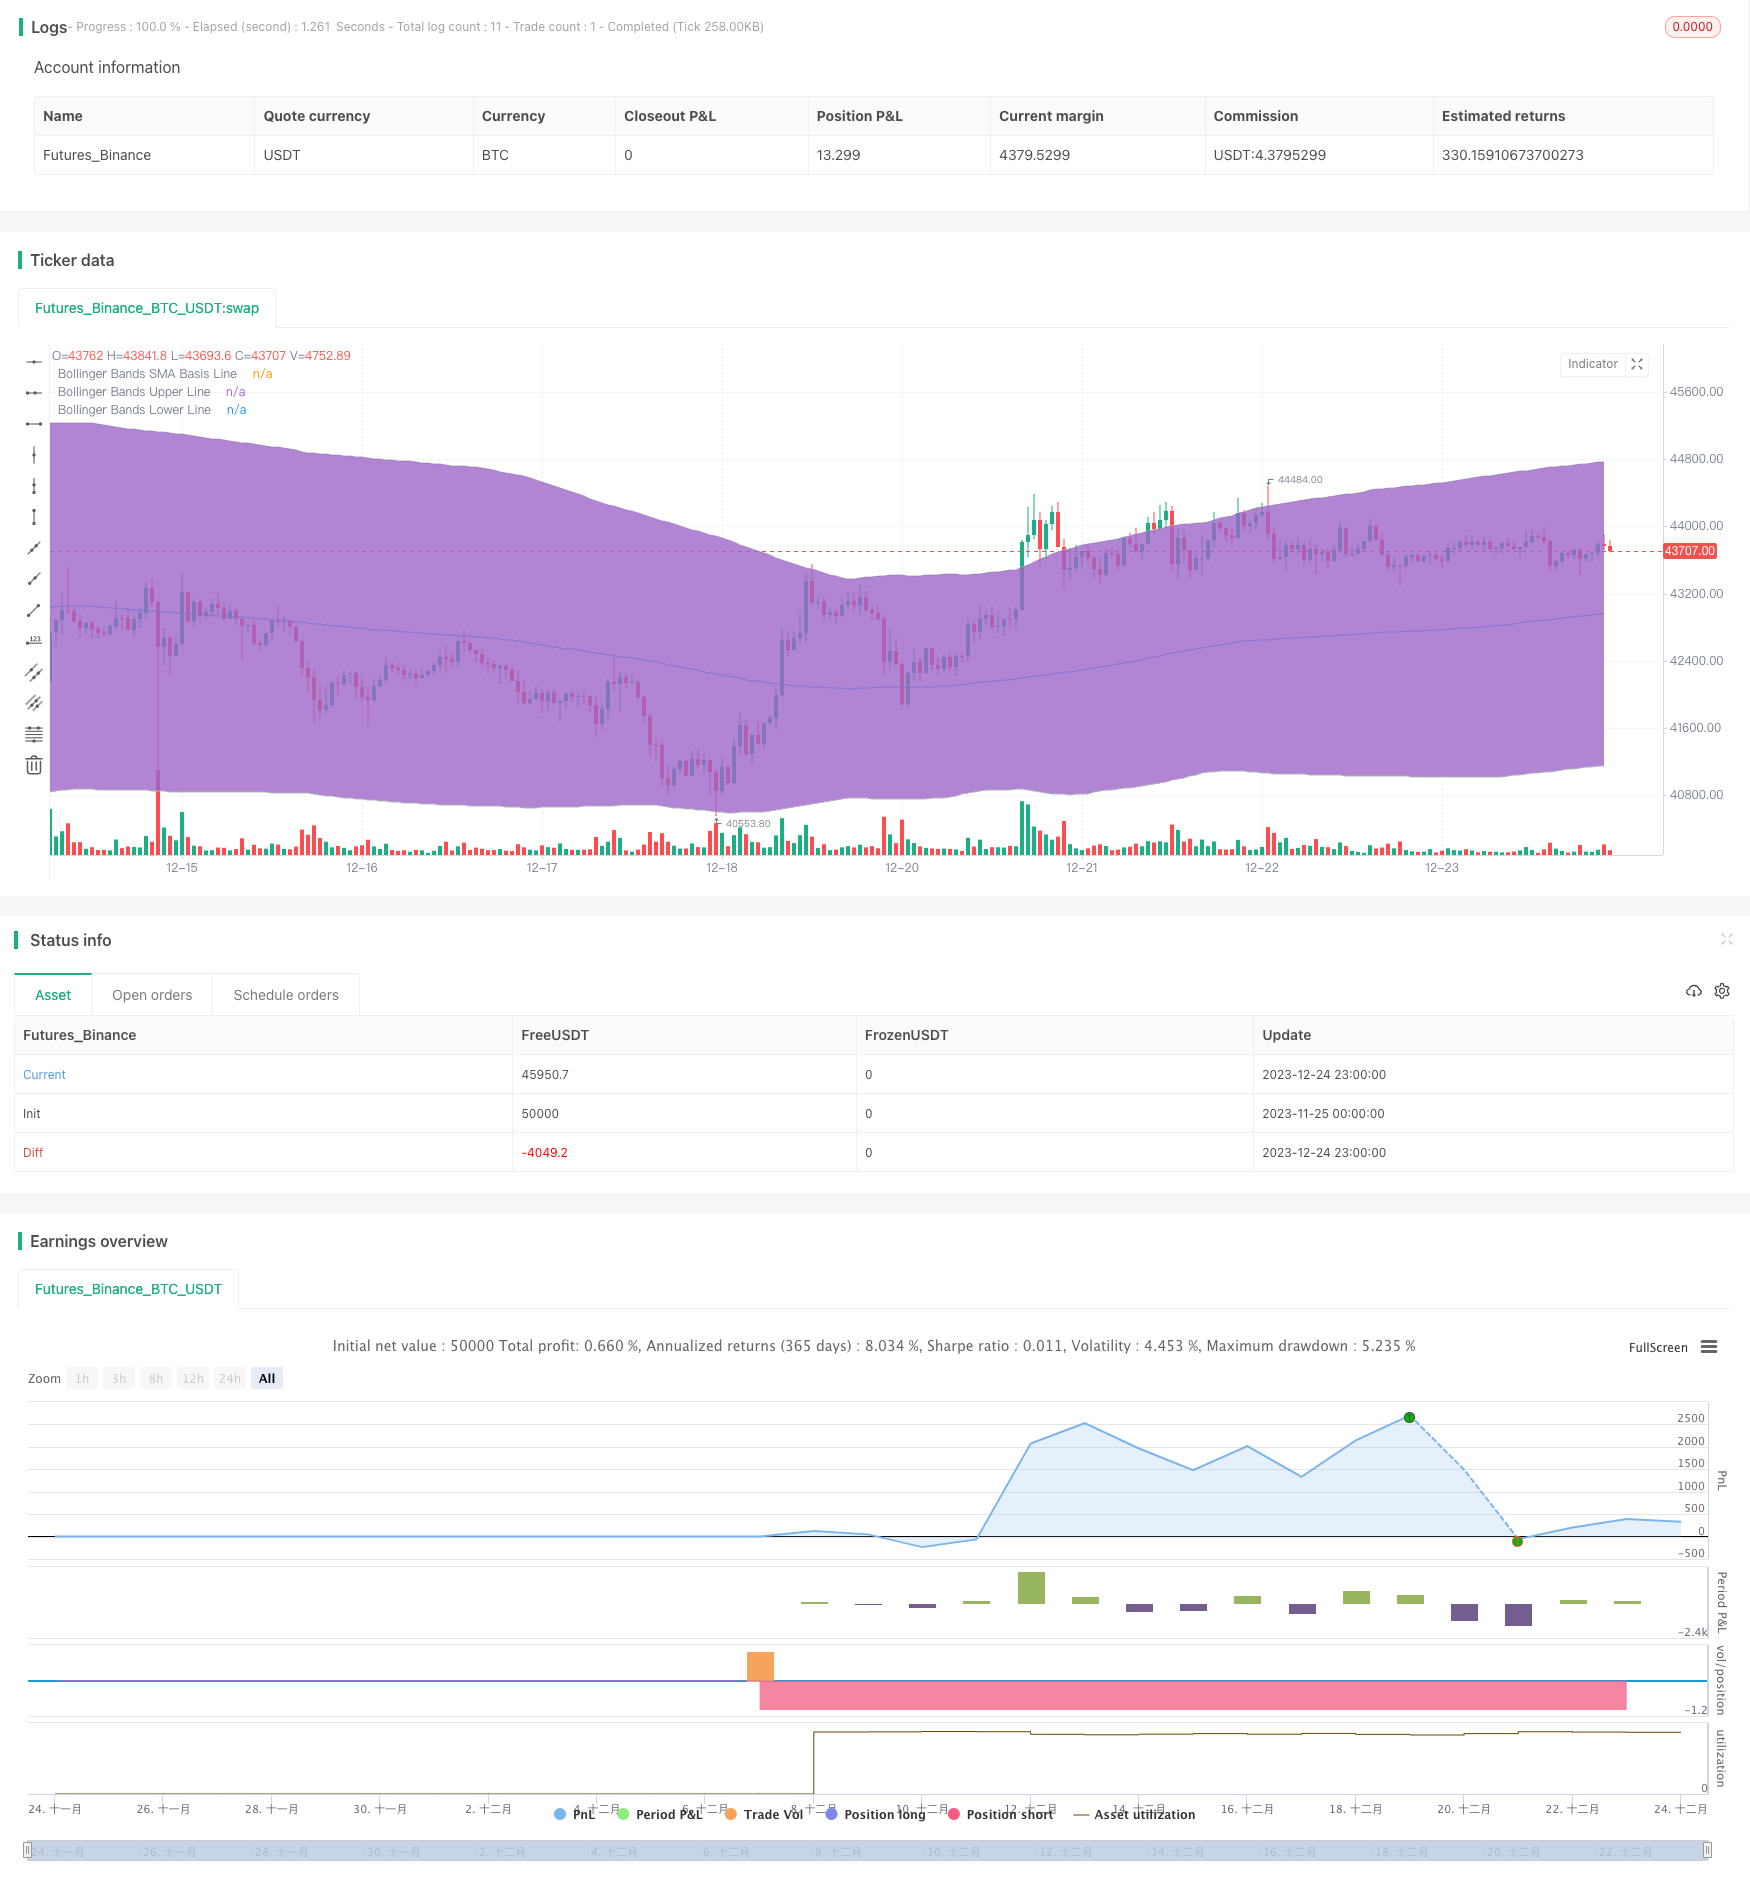
Chiến lược RSI hai đường của kênh Bollinger Band

Tổng quan
Chiến lược này kết hợp đường Brin với chỉ số tương đối mạnh (RSI) và cần phá vỡ đường Brin tương ứng để làm cho tín hiệu giao dịch của chiến lược này nghiêm ngặt và đáng tin cậy hơn.
Nguyên tắc chiến lược
- Sử dụng đường Brin, tính toán đường trung đạo, đường lên và đường xuống dựa trên giá đóng cửa trong n ngày trước.
- Tính toán chỉ số RSI để xác định thị trường có quá lạc quan hay không.
- Chỉ khi chỉ số RSI cho thấy giá quá mua (trên rsi_overbought) và giá phá vỡ đường Bollinger, giao dịch ngắn hạn.
- Chỉ khi chỉ số RSI cho thấy oversold (< tham số rsi_oversold) và giá phá vỡ đường dây dưới đường Brin, giao dịch nhiều đầu.
Bằng cách này, chiến lược này sử dụng các đặc điểm của kênh của đường Brin cùng với tín hiệu mua và bán của chỉ số RSI để tránh sai lầm trong chỉ số đơn lẻ và đáng tin cậy hơn.
Lợi thế chiến lược
- Sử dụng lợi thế của đường Brin và chỉ số RSI để đánh giá nghiêm ngặt hơn và tránh sai lầm.
- Đường Brin tạo ra một kênh động, có thể nắm bắt được quy luật biến động của thị trường.
- RSI đánh giá quá mua và quá bán để tránh theo đuổi giá cao và giá thấp.
Rủi ro chiến lược
- Nếu các tham số của đường Brin được đặt không đúng, đường ray lên xuống không thể bao gồm giá một cách hiệu quả.
- Nếu RSI được thiết lập không đúng cách, nó sẽ không có hiệu quả trong việc đánh giá tình trạng quá mua quá bán thực sự.
- Chiến lược này không thể tự mình xác định xu hướng, nó cần được kết hợp với các chỉ số khác.
Đối với các rủi ro trên, nên tối ưu hóa các tham số, kiểm tra mô hình nghiêm ngặt và đánh giá xu hướng lớn với các chỉ số khác.
Hướng tối ưu hóa chiến lược
- Kiểm tra các đường Boolean với các tham số chu kỳ khác nhau để tìm ra tham số chu kỳ tối ưu.
- Kiểm tra các tham số RSI khác nhau để xác định tham số tốt nhất.
- Các chỉ số khác như đường trung bình di chuyển có thể được thêm vào để đánh giá xu hướng tổng thể.
Tóm tắt
Chiến lược này đã kết hợp thành công lợi thế của đường Brin và chỉ số RSI, phát hành chỉ thị giao dịch khi cả hai tín hiệu xuất hiện cùng một lúc, do đó, có thể tránh hiệu quả các trường hợp chỉ số duy nhất phán đoán sai, làm cho giao dịch đáng tin cậy hơn. Đồng thời, cũng cần tối ưu hóa tham số, kiểm tra nghiêm ngặt, và hỗ trợ các chỉ số khác để đánh giá xu hướng lớn, để tăng cường sự ổn định và lợi nhuận của chiến lược.
/*backtest
start: 2023-11-25 00:00:00
end: 2023-12-25 00:00:00
period: 1h
basePeriod: 15m
exchanges: [{"eid":"Futures_Binance","currency":"BTC_USDT"}]
*/

//@version=2
strategy("Bollinger + RSI, Double Strategy (by ChartArt) v1.1", shorttitle="CA_-_RSI_Bol_Strat_1.1", overlay=true)

// ChartArt's RSI + Bollinger Bands, Double Strategy - Update
//
// Version 1.1
// Idea by ChartArt on January 18, 2015.
//
// This strategy uses the RSI indicator
// together with the Bollinger Bands
// to sell when the price is above the
// upper Bollinger Band (and to buy when
// this value is below the lower band).
//
// This simple strategy only triggers when
// both the RSI and the Bollinger Bands
// indicators are at the same time in
// a overbought or oversold condition.
//
// In this version 1.1 the strategy was
// both simplified for the user and
// made more successful in backtesting.
//
// List of my work:
// https://www.tradingview.com/u/ChartArt/
//
//  __             __  ___       __  ___
// /  ` |__|  /\  |__)  |   /\  |__)  |
// \__, |  | /~~\ |  \  |  /~~\ |  \  |
//
//


///////////// RSI
RSIlength = input(6,title="RSI Period Length")
RSIoverSold = 50
RSIoverBought = 50
price = close
vrsi = rsi(price, RSIlength)


///////////// Bollinger Bands
BBlength = input(200, minval=1,title="Bollinger Period Length")
BBmult = 2 // input(2.0, minval=0.001, maxval=50,title="Bollinger Bands Standard Deviation")
BBbasis = sma(price, BBlength)
BBdev = BBmult * stdev(price, BBlength)
BBupper = BBbasis + BBdev
BBlower = BBbasis - BBdev
source = close
buyEntry = crossover(source, BBlower)
sellEntry = crossunder(source, BBupper)
plot(BBbasis, color=aqua,title="Bollinger Bands SMA Basis Line")
p1 = plot(BBupper, color=silver,title="Bollinger Bands Upper Line")
p2 = plot(BBlower, color=silver,title="Bollinger Bands Lower Line")
fill(p1, p2)


///////////// Colors
switch1=input(true, title="Enable Bar Color?")
switch2=input(true, title="Enable Background Color?")
TrendColor = RSIoverBought and (price[1] > BBupper and price < BBupper) and BBbasis < BBbasis[1] ? red : RSIoverSold and (price[1] < BBlower and price > BBlower) and BBbasis > BBbasis[1] ? green : na
barcolor(switch1?TrendColor:na)
bgcolor(switch2?TrendColor:na,transp=50)


///////////// RSI + Bollinger Bands Strategy
if (not na(vrsi))

    if (crossover(vrsi, RSIoverSold) and crossover(source, BBlower))
        strategy.entry("RSI_BB_L", strategy.long, stop=BBlower,  comment="RSI_BB_L")
    else
        strategy.cancel(id="RSI_BB_L")

    if (crossunder(vrsi, RSIoverBought) and crossunder(source, BBupper))
        strategy.entry("RSI_BB_S", strategy.short, stop=BBupper,  comment="RSI_BB_S")
    else
        strategy.cancel(id="RSI_BB_S")

//plot(strategy.equity, title="equity", color=red, linewidth=2, style=areabr)