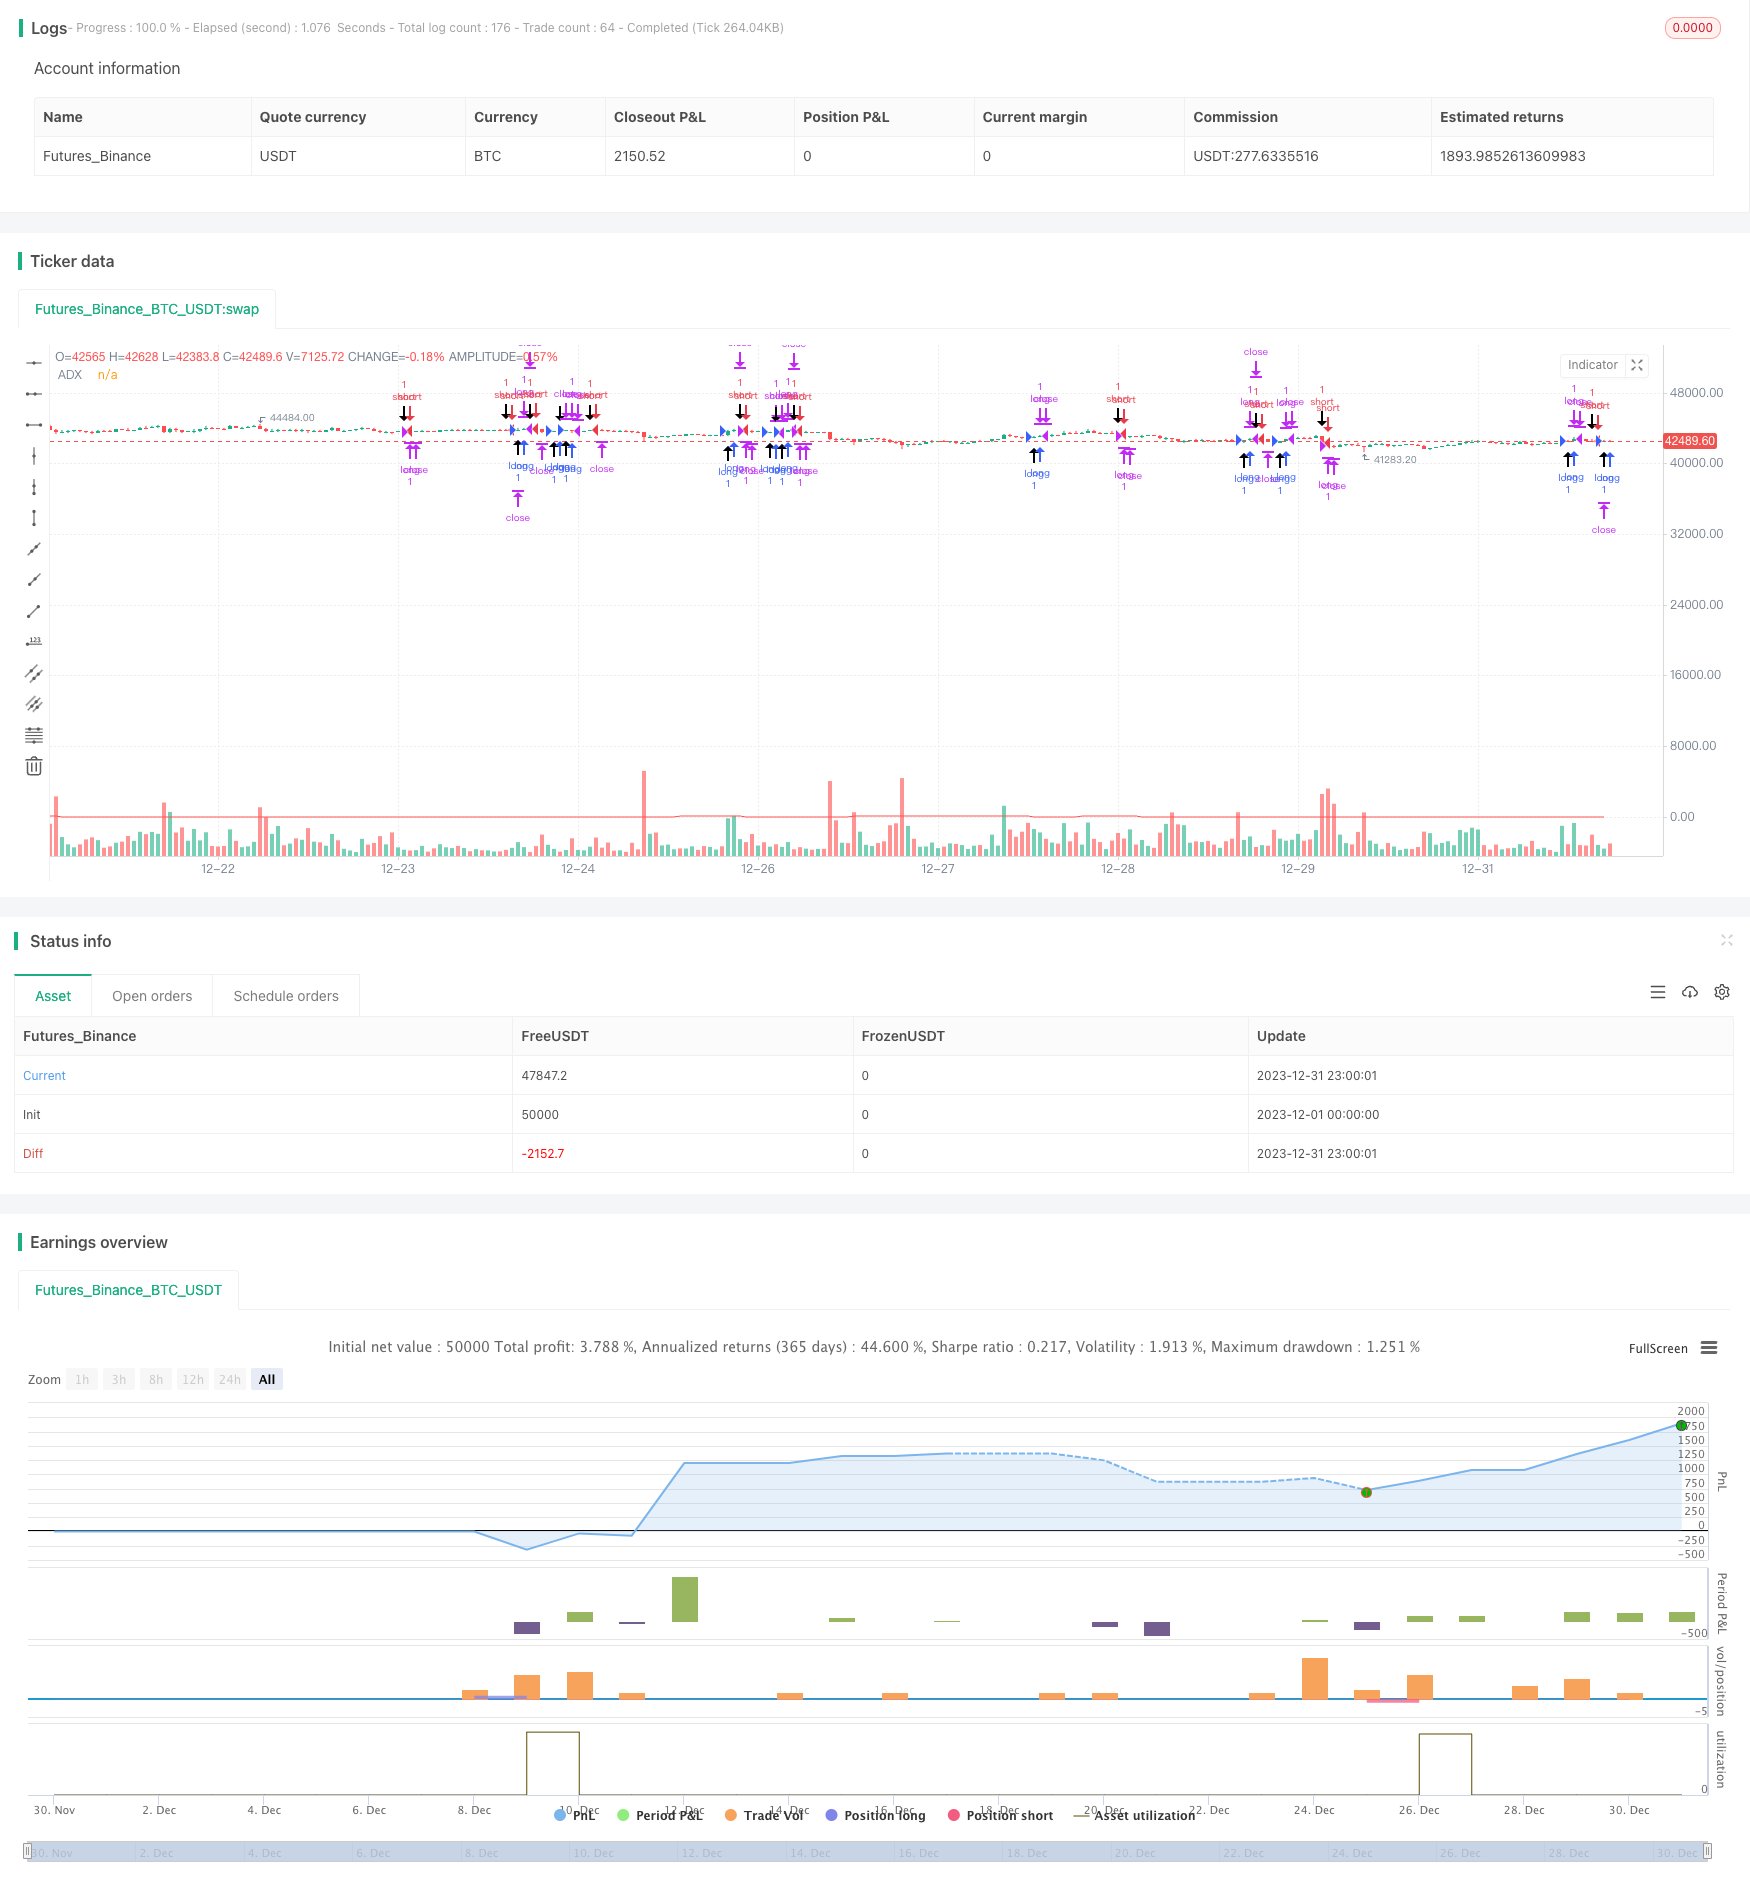
Chiến lược theo dõi xu hướng dầu thô dựa trên chỉ báo ADX
Ngày tạo:
2024-01-25 15:18:15
sửa đổi lần cuối:
2024-01-25 15:18:15
sao chép:
3
Số nhấp chuột:
670
1
tập trung vào
1628
Người theo dõi

Tổng quan
Chiến lược này dựa trên chiến lược giao dịch tương lai dầu thô miễn phí của Kevin Davey. Chiến lược này sử dụng chỉ số ADX để đánh giá xu hướng của thị trường dầu thô, kết hợp với nguyên tắc phá vỡ giá, để thực hiện một chiến lược giao dịch tự động dầu thô đơn giản và thực tế.
Nguyên tắc chiến lược
- Tính toán chỉ số ADX 14 chu kỳ
- Nếu ADX>10 thì cho rằng có xu hướng
- Nếu giá đóng cửa cao hơn giá đóng cửa trước 65 đường K, nó cho thấy giá đã phá vỡ và là tín hiệu cho vị trí dài
- Nếu giá đóng cửa thấp hơn giá đóng cửa trước 65 đường K, nó cho thấy giá đã phá vỡ và là tín hiệu ngắn
- Thiết lập dừng và dừng sau khi nhập
Chiến lược này chủ yếu dựa trên các chỉ số ADX để đánh giá xu hướng và tạo ra tín hiệu giao dịch dựa trên sự phá vỡ giá của chu kỳ cố định trong trường hợp có xu hướng. Toàn bộ logic của chiến lược rất đơn giản và rõ ràng.
Phân tích lợi thế chiến lược
- Sử dụng ADX để đánh giá xu hướng, tránh bỏ lỡ cơ hội
- Báo cáo báo cáo của CNBC cho biết: “Sự phá vỡ giá trong chu kỳ cố định đã tạo ra tín hiệu, hiệu quả đo lại tốt hơn”.
- Code trực quan, đơn giản, dễ hiểu và sửa đổi
- Kevin Davey đã chứng minh trong nhiều năm qua rằng không phù hợp với đường cong
Phân tích rủi ro chiến lược
- ADX là chỉ số chính, nhạy cảm với chọn tham số và chọn chu kỳ đột phá
- Có thể bỏ lỡ một số cơ hội để phá vỡ chu kỳ cố định
- Cài đặt lỗ hổng không đúng có thể làm tăng lỗ hổng
- Có thể có sự khác biệt giữa hiệu quả ổ cứng và phản hồi
Hướng tối ưu hóa chiến lược
- Tối ưu hóa tham số ADX và chu kỳ đột phá
- Tăng điều chỉnh động lượng nắm giữ
- Tiếp tục sửa đổi và hoàn thiện chiến lược dựa trên kết quả kiểm tra lại và xác minh thực tế
- Nhập các công nghệ học máy và học sâu để tối ưu hóa chiến lược
Tóm tắt
Chiến lược này nói chung là một chiến lược giao dịch dầu thô rất thực tế. Nó sử dụng chỉ số ADX để đánh giá xu hướng rất hợp lý, nguyên tắc phá vỡ giá đơn giản và hiệu quả.
Mã nguồn chiến lược
/*backtest
start: 2023-12-01 00:00:00
end: 2023-12-31 23:59:59
period: 1h
basePeriod: 15m
exchanges: [{"eid":"Futures_Binance","currency":"BTC_USDT"}]
*/

// Strategy idea coded from EasyLanguage to Pinescript
//@version=5
strategy("Kevin Davey Crude free crude oil strategy", shorttitle="CO Fut", format=format.price, precision=2, overlay = true, calc_on_every_tick = true)
adxlen = input(14, title="ADX Smoothing")
dilen = input(14, title="DI Length")
dirmov(len) =>
	up = ta.change(high)
	down = -ta.change(low)
	plusDM = na(up) ? na : (up > down and up > 0 ? up : 0)
	minusDM = na(down) ? na : (down > up and down > 0 ? down : 0)
	truerange = ta.rma(ta.tr, len)
	plus = fixnan(100 * ta.rma(plusDM, len) / truerange)
	minus = fixnan(100 * ta.rma(minusDM, len) / truerange)
	[plus, minus]
adx(dilen, adxlen) =>
	[plus, minus] = dirmov(dilen)
	sum = plus + minus
	adx = 100 * ta.rma(math.abs(plus - minus) / (sum == 0 ? 1 : sum), adxlen)
sig = adx(dilen, adxlen)
plot(sig, color=color.red, title="ADX")

buy = sig > 10 and (close - close[65]) > 0 and (close - close[65])[1] < 0
sell = sig > 10 and (close - close[65]) < 0 and (close - close[65])[1] > 0

plotshape(buy, style = shape.arrowup, location = location.belowbar,size = size.huge)
plotshape(sell, style = shape.arrowdown, location = location.abovebar,size = size.huge)

if buy
	strategy.entry("long", strategy.long)
if sell
	strategy.entry("short", strategy.short)

if strategy.position_size != 0
	strategy.exit("long", profit = 450, loss = 300)
	strategy.exit("short", profit = 450, loss = 300)


// GetTickValue() returns the currency value of the instrument's
// smallest possible price movement.
GetTickValue() =>
    syminfo.mintick * syminfo.pointvalue

// On the last historical bar, make a label to display the
// instrument's tick value
if barstate.islastconfirmedhistory
    label.new(x=bar_index + 1, y=close, style=label.style_label_left,
         color=color.black, textcolor=color.white, size=size.large,
         text=syminfo.ticker + " has a tick value of:\n" +
             syminfo.currency + " " + str.tostring(GetTickValue()))