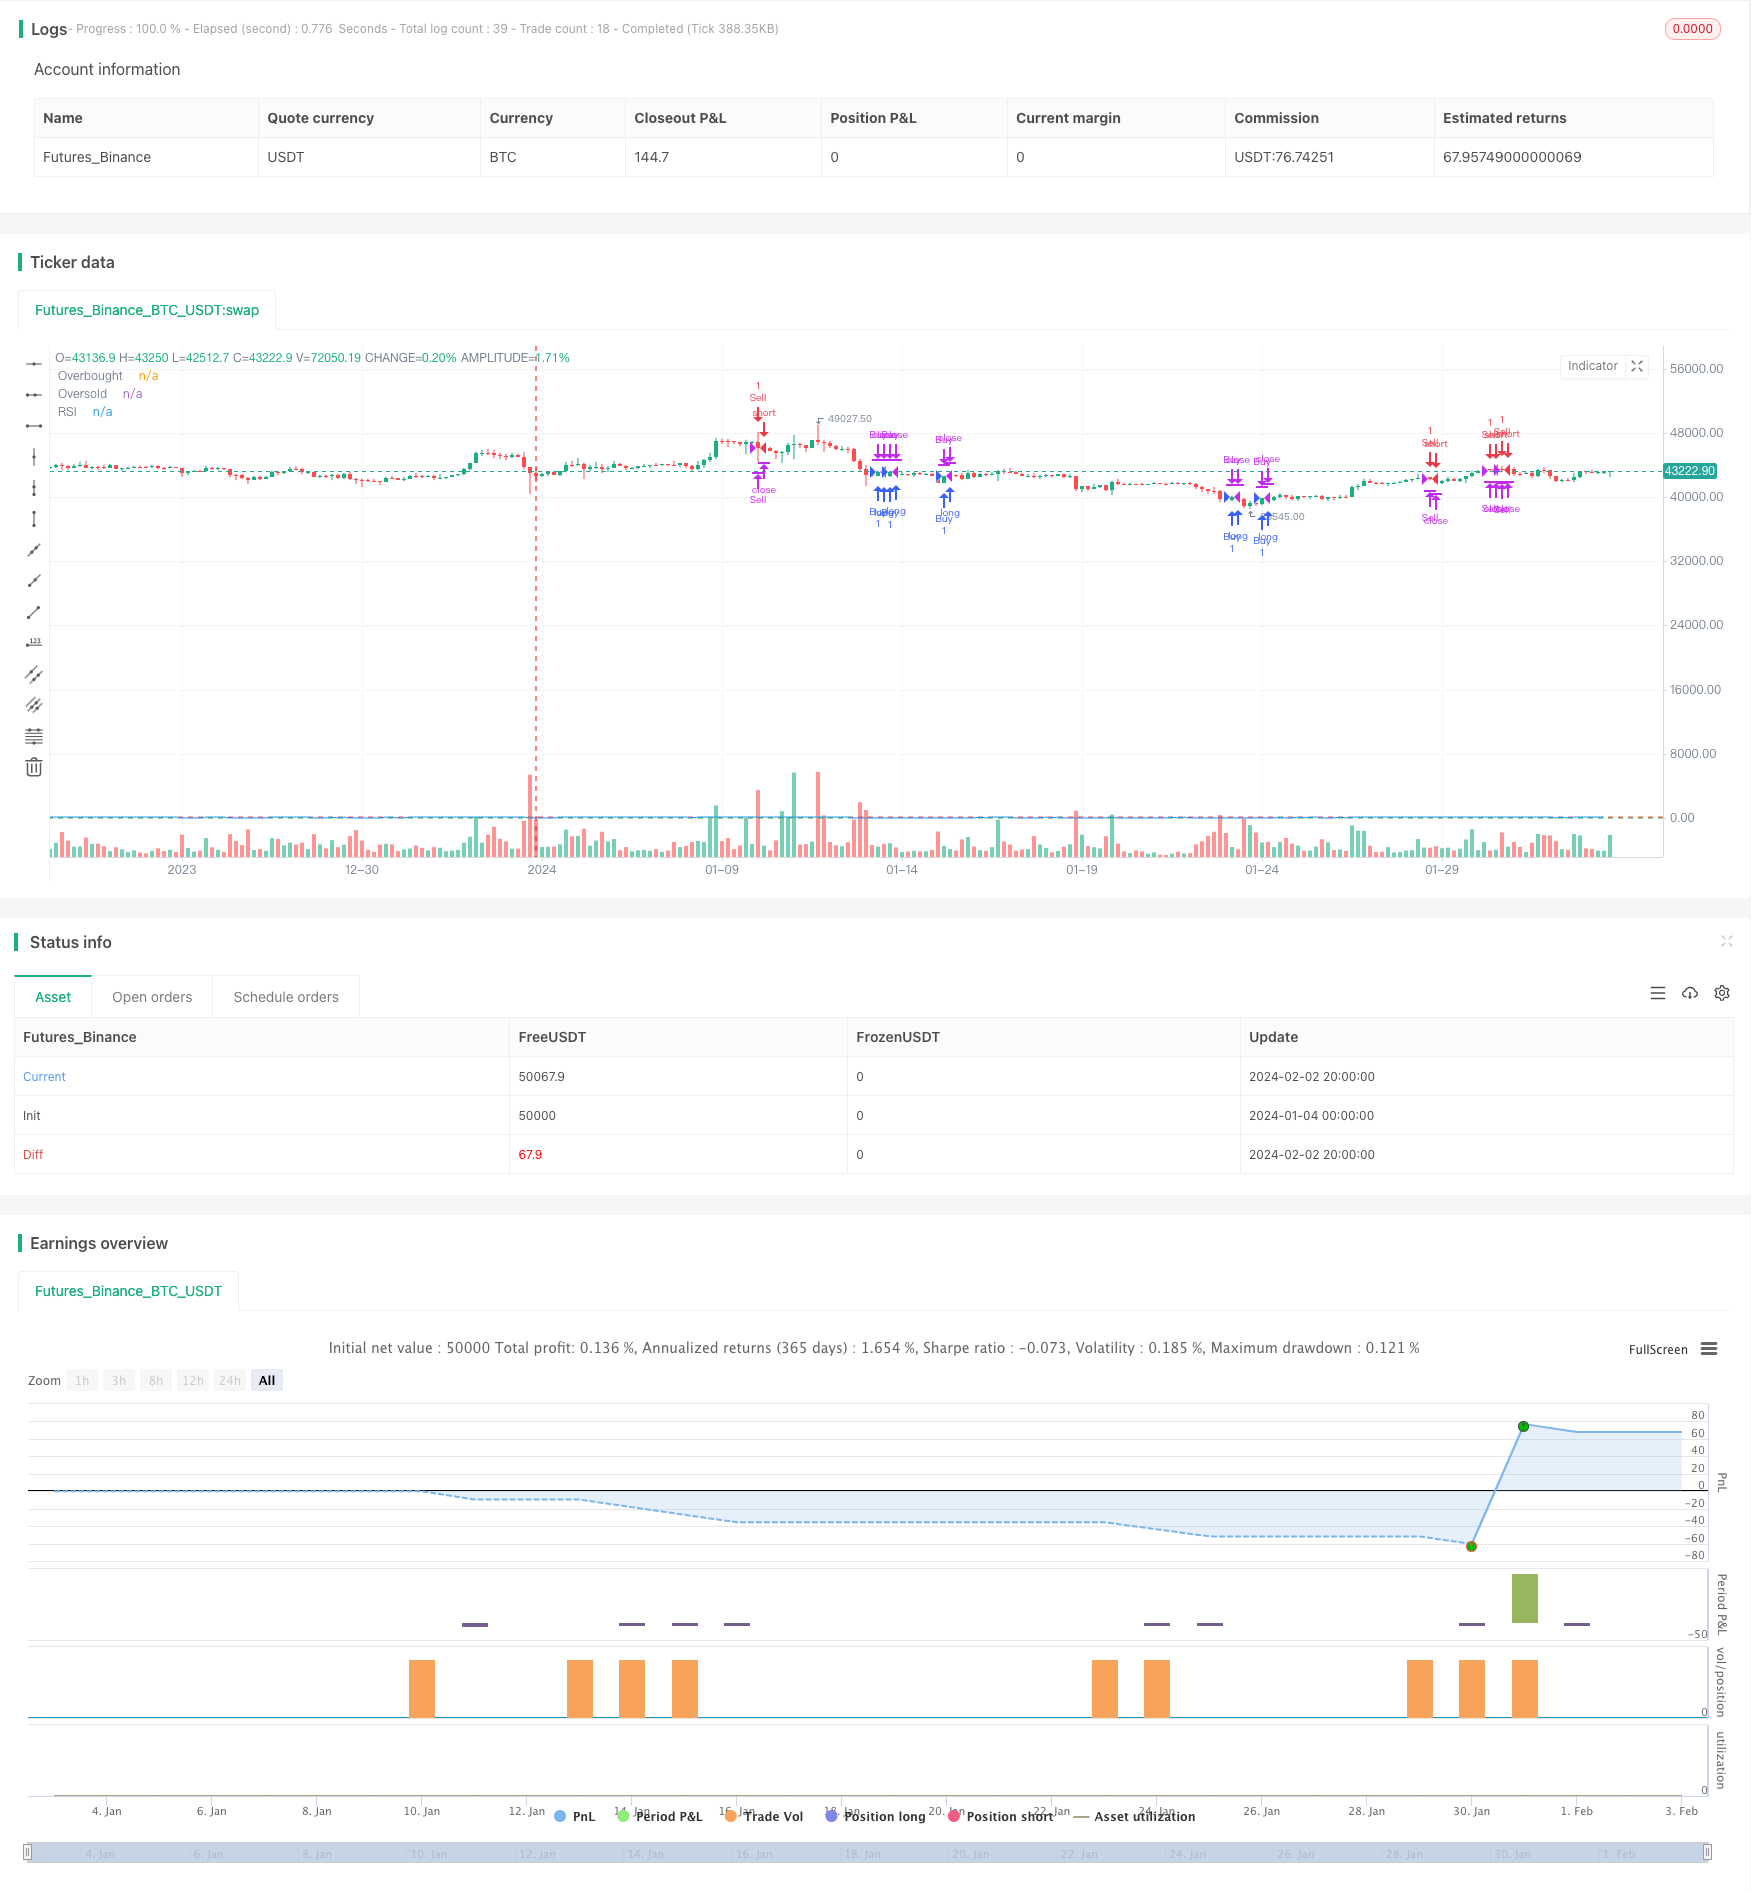
Chiến lược giao dịch chỉ báo RSI động

Tổng quan
Chiến lược này xây dựng chiến lược giao dịch bằng cách tính toán chỉ số RSI và thiết lập khoảng mua bán quá mức, kết hợp với dừng động và lợi nhuận mục tiêu để thoát ra. Khi RSI vượt quá phạm vi bán quá mức, hãy làm trống, khi vượt quá phạm vi bán quá mức, hãy làm nhiều hơn khi vượt quá phạm vi bán quá mức, đồng thời thiết lập theo dõi dừng lỗ và lợi nhuận mục tiêu để thoát khỏi vị trí.
Nguyên tắc chiến lược
Chiến lược này sử dụng chỉ số RSI 14 ngày để đánh giá hình thức kỹ thuật của thị trường. Chỉ số RSI phản ánh tỷ lệ tăng/tăng trong một khoảng thời gian để đánh giá thị trường là quá mua hoặc quá bán. Độ dài RSI trong chiến lược này là 14.
Ngoài ra, chiến lược này cũng sử dụng cơ chế dừng theo dõi động. Khi giữ vị trí nhiều đầu, theo dõi giá dừng là 97% của giá đóng cửa; Khi giữ vị trí đầu trống, theo dõi giá dừng là 103% của giá đóng cửa. Điều này có thể khóa phần lớn lợi nhuận, đồng thời tránh dừng bị rung lên.
Cuối cùng, chiến lược này cũng sử dụng cơ chế lợi nhuận mục tiêu. Khi lợi nhuận giữ vị trí đạt 20% thì sẽ thoát khỏi vị trí. Điều này có thể khóa một phần lợi nhuận và tránh lợi nhuận quay trở lại.
Phân tích lợi thế
Chiến lược này có một số ưu điểm:
- Sử dụng chỉ số RSI để đánh giá tình trạng quá mua và quá bán, bạn có thể nắm bắt được điểm biến động của thị trường
- Sử dụng Dynamic Tracking Stop Loss để kiểm soát rủi ro hiệu quả
- Thiết lập mục tiêu lợi nhuận và khóa một phần lợi nhuận
- Chiến lược rõ ràng, dễ hiểu, ít tham số, dễ dàng hoạt động trên ổ đĩa
- Các tham số có thể được tối ưu hóa dễ dàng như chiều dài RSI, mức mua quá mức bán quá mức, mức dừng lỗ
Phân tích rủi ro
Tuy nhiên, chiến lược này cũng có một số rủi ro cần lưu ý:
- Khả năng RSI đưa ra tín hiệu sai dẫn đến tổn thất không cần thiết
- Tỷ lệ lỗ hổng bị phá vỡ sẽ tăng lên.
- Mục tiêu lợi nhuận được đặt quá thấp và không thể giữ đủ lợi nhuận
Đối với các rủi ro trên, có thể giải quyết bằng cách tối ưu hóa các tham số RSI, điều chỉnh mức dừng lỗ và giảm bớt các yêu cầu lợi nhuận mục tiêu thích hợp.
Hướng tối ưu hóa
Chiến lược này có thể được tối ưu hóa theo các hướng sau:
- Tối ưu hóa các tham số của chỉ số RSI, điều chỉnh các tiêu chuẩn đánh giá mua quá mức, giảm khả năng tín hiệu sai
- Thêm bộ lọc cho các chỉ số khác để tránh RSI gây ra tín hiệu sai một lần
- Động thái tối ưu hóa lợi nhuận mục tiêu, cho phép chiến lược có thể điều chỉnh linh hoạt theo tình hình thị trường
- Kết hợp với chỉ số khối lượng giao dịch, tránh phá vỡ giả mạo với khối lượng thấp
- Thêm thuật toán học máy, tự động tối ưu hóa tham số
Tóm tắt
Chiến lược này có ý tưởng tổng thể rõ ràng, sử dụng chỉ số RSI để đánh giá quá mua quá bán, kết hợp với dừng động và mục tiêu lợi nhuận thoát. Ưu điểm là dễ hiểu thực hiện, kiểm soát rủi ro, khả năng mở rộng mạnh mẽ. Bước tiếp theo có thể được tối ưu hóa từ các hướng như nâng cao chất lượng tín hiệu, tham số điều chỉnh động, để chiến lược trở nên thông minh hơn.
/*backtest
start: 2024-01-04 00:00:00
end: 2024-02-03 00:00:00
period: 4h
basePeriod: 15m
exchanges: [{"eid":"Futures_Binance","currency":"BTC_USDT"}]
*/

//@version=5
strategy("Modified RSI-Based Trading Strategy", overlay=true)

// RSI settings
rsiLength = input(14, title="RSI Length")
overboughtLevel = 70
oversoldLevel = 30

// User-defined parameters
trailingStopPercentage = input(3, title="Trailing Stop Percentage (%)")
profitTargetPercentage = input(20, title="Profit Target Percentage (%)")

rsiValue = ta.rsi(close, rsiLength)

var float trailingStopLevel = na
var float profitTargetLevel = na

// Entry criteria
enterLong = ta.crossover(rsiValue, oversoldLevel)
enterShort = ta.crossunder(rsiValue, overboughtLevel)

// Exit criteria
exitLong = ta.crossover(rsiValue, overboughtLevel)
exitShort = ta.crossunder(rsiValue, oversoldLevel)

// Trailing stop calculation
if (strategy.position_size > 0)
    trailingStopLevel := close * (1 - trailingStopPercentage / 100)

if (strategy.position_size < 0)
    trailingStopLevel := close * (1 + trailingStopPercentage / 100)

// Execute the strategy
if (enterLong)
    strategy.entry("Buy", strategy.long)

if (exitLong or ta.crossover(close, trailingStopLevel) or ta.change(close) > profitTargetPercentage / 100)
    strategy.close("Buy")

if (enterShort)
    strategy.entry("Sell", strategy.short)

if (exitShort or ta.crossunder(close, trailingStopLevel) or ta.change(close) < -profitTargetPercentage / 100)
    strategy.close("Sell")

// Plot RSI and overbought/oversold levels
plot(rsiValue, title="RSI", color=color.blue)
hline(overboughtLevel, "Overbought", color=color.red, linestyle=hline.style_dashed)
hline(oversoldLevel, "Oversold", color=color.green, linestyle=hline.style_dashed)