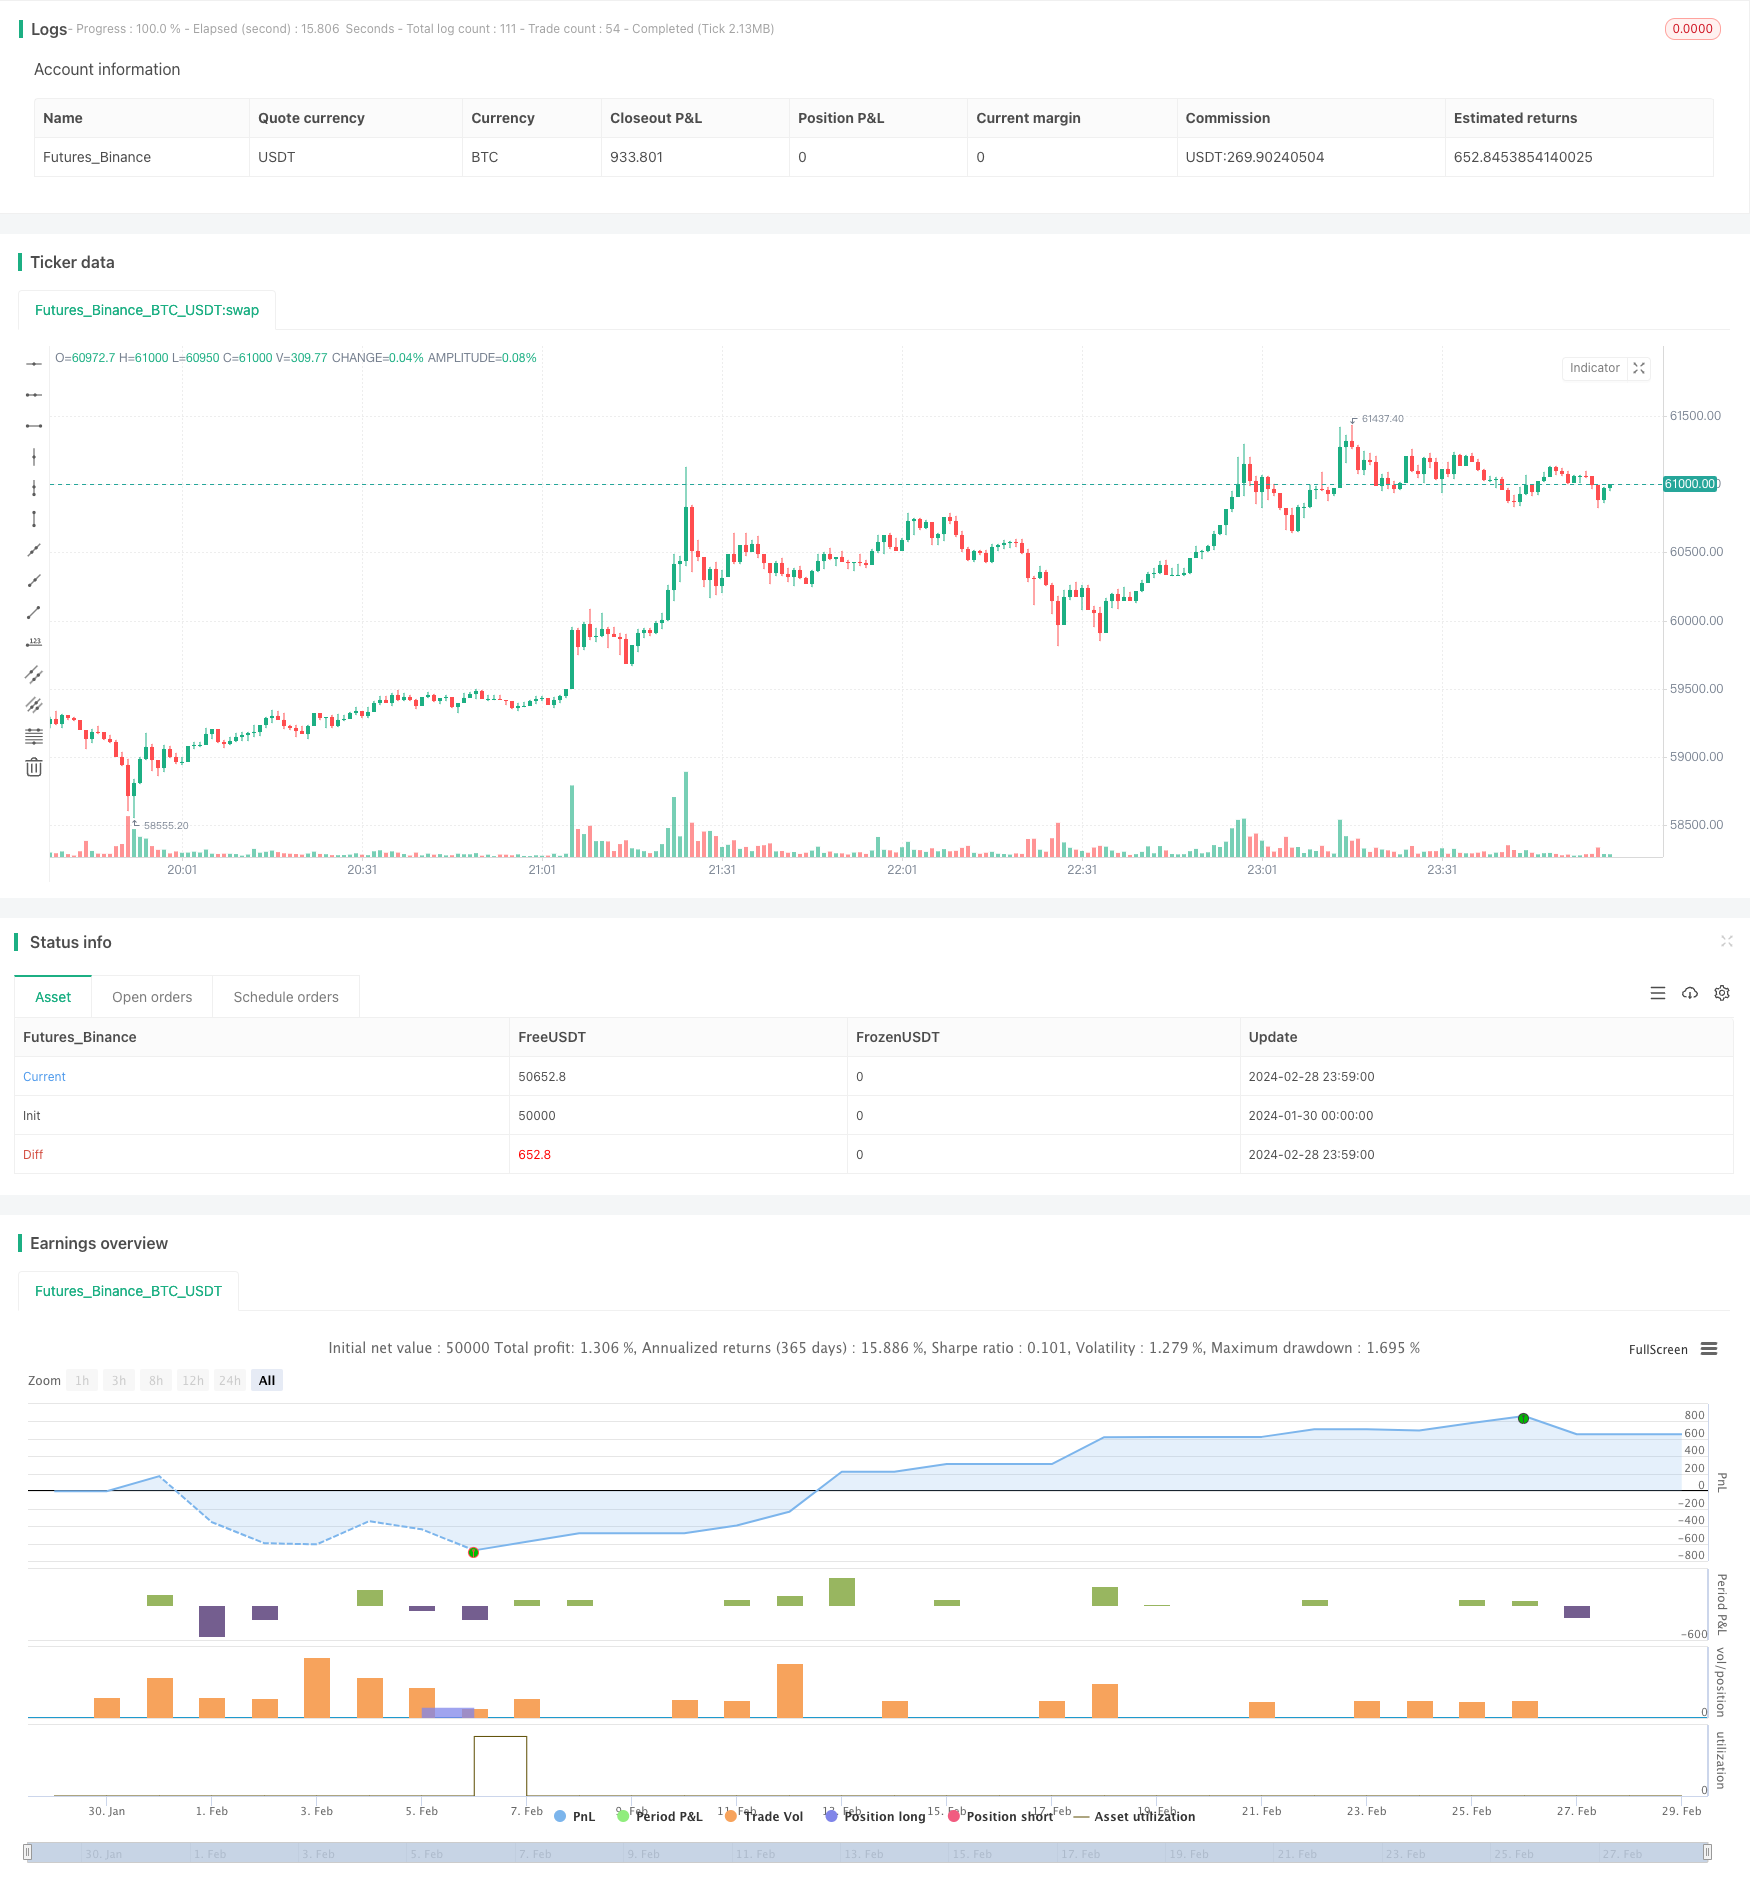
Chiến lược RSI và RSI được làm mịn mô hình tăng giá

Tổng quan
Chiến lược này tìm kiếm cơ hội mua ở mức thấp của giá bằng cách kết hợp chỉ số RSI với chỉ số RSI trơn. Khi chỉ số RSI đổi mới thấp và giá không đổi mới thấp, nó được coi là tín hiệu phân loại đa đầu. Kết hợp với phán đoán xu hướng của chỉ số RSI trơn, có thể nâng cao hiệu quả của chiến lược.
Nguyên tắc chiến lược
- Tính toán chỉ số RSI, tham số là đường 14 ngày.
- Tính toán chỉ số RSI trơn để đạt hiệu quả trơn bằng cách sử dụng trung bình WMA kép.
- Đánh giá RSI dưới 30 là bán quá mức.
- Xác định RSI trơn là dưới 35, hướng mạnh.
- Xác định điểm RSI thấp hơn 25
- Tính phân loại RSI, tìm kiếm RSI sáng tạo thấp và giá không sáng tạo thấp.
- Để tính toán chu kỳ giảm của RSI trơn, cần đến 3 ngày.
- Một tín hiệu mua sẽ được tạo ra khi tất cả các điều kiện trên được đáp ứng.
- Thiết lập điều kiện dừng và dừng.
Chiến lược này chủ yếu dựa trên tính chất đảo ngược của chỉ số RSI, kết hợp với xu hướng phán đoán RSI bằng phẳng, mua khi RSI vượt quá giá khi giá chịu áp lực.
Phân tích lợi thế chiến lược
- Gói chỉ số RSI kép, tăng hiệu quả chiến lược.
- Sử dụng tính năng đảo ngược của chỉ số RSI, có một lợi thế xác suất nhất định.
- RSI trơn có thể giúp tránh sự đảo ngược giả.
- Một hệ thống logic dừng lỗ hoàn chỉnh có thể hạn chế rủi ro.
Phân tích rủi ro
- RSI có khả năng đảo ngược thất bại, không thể hoàn toàn tránh được.
- Chỉ số RSI trơn trượt, có thể bỏ lỡ thời điểm mua tốt nhất.
- Các điểm dừng lỗ được thiết lập quá thoải mái, có nguy cơ mở rộng lỗ.
Bạn có thể điều chỉnh các tham số RSI để tối ưu hóa thời gian mua. Giảm khoảng cách dừng lỗ một cách thích hợp, tăng tốc độ dừng lỗ. Kết hợp với các chỉ số khác để đánh giá rủi ro xu hướng, giảm khả năng đảo ngược giả.
Hướng tối ưu hóa
- Có thể kiểm tra hiệu quả của chỉ số RSI theo các tham số khác nhau.
- Tối ưu hóa phương pháp tính toán RSI mịn, cải thiện chất lượng mịn
- Điều chỉnh điểm dừng để tìm kiếm tỷ lệ lợi nhuận rủi ro tối ưu.
- Tăng khả năng phán đoán của các chỉ số năng lượng, tránh tình trạng thiếu năng lượng.
Việc điều chỉnh các tham số và kết hợp nhiều chỉ số hơn có thể làm tăng hiệu quả giao dịch chiến lược.
Tóm tắt
Chiến lược tổng thể là một chiến lược sử dụng các đặc điểm của RSI. Sự kết hợp của hai chỉ số RSI sẽ tạo ra hiệu quả đầy đủ của sự đảo ngược RSI, đồng thời làm tăng sự không chắc chắn của sự khác biệt trong chỉ số. Toàn bộ là một chiến lược tổng thể điển hình của chỉ số.
/*backtest
start: 2024-01-30 00:00:00
end: 2024-02-29 00:00:00
period: 1m
basePeriod: 1m
exchanges: [{"eid":"Futures_Binance","currency":"BTC_USDT"}]
*/

// This source code is subject to the terms of the Mozilla Public License 2.0 at https://mozilla.org/MPL/2.0/
// © BigBitsIO

//@version=4
strategy(title="RSI and Smoothed RSI Bull Div Strategy [BigBitsIO]", shorttitle="RSI and Smoothed RSI Bull Div Strategy [BigBitsIO]", overlay=true, pyramiding=1, default_qty_type=strategy.percent_of_equity, default_qty_value=100, commission_type=strategy.commission.percent, commission_value=.1, slippage=0)


TakeProfitPercent = input(3, title="Take Profit %", type=input.float, step=.25)
StopLossPercent = input(1.75, title="Stop Loss %", type=input.float, step=.25)

RSICurve = input(14, title="RSI Lookback Period", type=input.integer, step=1)
BuyBelowTargetPercent = input(0, title="Buy Below Lowest Low In RSI Divergence Lookback Target %", type=input.float, step=.05)
BuyBelowTargetSource = input(close, title="Source of Buy Below Target Price", type=input.source)
SRSICurve = input(10, title="Smoothed RSI Lookback Period", type=input.integer, step=1)
RSICurrentlyBelow = input(30, title="RSI Currently Below", type=input.integer, step=1)
RSIDivergenceLookback = input(25, title="RSI Divergence Lookback Period", type=input.integer, step=1)
RSILowestInDivergenceLookbackCurrentlyBelow  = input(25, title="RSI Lowest In Divergence Lookback Currently Below", type=input.integer, step=1)
RSISellAbove = input(65, title="RSI Sell Above", type=input.integer, step=1)
MinimumSRSIDownTrend = input(3, title="Minimum SRSI Downtrend Length", type=input.integer, step=1)
SRSICurrentlyBelow = input(35, title="Smoothed RSI Currently Below", type=input.integer, step=1)

PlotTarget = input(false, title="Plot Target")


RSI = rsi(close, RSICurve)
SRSI = wma(2*wma(RSI, SRSICurve/2)-wma(RSI, SRSICurve), round(sqrt(SRSICurve))) // Hull moving average

SRSITrendDownLength = 0
if (SRSI < SRSI[1])
    SRSITrendDownLength := SRSITrendDownLength[1] + 1

// Strategy Specific
ProfitTarget = (close * (TakeProfitPercent / 100)) / syminfo.mintick
LossTarget = (close * (StopLossPercent / 100)) / syminfo.mintick
BuyBelowTarget = BuyBelowTargetSource[(lowestbars(RSI, RSIDivergenceLookback)*-1)] - (BuyBelowTargetSource[(lowestbars(RSI, RSIDivergenceLookback)*-1)] * (BuyBelowTargetPercent / 100))

plot(PlotTarget ? BuyBelowTarget : na)


bool IsABuy = RSI < RSICurrentlyBelow and SRSI < SRSICurrentlyBelow and lowest(SRSI, RSIDivergenceLookback) < RSILowestInDivergenceLookbackCurrentlyBelow and BuyBelowTargetSource < BuyBelowTarget and SRSITrendDownLength >= MinimumSRSIDownTrend and RSI > lowest(RSI, RSIDivergenceLookback)
bool IsASell = RSI > RSISellAbove

if IsABuy
    strategy.entry("Positive Trend", true) // buy by market
    strategy.exit("Take Profit or Stop Loss", "Positive Trend", profit = ProfitTarget, loss = LossTarget)
if IsASell
    strategy.close("Positive Trend")