1
tập trung vào
1628
Người theo dõi

Tổng quan
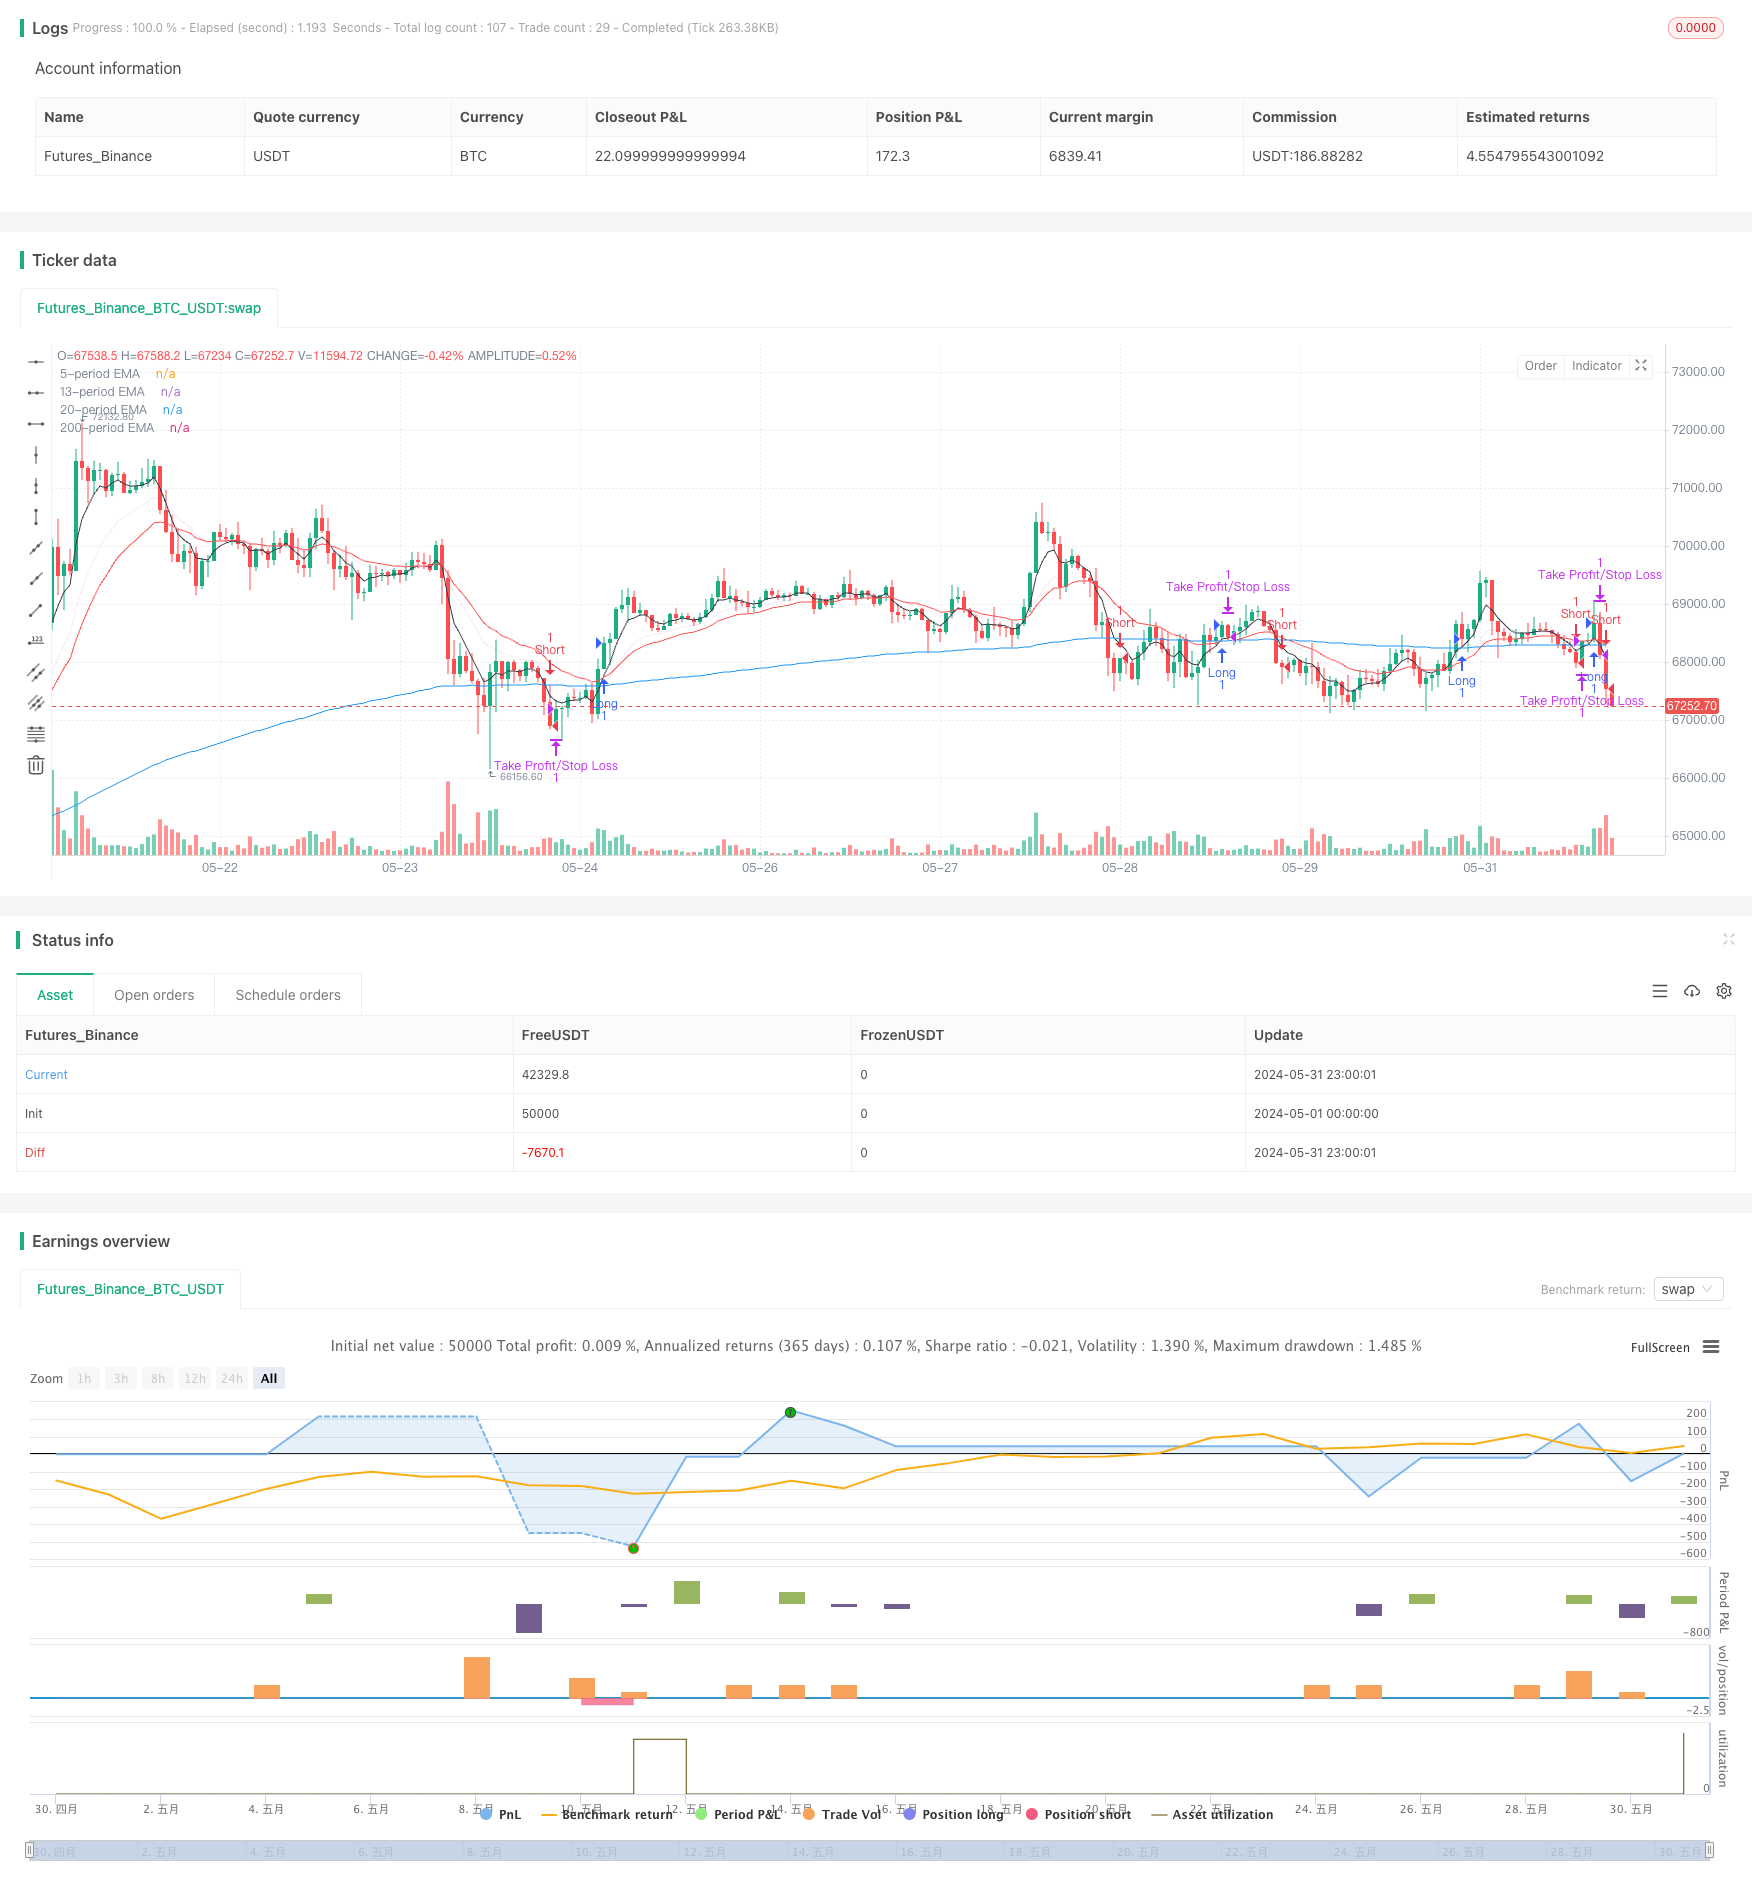
Chiến lược này sử dụng chéo của hai trung bình di chuyển chỉ số ((EMA) của hai chu kỳ khác nhau như một tín hiệu giao dịch, đồng thời thiết lập các điểm dừng và dừng cố định. Khi EMA ngắn hạn đi từ dưới lên qua EMA dài hạn, hãy đặt nhiều; khi EMA ngắn hạn đi từ trên xuống qua EMA dài hạn, hãy đặt trống.
Nguyên tắc chiến lược
- Tính EMA cho hai chu kỳ khác nhau, mặc định là 5 chu kỳ và 200 chu kỳ.
- Khi 5 chu kỳ EMA từ dưới lên qua 200 chu kỳ EMA, tạo ra tín hiệu làm nhiều; khi 5 chu kỳ EMA từ trên xuống qua 200 chu kỳ EMA, tạo ra tín hiệu làm trống.
- Sau khi mở vị trí, thiết lập điểm dừng lỗ (đặc biệt là 50) và điểm dừng (đặc biệt là 200).
- Khi giá chạm đến điểm dừng hoặc điểm dừng lỗ, hoặc giữ vị trí đạt 200 chu kỳ giao dịch, vị trí được rút ra.
- Số điểm dừng lỗ có thể được điều chỉnh theo khối lượng giao dịch trên biểu đồ.
Lợi thế chiến lược
- Đơn giản và dễ hiểu: Chiến lược này có logic rõ ràng, dễ hiểu và dễ thực hiện.
- Theo dõi xu hướng: Sử dụng tính năng xu hướng của EMA để nắm bắt được xu hướng thị trường tốt hơn.
- Kiểm soát rủi ro: Thiết lập số điểm dừng cố định, kiểm soát hiệu quả rủi ro giao dịch đơn lẻ.
- Tính linh hoạt: Số điểm dừng lỗ có thể được điều chỉnh theo biến động của thị trường và sở thích rủi ro cá nhân.
Rủi ro chiến lược
- Tín hiệu giả: EMA crossover có thể tạo ra tín hiệu giả, dẫn đến giao dịch thường xuyên và mất tiền.
- Xu hướng chậm trễ: EMA là chỉ số chậm trễ, có thể chỉ phát ra tín hiệu sau khi xu hướng đã hình thành, bỏ lỡ cơ hội nhập cảnh tốt nhất.
- Thị trường thu hồi: Trong thị trường thu hồi, giao dịch EMA thường xuyên có thể dẫn đến giao dịch thua lỗ liên tục.
- Hạn chế điểm cố định: Hạn chế điểm cố định có thể không thích nghi với sự thay đổi của tỷ lệ biến động thị trường, dẫn đến việc đặt vị trí dừng lỗ không đúng cách.
Hướng tối ưu hóa chiến lược
- Thêm nhiều chỉ số: kết hợp với các chỉ số kỹ thuật khác như MACD, RSI, v.v. để tăng độ tin cậy tín hiệu.
- Tối ưu hóa tham số: Tối ưu hóa các tham số như chu kỳ EMA, số điểm dừng lỗ để cải thiện hiệu suất chiến lược.
- Hạn chế động lực: Điều chỉnh số điểm dừng động theo biến động của thị trường để thích ứng tốt hơn với sự thay đổi của thị trường.
- Quản lý vị trí: giới thiệu các quy tắc quản lý vị trí, chẳng hạn như điều chỉnh vị trí dựa trên rủi ro, tăng lợi nhuận sau khi điều chỉnh rủi ro.
- Bộ lọc: tăng các điều kiện lọc tín hiệu giao dịch, chẳng hạn như khối lượng giao dịch, hình thức giá, để cải thiện chất lượng tín hiệu.
Tóm tắt
Chiến lược dừng chân hai đường thẳng là một chiến lược giao dịch đơn giản, dễ sử dụng, tạo ra tín hiệu giao dịch thông qua giao dịch EMA, đồng thời thiết lập số điểm dừng chân cố định để kiểm soát rủi ro. Ưu điểm của chiến lược này là logic rõ ràng, dễ thực hiện, có thể nắm bắt xu hướng thị trường tốt hơn.
Mã nguồn chiến lược
/*backtest
start: 2024-05-01 00:00:00
end: 2024-05-31 23:59:59
period: 1h
basePeriod: 15m
exchanges: [{"eid":"Futures_Binance","currency":"BTC_USDT"}]
*/


//@version=5
strategy("EMA5 Cross EAM200 && SL/TP 50 and 200 Point Target", overlay=true)

// Define input parameters for EMA lengths
ema_5 = input.int(5, title="Fast EMA Length")
ema_200 = input.int(200, title="Slow EMA Length")

// Define input parameters for stop loss and profit target in points
stopLossPoints = input.float(50, title="Stop Loss (Points)")
profitTargetPoints = input.float(200, title="Profit Target (Points)")

// Calculate EMAs
price = close
emafast = ta.ema(price, ema_5)
emaslow = ta.ema(price, ema_200)

// Plot EMAs on chart
plot(emafast, title="5-period EMA", color=color.black)
plot(emaslow, title="200-period EMA", color=color.blue)

// Extra lines if needed
ema_13 = input.int(13, title="13 EMA")
ema_13_line = ta.ema(price, ema_13)
plot(ema_13_line, title="13-period EMA", color=color.rgb(156, 39, 176, 90))

ema_20 = input.int(20, title="20 EMA")
ema_20_line = ta.ema(price, ema_20)
plot(ema_20_line, title="20-period EMA", color=color.red)


// Define entry conditions
longCondition = ta.crossover(emafast, emaslow)
shortCondition = ta.crossunder(emafast, emaslow)

// Counter to keep track of the number of bars since the entry
var int barCount = na

// Reset counter and enter long trade
if (longCondition)
    strategy.entry("Long", strategy.long, comment="Long")
    barCount := 0

// Reset counter and enter short trade
if (shortCondition)
    strategy.entry("Short", strategy.short, comment="Short")
    barCount := 0

// Increment counter if in trade
if (strategy.opentrades > 0)
    barCount += 1

// Calculate entry price
entryPrice = strategy.position_avg_price

// Exit long trade if stop loss, profit target hit, or 200 points have been reached
if (strategy.position_size > 0)
    strategy.exit("Take Profit/Stop Loss", "Long", stop=entryPrice - stopLossPoints, limit=entryPrice + profitTargetPoints)

// Exit short trade if stop loss, profit target hit, or 200 points have been reached
if (strategy.position_size < 0)
    strategy.exit("Take Profit/Stop Loss", "Short", stop=entryPrice + stopLossPoints, limit=entryPrice - profitTargetPoints)