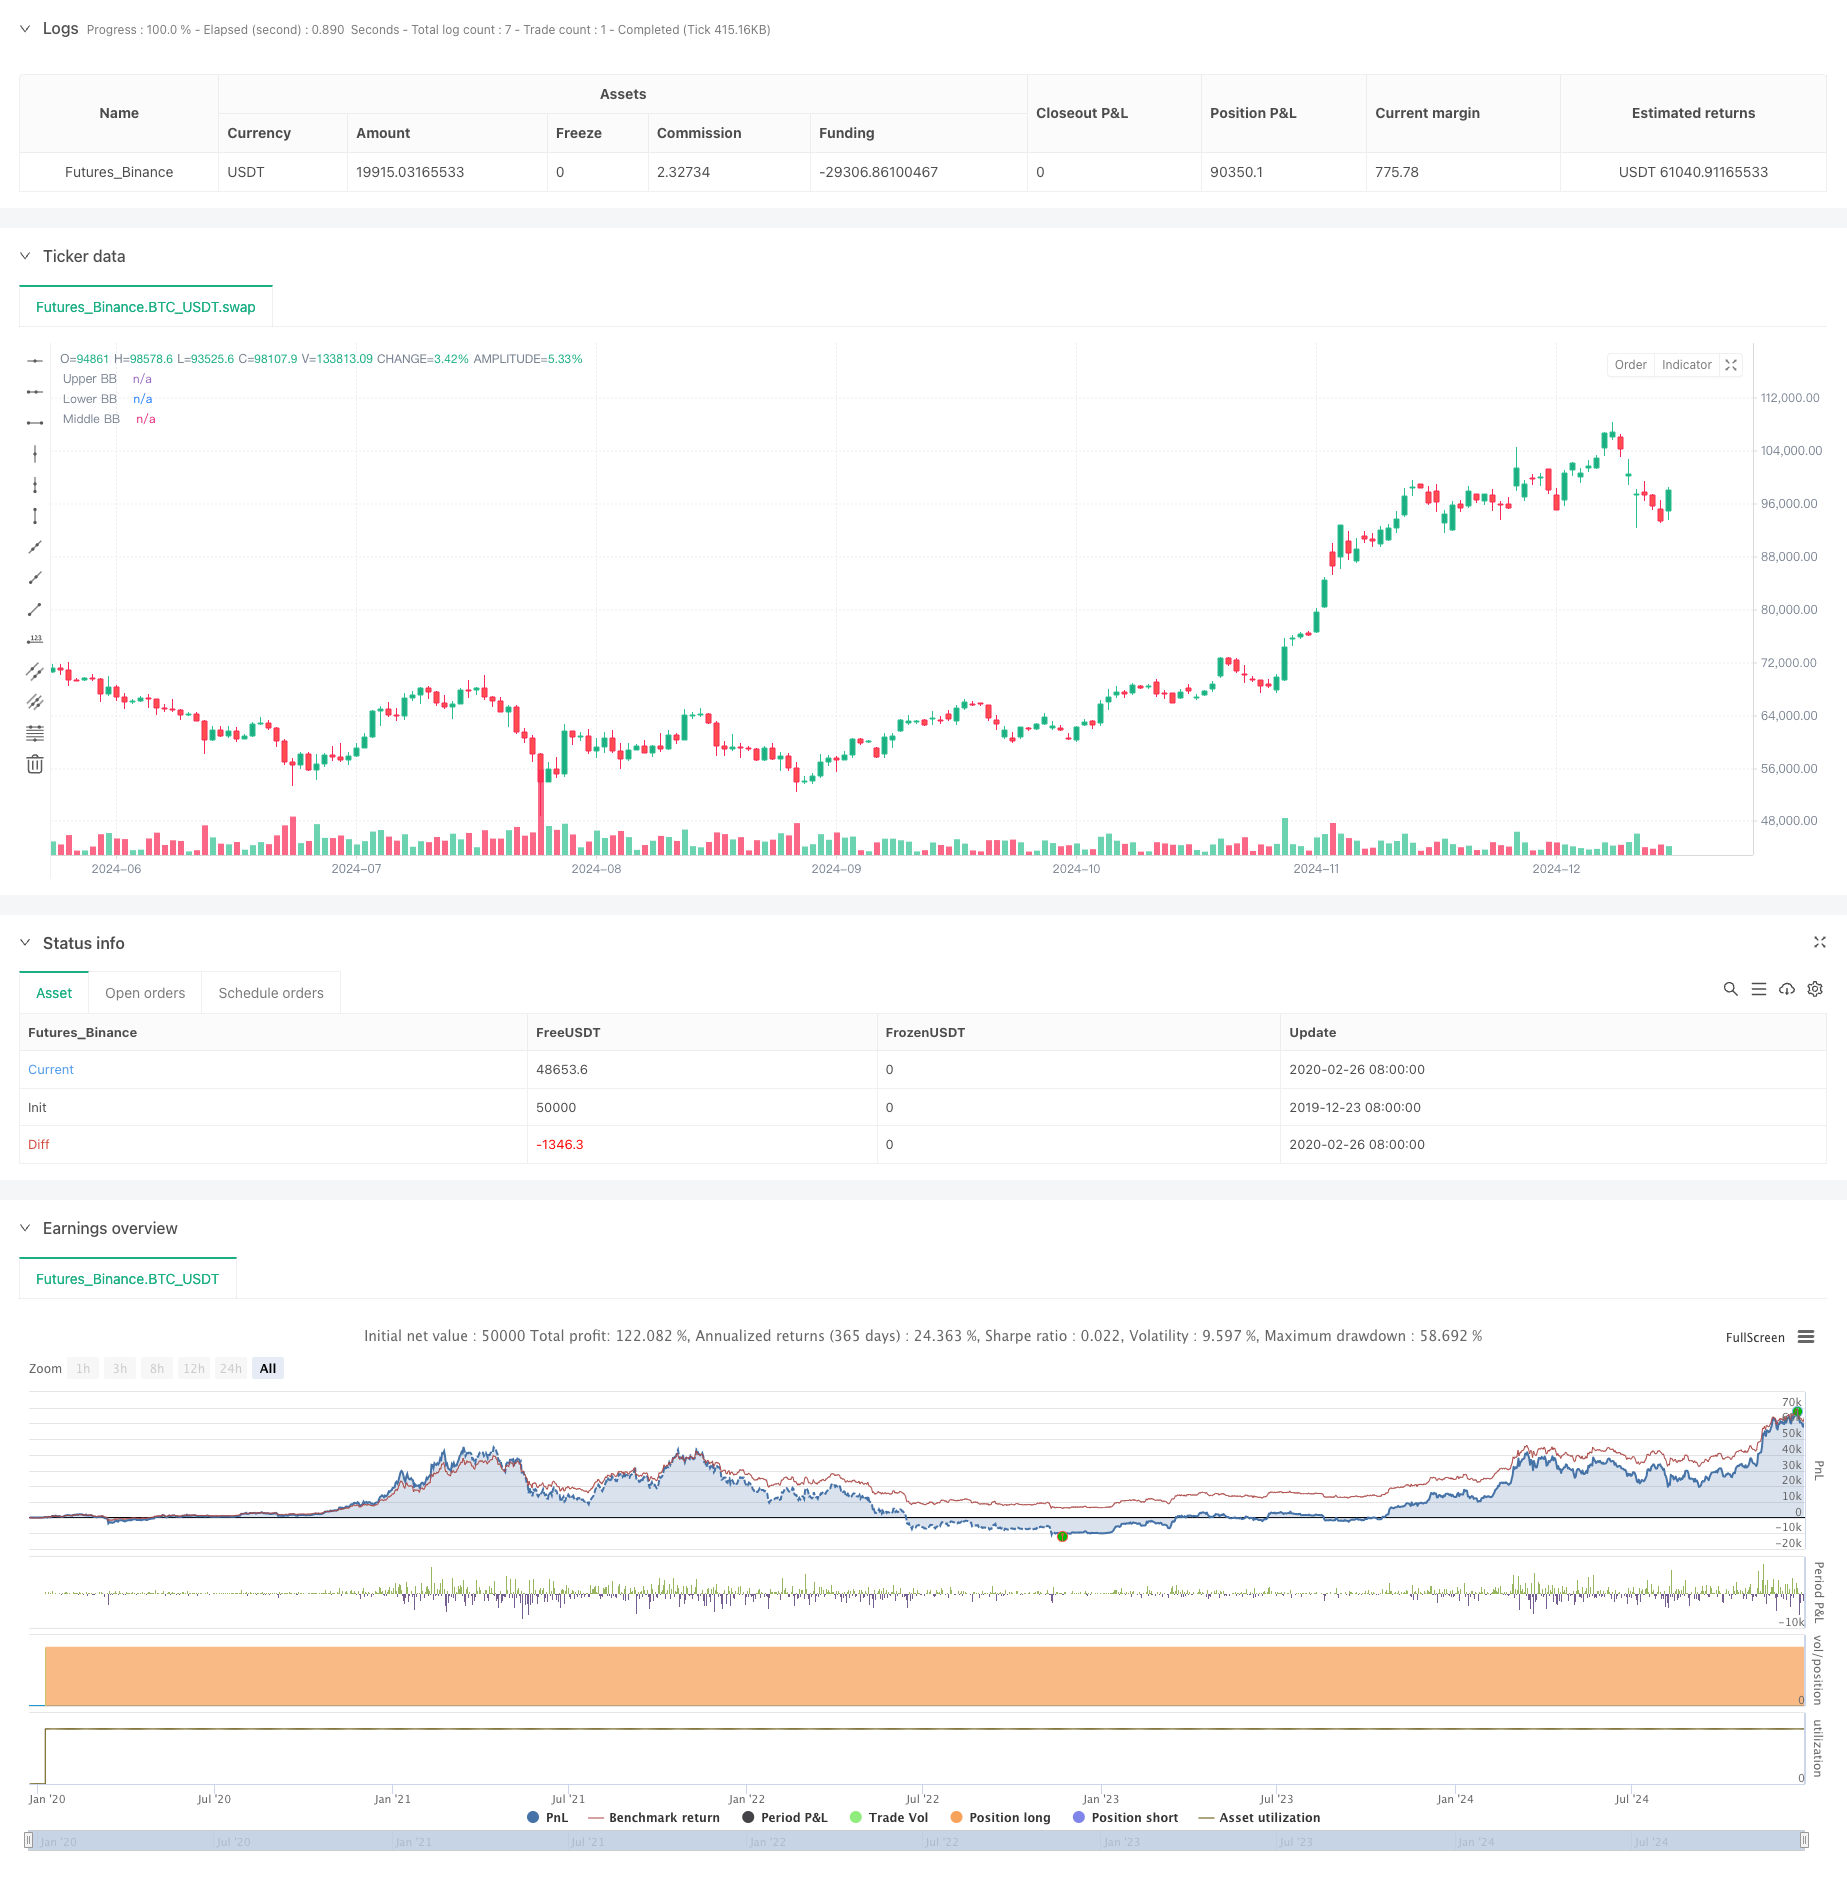
Tổng quan
Chiến lược này là hệ thống giao dịch định lượng đa cấp dựa trên sự phân kỳ xu hướng của Dải Bollinger và những thay đổi băng thông động. Chiến lược này xây dựng một khuôn khổ ra quyết định giao dịch hoàn chỉnh bằng cách theo dõi những thay đổi năng động trong độ rộng của Dải Bollinger, mức đột phá về giá và sự phối hợp của đường trung bình động EMA200. Chiến lược này áp dụng cơ chế theo dõi biến động thích ứng, có thể nắm bắt hiệu quả các bước ngoặt trong xu hướng thị trường.
Nguyên tắc chiến lược
Cốt lõi của chiến lược này dựa trên các yếu tố chính sau:
- Dải Bollinger được tính toán bằng cách sử dụng đường trung bình động 20 kỳ và độ lệch chuẩn gấp 2 lần
- Xác định cường độ xu hướng bằng cách thay đổi băng thông tại ba thời điểm liên tiếp
- Kết hợp mối quan hệ giữa thực thể dòng K và tỷ lệ băng thông để xác định hiệu quả của đột phá
- Sử dụng EMA200 như một bộ lọc xu hướng trung hạn đến dài hạn
- Vào thị trường và mua khi giá vượt qua đường trên và đáp ứng các điều kiện mở rộng băng thông
- Khi giá giảm xuống dưới dải dưới và đáp ứng các điều kiện thu hẹp băng thông, hãy đóng vị thế
Lợi thế chiến lược
- Hệ thống tín hiệu hướng tới tương lai và có thể phát hiện trước các điểm đảo chiều xu hướng tiềm năng
- Nhiều chỉ báo kỹ thuật xác thực chéo, giảm đáng kể tín hiệu sai
- Chỉ báo tốc độ thay đổi băng thông có khả năng thích ứng tốt với biến động của thị trường
- Logic nhập và thoát rõ ràng và dễ dàng triển khai theo chương trình
- Cơ chế kiểm soát rủi ro hoàn hảo và có thể kiểm soát hiệu quả việc rút tiền
Rủi ro chiến lược
- Giao dịch thường xuyên có thể xảy ra ở những thị trường biến động
- Độ trễ có thể xảy ra khi xu hướng đột nhiên thay đổi
- Tối ưu hóa tham số có nguy cơ quá khớp
- Có thể có rủi ro trượt giá trong thời kỳ thị trường biến động mạnh
- Hiệu quả của các chỉ số băng thông cần được theo dõi kịp thời
Hướng tối ưu hóa chiến lược
- Giới thiệu cơ chế tối ưu hóa tham số thích ứng
- Thêm các chỉ số phụ trợ như khối lượng giao dịch để xác minh
- Tối ưu hóa cài đặt điều kiện dừng lỗ và chốt lời
- Cải thiện tiêu chí đánh giá định lượng về sức mạnh xu hướng
- Thêm nhiều bộ lọc môi trường thị trường
Tóm tắt
Chiến lược này xây dựng một hệ thống giao dịch mạnh mẽ thông qua sự phân kỳ xu hướng của Dải Bollinger và những thay đổi băng thông động. Chiến lược này hoạt động tốt trên thị trường có xu hướng, nhưng vẫn cần được cải thiện trên thị trường biến động và tối ưu hóa thông số. Nhìn chung, chiến lược này có giá trị thực tiễn cao và có thể mở rộng.
/*backtest
start: 2019-12-23 08:00:00
end: 2024-12-25 08:00:00
period: 1d
basePeriod: 1d
exchanges: [{"eid":"Futures_Binance","currency":"BTC_USDT"}]
*/

//@version=6
strategy("BBDIV_Strategy", overlay=true)

// Inputs for Bollinger Bands
length = input.int(20, title="BB Length")
mult = input.float(2.0, title="BB Multiplier")

// Calculate Bollinger Bands
basis = ta.sma(close, length)
deviation = mult * ta.stdev(close, length)
upperBB = basis + deviation
lowerBB = basis - deviation

// Calculate Bollinger Band width
bb_width = upperBB - lowerBB
prev_width = ta.valuewhen(not na(bb_width[1]), bb_width[1], 0)
prev_prev_width = ta.valuewhen(not na(bb_width[2]), bb_width[2], 0)

// Determine BB state
bb_state = bb_width > prev_width and prev_width > prev_prev_width ? 1 : bb_width < prev_width and prev_width < prev_prev_width ? -1 : 0

// Assign colors based on BB state
bb_color = bb_state == 1 ? color.green : bb_state == -1 ? color.red : color.gray

// Highlight candles closed outside BB
candle_size = high - low
highlight_color = (candle_size > bb_width / 2 and close > upperBB) ? color.new(color.green, 50) : (candle_size > bb_width / 2 and close < lowerBB) ? color.new(color.red, 50) : na

bgcolor(highlight_color, title="Highlight Candles")

// Plot Bollinger Bands
plot(upperBB, title="Upper BB", color=bb_color, linewidth=2, style=plot.style_line)
plot(lowerBB, title="Lower BB", color=bb_color, linewidth=2, style=plot.style_line)
plot(basis, title="Middle BB", color=color.blue, linewidth=1, style=plot.style_line)

// Calculate EMA 200
ema200 = ta.ema(close, 200)

// Plot EMA 200
plot(ema200, title="EMA 200", color=color.orange, linewidth=2, style=plot.style_line)

// Strategy logic
enter_long = highlight_color == color.new(color.green, 50)
exit_long = highlight_color == color.new(color.red, 50)

if (enter_long)
    strategy.entry("Buy", strategy.long)

if (exit_long)
    strategy.close("Buy")

// Display profit at close
if (exit_long)
    var float entry_price = na
    var float close_price = na
    var float profit = na

    if (strategy.opentrades > 0)
        entry_price := strategy.opentrades.entry_price(strategy.opentrades - 1)
        close_price := close
        profit := (close_price - entry_price) * 100 / entry_price * 2 * 10 // Assuming 1 pip = 0.01 for XAUUSD
        label.new(bar_index, high + (candle_size * 2), str.tostring(profit, format.mintick) + " USD", style=label.style_label_up, color=color.green)