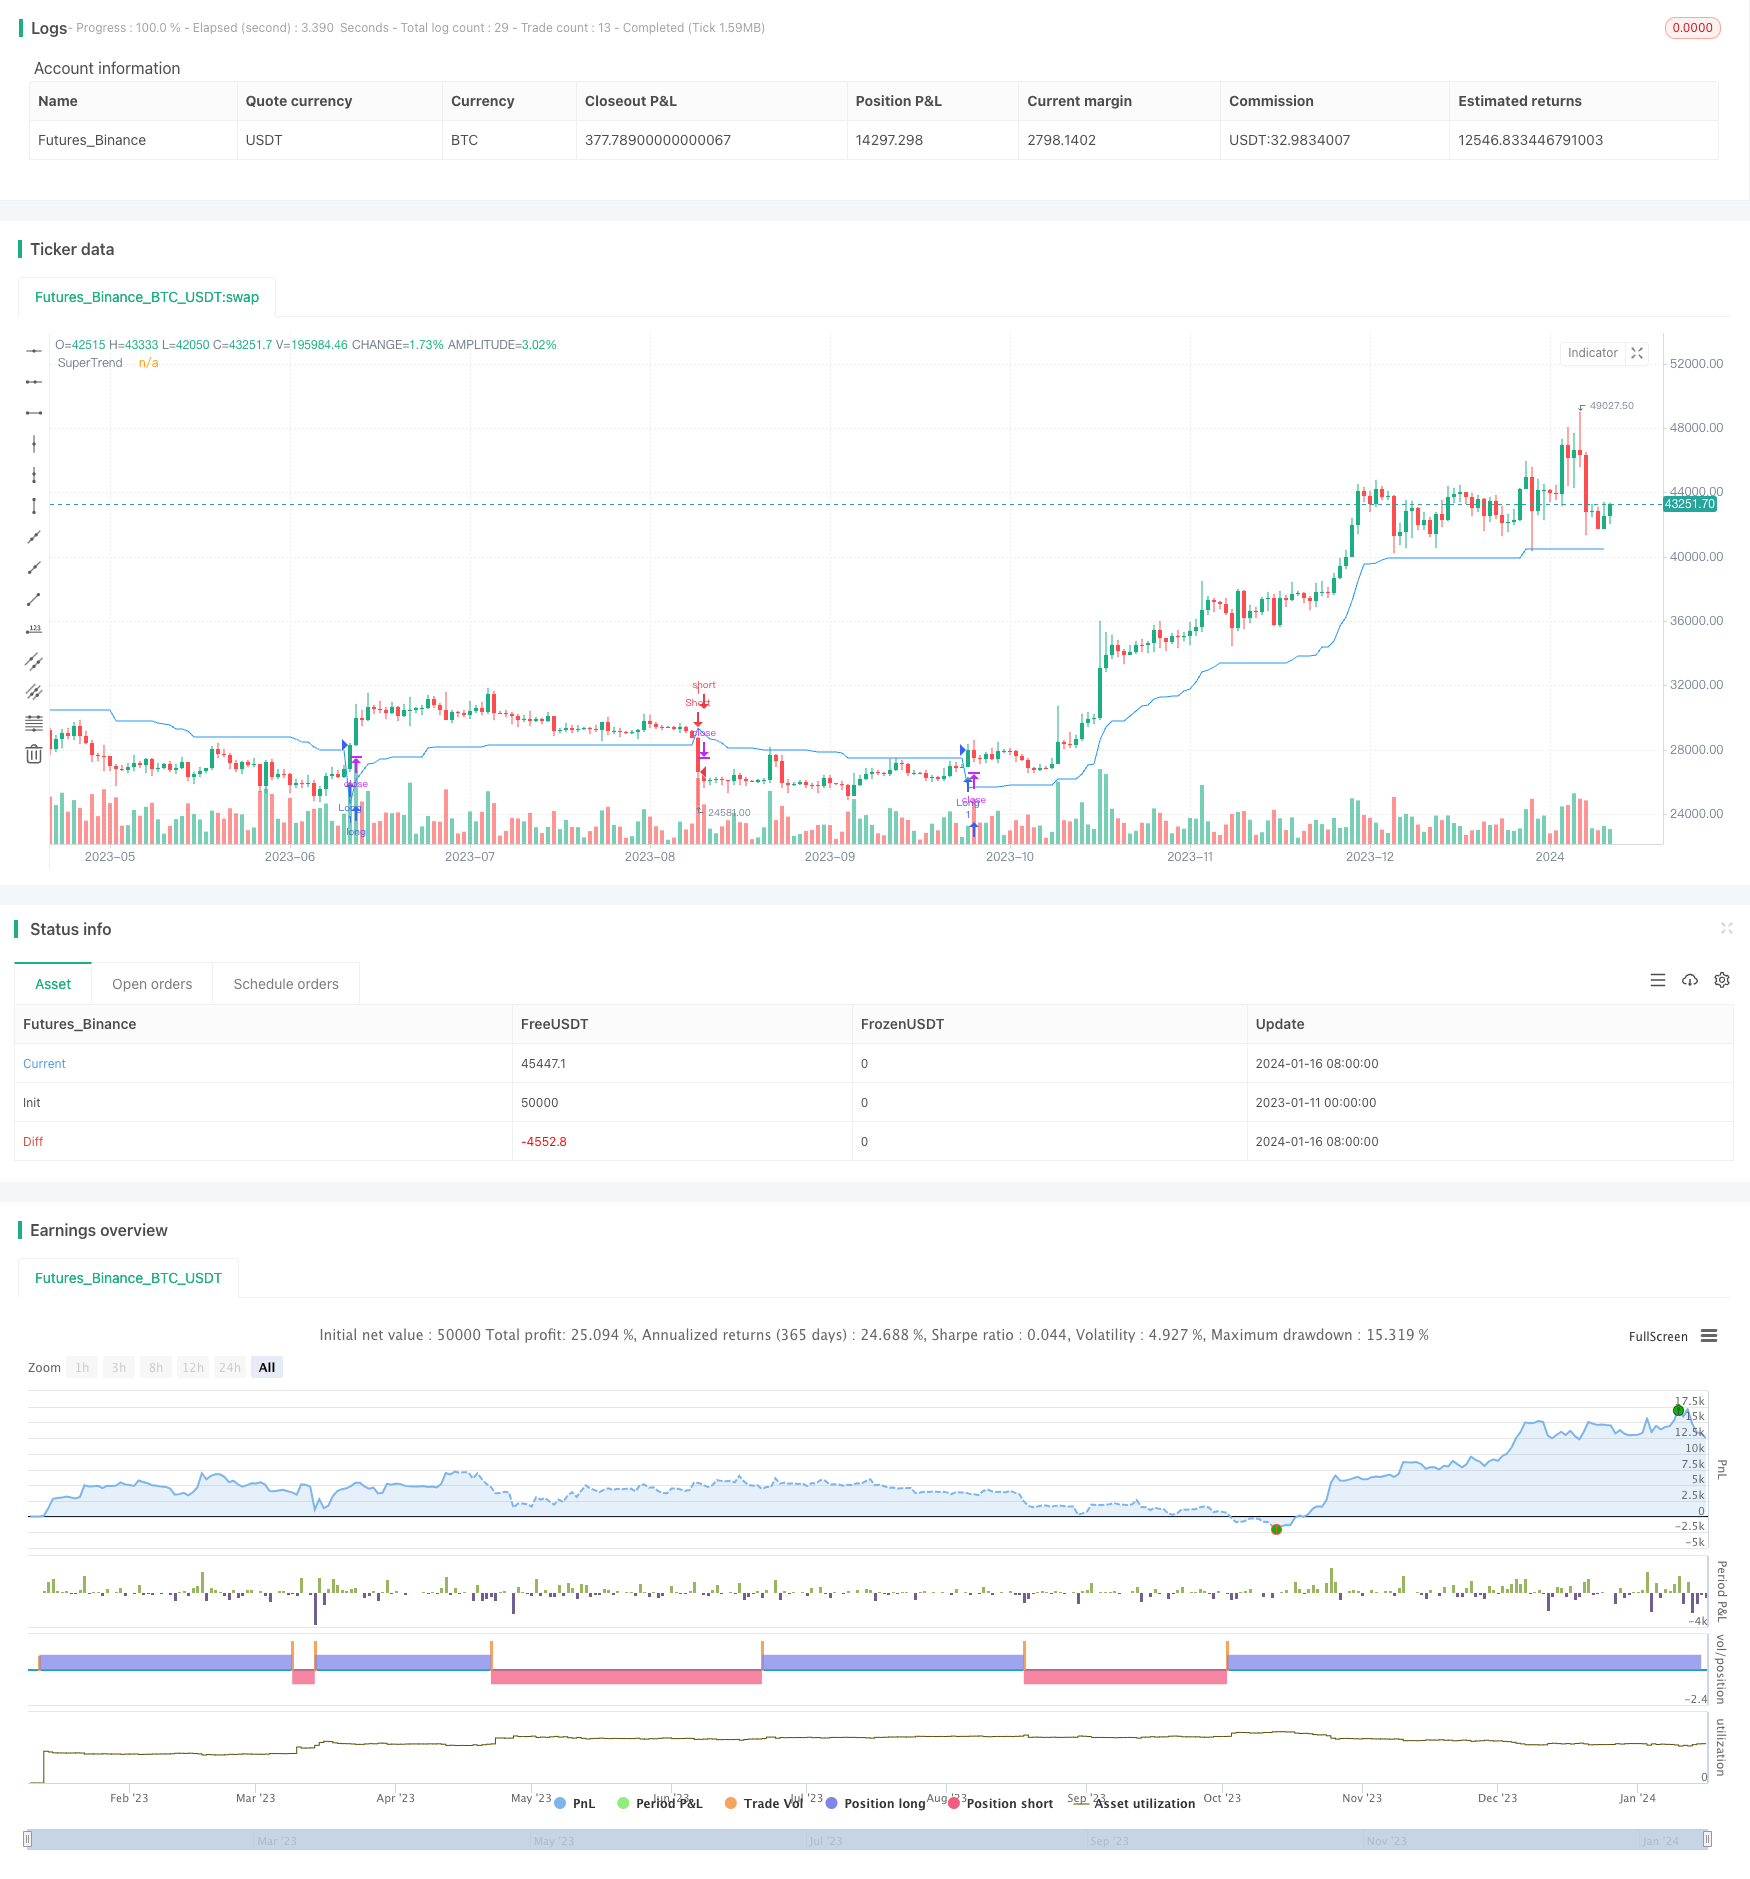
概述
本策略基于平均真实波幅(Average True Range, ATR)指标构建超趋势(SuperTrend)通道,根据价格突破超趋势通道生成买入和卖出信号。该策略结合了趋势跟踪和止损管理的优点,可以有效跟踪趋势方向。
策略原理
超趋势通道的上轨和下轨由以下公式计算:
上轨 = (最高价 + 最低价) / 2 + ATR(n) * 因子 下轨 = (最高价 + 最低价) / 2 - ATR(n) * 因子
其中,ATR(n)表示n天的平均真实波幅,因子是一个可调参数,默认为3。
当收盘价高于上轨时为看涨信号,当收盘价低于下轨时为看跌信号。策略根据看涨和看跌信号确定入市和出场。
优势分析
- 利用ATR指标根据市场波幅确定通道范围,可以有效跟踪趋势
- 结合通道突破判断入市时机,避免假突破
- 根据因子参数可以调整通道范围,适应不同波动率市场
- 整合趋势跟踪和止损管理优点
风险分析
- 因子参数设置不当可能导致获利不足或止损过密
- 市场震荡时,超趋势通道发出的交易信号频繁,可能产生过度交易
- 需要优化ATR周期参数与因子参数的匹配
风险解决方法:
- 针对不同市场调整因子参数,降低止损过密风险
- 增加条件过滤,避免震荡市产生频繁交易
- 综合考虑市场波动率、持仓时间等因素匹配ATR周期
优化方向
- 结合其他指标过滤信号,优化入场时机
- 增加移动止损跟踪,以锁定更多利润
- 不同品种、周期参数优化
- 优化ATR周期与因子参数的匹配
总结
本策略利用超趋势通道实现趋势跟踪和止损管理。ATR周期和因子参数的匹配对策略效果至关重要。下一步将从参数优化、信号过滤等方面进一步优化策略,使其能够适应更加复杂的市场环境。
策略源码
/*backtest
start: 2023-01-11 00:00:00
end: 2024-01-17 00:00:00
period: 1d
basePeriod: 1h
exchanges: [{"eid":"Futures_Binance","currency":"BTC_USDT"}]
*/

//@version=5
strategy("Supertrend Backtest", shorttitle="STBT", overlay=true)

// Input for ATR Length
atrLength = input.int(10, title="ATR Length", minval=1)
atrFactor = input.float(3.0, title="Factor", minval=0.01, step=0.01)

// Calculate SuperTrend
[supertrend, direction] = ta.supertrend(atrFactor, atrLength)
supertrend := barstate.isfirst ? na : supertrend

// Define entry and exit conditions
longCondition = ta.crossover(close, supertrend)
shortCondition = ta.crossunder(close, supertrend)

// Plot the SuperTrend
plot(supertrend, color=color.new(color.blue, 0), title="SuperTrend")

// Plot Buy and Sell signals
plotshape(series=longCondition, style=shape.triangleup, location=location.belowbar, color=color.green, size=size.small, title="Buy Signal")
plotshape(series=shortCondition, style=shape.triangledown, location=location.abovebar, color=color.red, size=size.small, title="Sell Signal")

// Strategy Entry and Exit
strategy.entry("Long", strategy.long, when=longCondition)
strategy.entry("Short", strategy.short, when=shortCondition)