概述
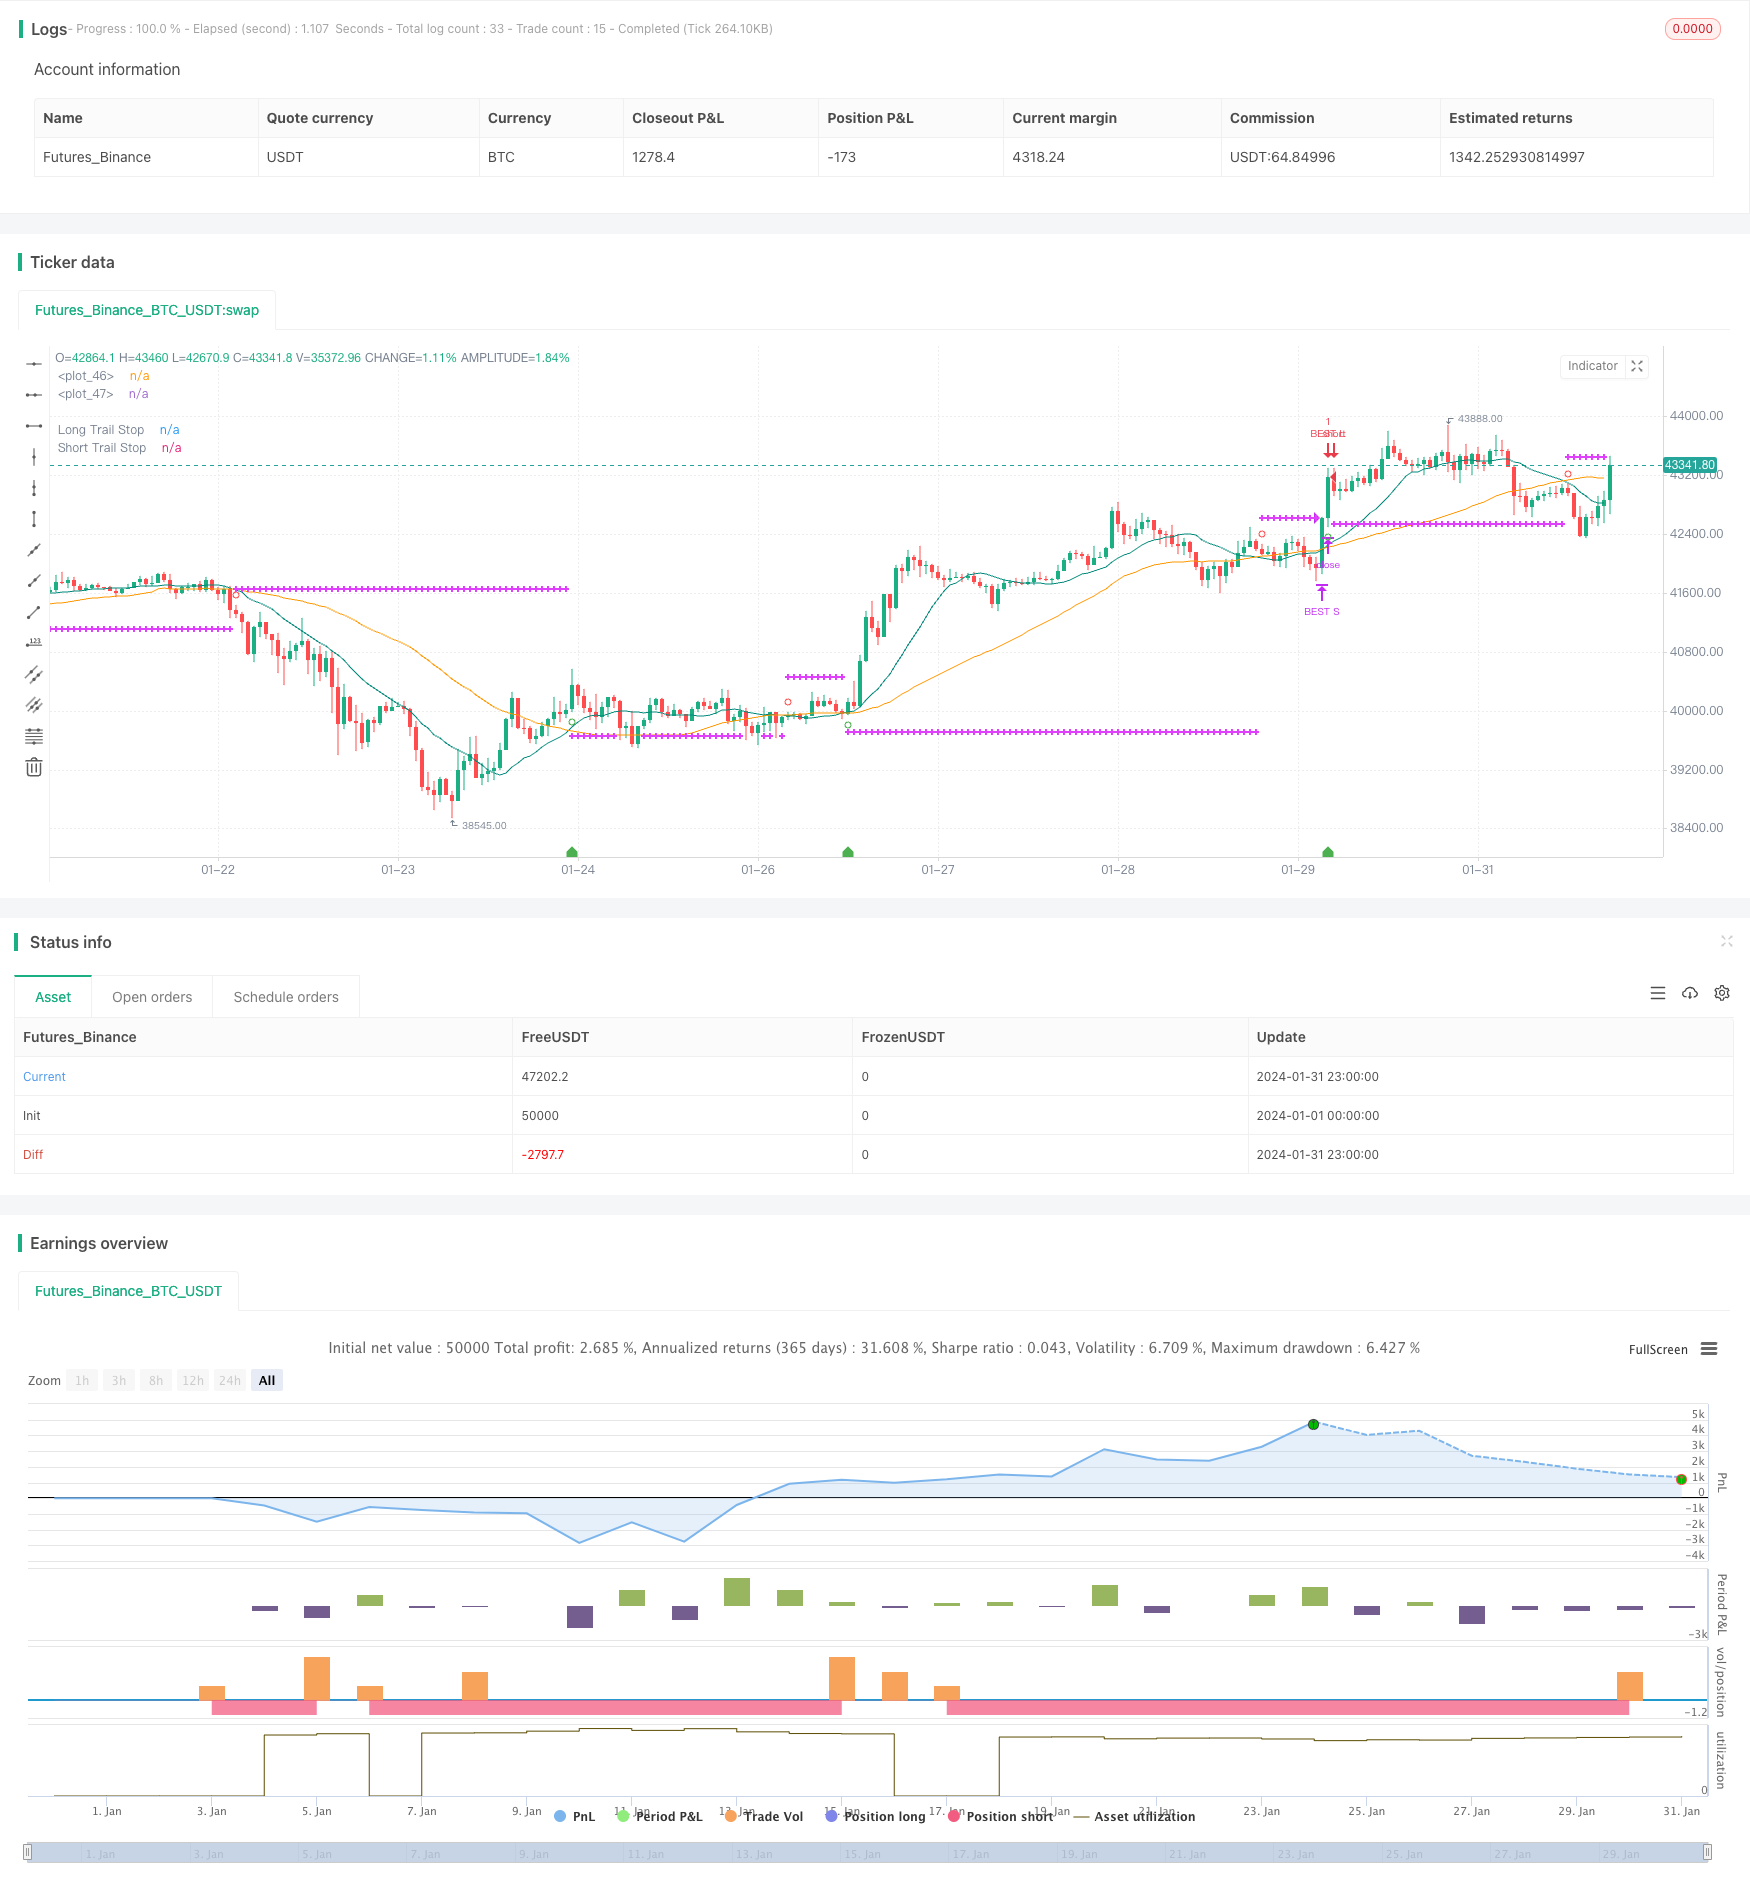
最佳ATR停损倍数策略是一种趋势跟踪策略,它使用平均真实波幅(ATR)的倍数来设置止损点,动态调整风险。当价格趋势变化时,它可以及时止损,避免巨额亏损。
策略原理
该策略首先计算快速SMA周期和慢速SMA周期的简单移动平均线,当快速SMA上穿慢速SMA时做多,当快速SMA下穿慢速SMA时做空。
入场后,它会实时监控ATR的数值。ATR表示过去一定周期内的平均波动幅度。该策略允许我们设置ATR的周期长度(默认14)和倍数(默认2)。系统会在入场时计算ATR值,然后乘以设置的倍数,作为止损距离。
例如,如果入场后ATR为50点,倍数设定为2,则止损距离为100点。如果价格随后运行超过100点,止损单会被触发。这可以及时止损,避免过大损失。
该策略同时考虑了趋势判断,只有当买入信号匹配趋势为上涨时,才会启用长仓止损。做空信号则与下跌趋势匹配时启用。
止损线会在图表上绘制,我们可以实时验证。当止损条件触发时,对应头寸也会被系统自动平仓。
优势分析
该策略最大的优势是动态调整止损距离,可以根据市场波动率变化自动修改风险敞口。当波动率扩大时,止损距离也会拉大,减小了止损被突破的概率。而低波动市场中,止损距离也会缩小。
相比固定止损距离,该方式可以在跟踪趋势的同时,有效控制单笔损失。它既保证了盈利空间,也注意了风险管理。
此外,结合趋势判断,这样的止损方式可以减少在盘整区域因震荡而被踢出的情况。
风险分析
该策略的主要风险在于,持仓期间价格短线拉回,触发止损单的风险。尤其是ATR周期过短时,止损距离无法完全过滤短期波动的影响。
另一个风险在于,在剧烈行情中,价格跳空运动可能直接突破止损线。这时需要设置更大的止损倍数,但也意味着减小了盈利空间。
最后,该策略并没有考虑夜盘和盘前交易对ATR值的影响。这可能导致在开盘或收盘时,策略计算的ATR数据不准确。
优化方向
该策略可以从以下几个方面进行优化:
优化ATR周期参数,测试不同市场下的最佳参数组合
比较固定倍数和动态变化倍数设置的收益率
结合夜盘和盘前数据计算ATR,减小开盘价格跳空的影响
设置ATR条件:仅在ATR达到一定水平后启用,可以避免低波动率市场的不必要止损
结合更多过滤条件:例如大级别趋势、量能指标等信息
总结
最佳ATR停损倍数策略通过动态调整止损距离,实现了趋势跟踪和风险控制之间的有效平衡。相比固定止损距离,它可以在保证盈利空间的同时,有效限制单笔损失。
当然,仍需要注意一些潜在风险,比如价格跳空、止损过于灵敏等情况。我们可以从多种层面继续优化,提升策略的稳定性和收益率。
/*backtest
start: 2024-01-01 00:00:00
end: 2024-01-31 23:59:59
period: 1h
basePeriod: 15m
exchanges: [{"eid":"Futures_Binance","currency":"BTC_USDT"}]
*/

//@version=4
//@author=Daveatt
//This source code is subject to the terms of the Mozilla Public License 2.0 at https://mozilla.org/MPL/2.0/

SystemName = "BEST ATR Stop Multiple Strategy"
TradeId = "BEST"

InitCapital = 100000
InitPosition = 100
InitCommission = 0.075
InitPyramidMax = 1
CalcOnorderFills = true
CalcOnTick = true
DefaultQtyType = strategy.fixed
DefaultQtyValue = strategy.fixed
Precision = 2
Overlay=true


strategy(title=SystemName, shorttitle=SystemName, overlay=Overlay )

fastSMAperiod = input(defval=15, title='Fast SMA', type=input.integer, minval=2, step=1)
slowSMAperiod = input(defval=45, title='Slow SMA', type=input.integer, minval=2, step=1)

src = close
// Calculate moving averages
fastSMA = sma(src, fastSMAperiod)
slowSMA = sma(src, slowSMAperiod)

// Calculate trading conditions
enterLong  = crossover(fastSMA, slowSMA)
enterShort = crossunder(fastSMA, slowSMA)

// trend states
since_buy  = barssince(enterLong)
since_sell = barssince(enterShort)
buy_trend  = since_sell > since_buy
sell_trend = since_sell < since_buy

is_signal = enterLong or enterShort

// get the entry price
entry_price = valuewhen(enterLong or enterShort, src, 0)

// Plot moving averages
plot(series=fastSMA, color=color.teal)
plot(series=slowSMA, color=color.orange)

// Plot the entries
plotshape(enterLong, style=shape.circle, location=location.belowbar, color=color.green, size=size.small)
plotshape(enterShort, style=shape.circle, location=location.abovebar, color=color.red, size=size.small)


///////////////////////////////
//======[ Trailing STOP ]======//
///////////////////////////////

// use SL?
useSL = input(true, "Use stop Loss")
// ATR multiple Stop
stop_atr_length         = input(14,title="ATR Length", minval=1, type=input.integer)
stop_atr_mult           = input(2,title="ATR Multiple", minval=0.05, step=0.1, type=input.float)

// Global STOP

stop_price = 0.0, stop_price := nz(stop_price[1])

// STOP ATR
var stop_atr      = 0.0
var entry_stop_atr   = 0.0

stop_atr          := nz(atr(stop_atr_length))

if enterLong or enterShort
    entry_stop_atr := stop_atr * stop_atr_mult

// display the ATR value multiple
plotshape(enterLong, title='ATR Long Stop value', style=shape.labelup,
 location=location.bottom, color=color.green, transp=0, text='', textcolor=color.navy, editable=true, size=size.small, show_last=1, size=size.small)

// var label atr_long_label = na
// var label atr_short_label = na
lapos_y_entry_up = lowest(30)
lapos_y_entry_dn = highest(30)

// text_label = "ATR value: " + tostring(stop_atr, '#.#') + "\n\nATR Multiple value: " + tostring(entry_stop_atr, '#.#')

// if enterLong

//     label.delete(atr_long_label)

//     atr_long_label := label.new(bar_index, lapos_y_entry_up, text=text_label,
//      xloc=xloc.bar_index, yloc=yloc.price, color=color.green, style=label.style_labelup, textcolor=color.white,
//      size=size.normal)

// if enterShort

//     label.delete(atr_short_label)

//     atr_short_label := label.new(bar_index, lapos_y_entry_dn, text=text_label,
//      xloc=xloc.bar_index, yloc=yloc.price, color=color.red, style=label.style_labeldown, textcolor=color.black,
//      size=size.normal)

// Determine trail stop loss prices
longStopPrice = 0.0, shortStopPrice = 0.0

longStopPrice := if useSL and buy_trend
    stopValue = entry_price - entry_stop_atr
else
    0

shortStopPrice := if useSL and sell_trend
    stopValue = entry_price + entry_stop_atr
else
    999999

//////////////////////////////////////////////////////////////////////////////////////////
//*** STOP LOSS HIT CONDITIONS TO BE USED IN ALERTS  ***//
//////////////////////////////////////////////////////////////////////////////////////////

cond_long_stop_loss_hit  = useSL and buy_trend and crossunder(low, longStopPrice[1])

cond_short_stop_loss_hit = useSL and sell_trend and crossover(high, shortStopPrice[1])


// Plot stop loss values for confirmation
plot(series=useSL and buy_trend and low >= longStopPrice
 ? longStopPrice : na,
 color=color.fuchsia, style=plot.style_cross,
 linewidth=2, title="Long Trail Stop")

plot(series=useSL and sell_trend and high <= shortStopPrice
 ? shortStopPrice : na,
 color=color.fuchsia, style=plot.style_cross,
 linewidth=2, title="Short Trail Stop")

close_long  = cond_long_stop_loss_hit
close_short = cond_short_stop_loss_hit

// Submit entry orders
strategy.entry(TradeId + " L", long=true, when=enterLong)
strategy.close(TradeId + " L", when=close_long)

//if (enterShort)
strategy.entry(TradeId + " S", long=false, when=enterShort)
strategy.close(TradeId + " S", when=close_short)