资源加载中... loading...

Momentum Breakout EMA Crossover Strategy

Author: ChaoZhang, Date: 2024-02-22 18:06:08
Tags:

img

Overview

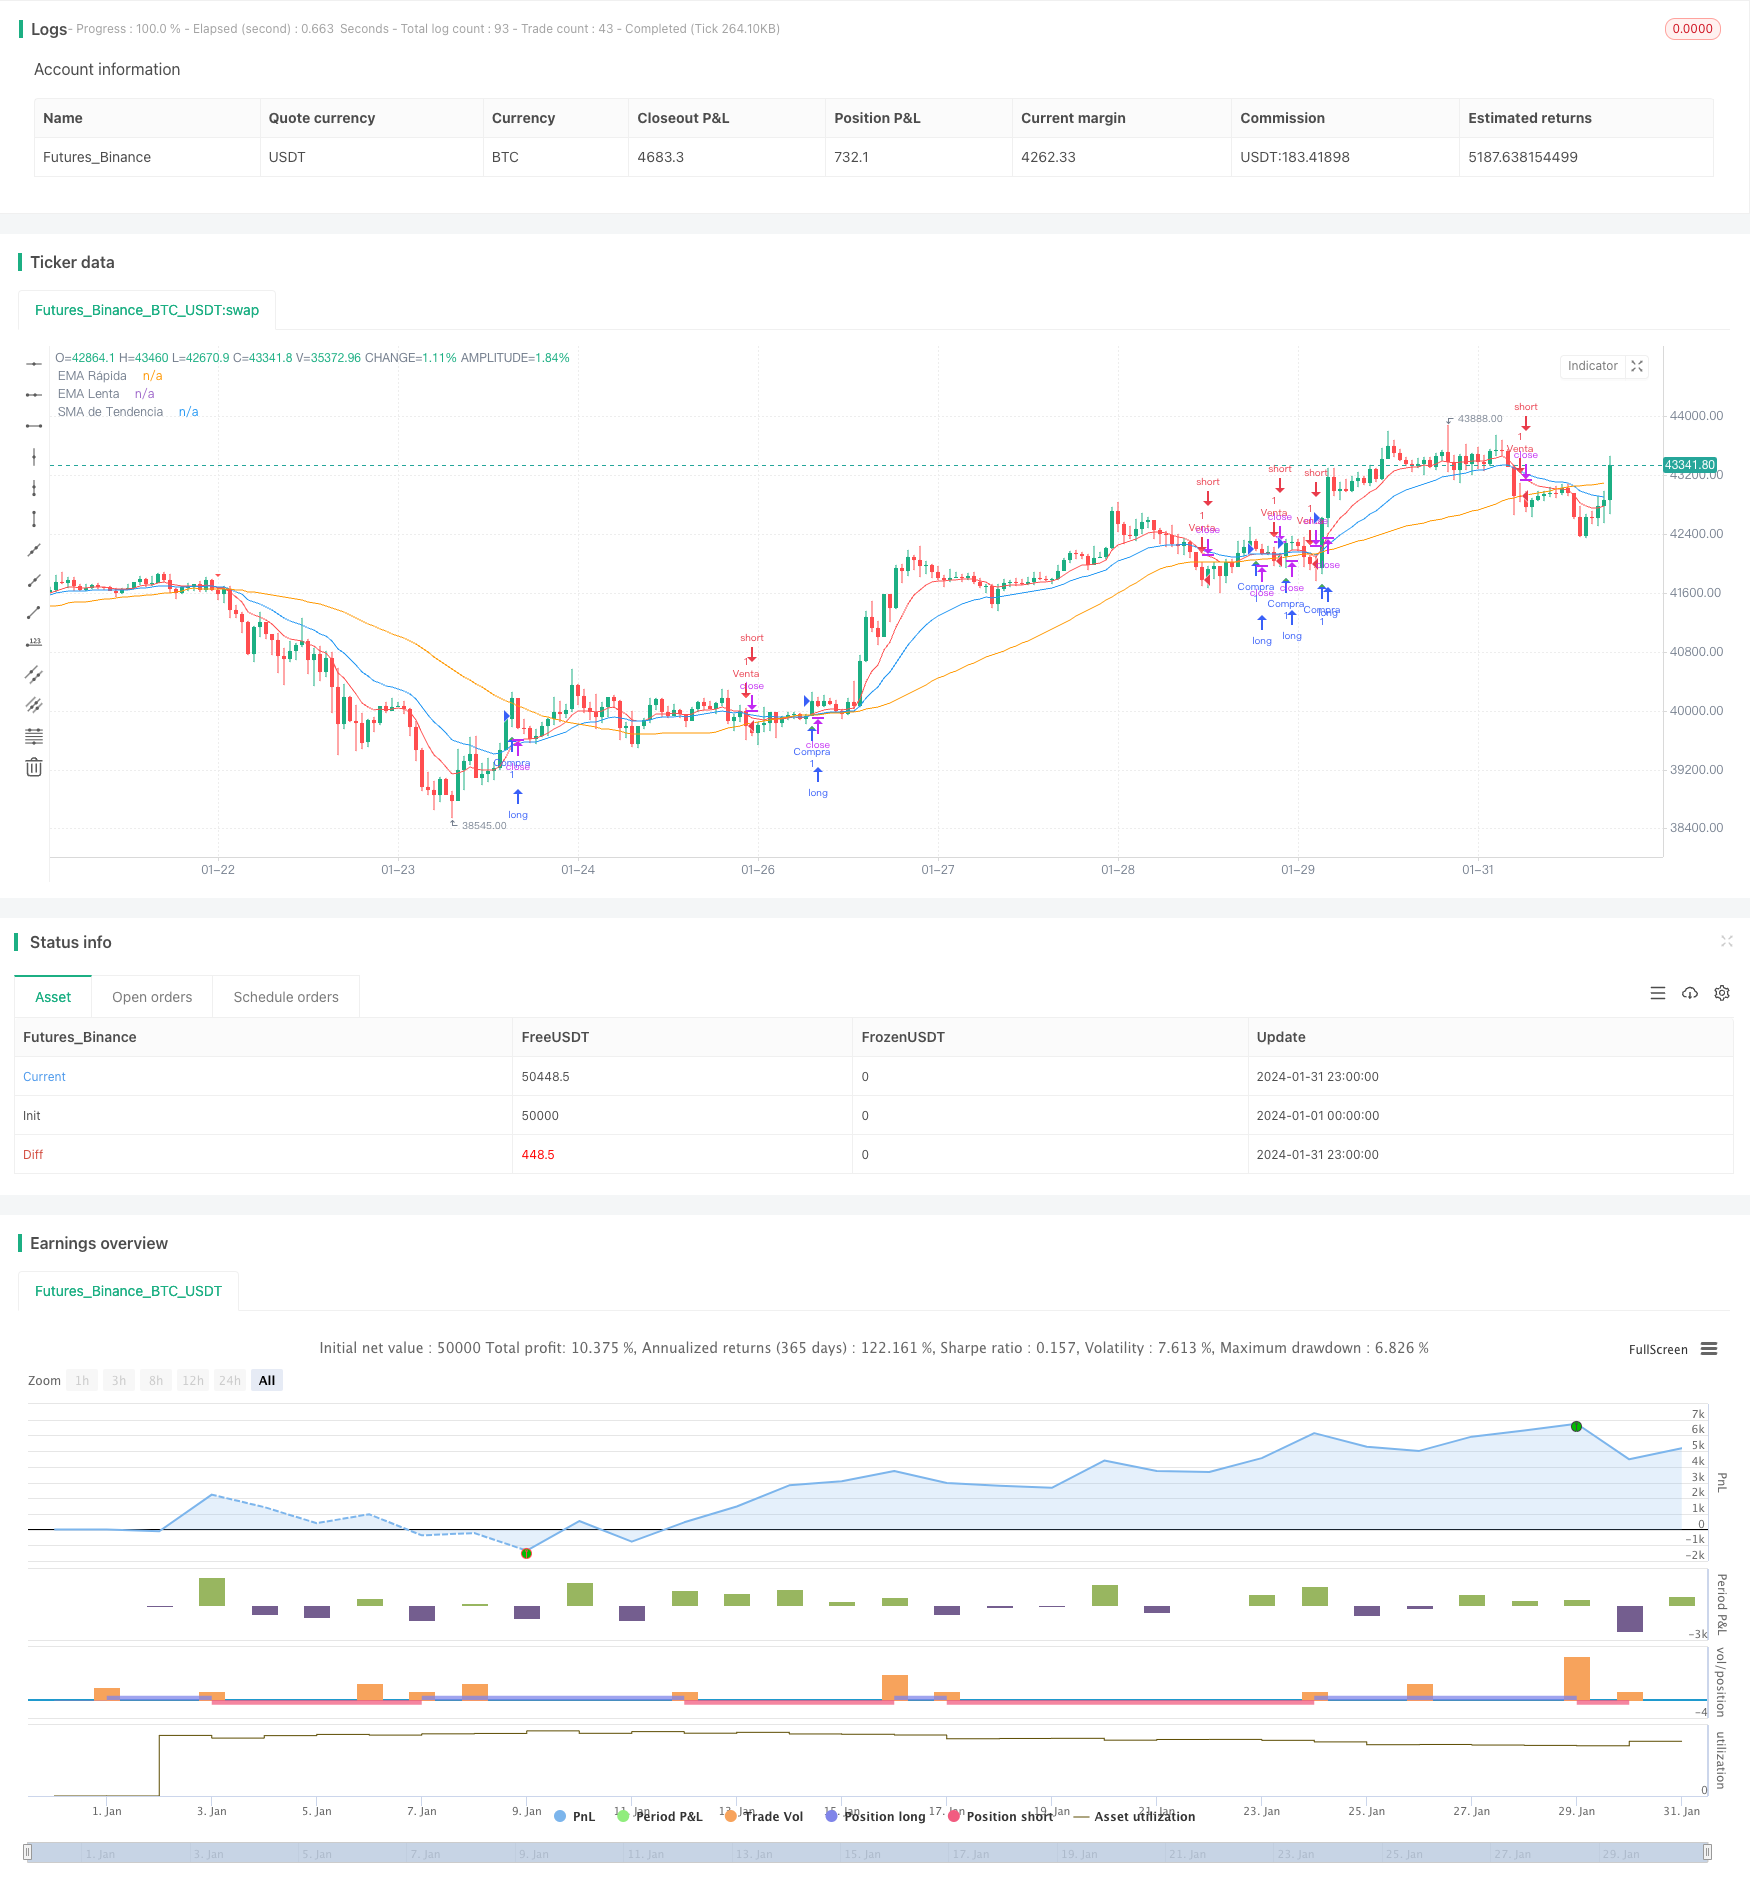
The momentum breakout EMA crossover strategy makes full use of the crossover signals between momentum indicators and moving averages to identify trend and reversal opportunities in stock prices. This strategy adopts the golden cross and death cross of the fast EMA line and slow EMA line to determine potential bullish and bearish opportunities in the market. In addition, this strategy also introduces the medium and long-term trend judgment indicator - the middle rail SMA indicator to filter the original EMA crossover signals to ensure that trading signals are generated only when the overall market trend direction is consistent.

Strategy Principle

The strategy consists of three main parts:

  1. Crossover operation of fast EMA line (9-day line) and slow EMA line (21-day line). The golden cross of EMA is a buy signal and the death cross is a sell signal. This part uses the EMA indicator to judge the trend and reversal of stock prices.

  2. Medium and long term trend judgment indicator: 50-day SMA indicator. This indicator reflects the medium and long term price movement and can be used to identify the overall trend direction.

  3. Momentum indicators: compare the closing price with the SMA middle rail to determine whether to issue a transaction signal as a momentum filtering condition. Trading signals are generated only when the closing price breaks through the middle rail in direction.

In implementation, this strategy takes the crossover of 9-day EMA and 21-day EMA as the basic judgment of buy/sell input signals. After that, when the signal is issued, check whether the closing price breaks through the 50-day SMA middle rail to determine the overall trend direction. Only when the basic trading signal is consistent with the overall trend direction, the actual buying and selling signals will be finally generated, and corresponding long or short positions will be established.

Advantages of the Strategy

  1. Can effectively identify trend opportunities in stock prices and capture accurate ups and downs in the medium and long term.

  2. With the help of momentum indicators, some noise and reversal signals can be effectively filtered to reduce unnecessary opening and closing of positions.

  3. The combination of EMA crossover and SMA filter can produce a relatively ideal steady profit model.

Risks of the Strategy

  1. In a shock pattern, EMA crossover signals may be too frequent, resulting in frequent trading and slippage losses.

  2. The parameter setting of the SMA middle rail indicator may be improper and fail to effectively confirm the medium-term trend.

  3. Improper selection of EMA and SMA parameters may result in delayed smoothing.

Solutions to Risks

  1. Optimize parameters to find the best parameter combination;

  2. Increase other indicators to verify signals and ensure signal quality;

  3. Properly adjust position management to control single transaction risk.

Optimization Directions

  1. Test more parameter combinations to find the optimal parameters;

  2. Increase price breakthrough, volume and other conditions to determine the trend;

  3. Try different MA indicators such as KDJ, MACD to judge potential trends;

  4. Optimize position management methods to further control drawdowns through risk management.

Conclusion

In the momentum breakout EMA crossover strategy, EMA crossover is the basis signal, and the comparison between the SMA middle rail and the price relationship serves as a confirmation filter. This idea takes full advantage of the benefits of combined use of indicators to improve signal quality. It effectively solves the problem of too many reversal signals that occur when EMAs are used alone. The strategy strikes a good balance between capturing trend opportunities and identifying reversal opportunities, achieving optimization of the profit model. Further in-depth optimization can be done in areas such as parameter selection and portfolio and position management.


/*backtest
start: 2024-01-01 00:00:00
end: 2024-01-31 23:59:59
period: 1h
basePeriod: 15m
exchanges: [{"eid":"Futures_Binance","currency":"BTC_USDT"}]
*/

//@version=5
strategy("Estrategia EMA Cruzada con Filtro de Tendencia", overlay=true)

// Configuración de EMAs
fastLength = input(9, title="Longitud EMA Rápida")
slowLength = input(21, title="Longitud EMA Lenta")
emaFast = ta.ema(close, fastLength)
emaSlow = ta.ema(close, slowLength)

// Configuración del filtro de tendencia
trendSMA = ta.sma(close, 50)

// Condiciones de entrada mejoradas con filtro de tendencia
longCondition = ta.crossover(emaFast, emaSlow) and close > trendSMA
shortCondition = ta.crossunder(emaFast, emaSlow) and close < trendSMA

// Ejecutar entradas y salidas
if (longCondition)
    strategy.entry("Compra", strategy.long)
if (shortCondition)
    strategy.entry("Venta", strategy.short)

// Dibujar EMAs y SMA en el gráfico
plot(emaFast, color=color.red, title="EMA Rápida")
plot(emaSlow, color=color.blue, title="EMA Lenta")
plot(trendSMA, color=color.orange, title="SMA de Tendencia")

// Indicadores visuales para las señales de compra y venta
plotshape(series=longCondition, title="Señal de Compra", location=location.belowbar, color=color.green, style=shape.triangleup, size=size.small)
plotshape(series=shortCondition, title="Señal de Venta", location=location.abovebar, color=color.red, style=shape.triangledown, size=size.small)


More