Trading strategy development experience
 0
1571
0
1571
The purpose of this article is to describe some experience in strategy development, as well as some tips, which will allow readers to quickly grasp the key point of trading strategy development.
When you encounter similar details in some strategy design, you can immediately come up with a reasonable solution.
We use the FMZ Quant platform as a example for explanation, testing, and practice.
Strategy Programming Language we will use JavaScript
For trading target, we take the blockchain asset market (BTC, ETH, etc.) as our object
Data acquisition and processing
Usually, depending on the strategy logic, it may use the following different interfaces to obtain market data, most strategy logics are driven by market data (of course, some strategies are not care about the price data, such as a fixed investment strategy).
GetTicker: Get real-time tick quotes. Generally used to quickly get the current latest price, “Buying 1” price, “Selling 1” price.
GetDepth: Get the order depth of the order book. Generally used to obtain the price of each layer of the order book depth and the size of pending orders. Used for hedging strategies, market making strategies, etc.
GetTrade: Get the latest transaction record of the market. Generally used to analyze market behavior in a short cycle of time and analyze microscopic changes in the market. Usually used for high frequency strategies and algorithm strategies.
GetRecords: Get market K-line data. Usually used for trend tracking strategies and to calculate indicators.
Fault tolerance
When designing the strategy, the beginner usually ignores the various errors and intuitively believes that the results of each part in the strategy are established. But that is not true, in the operation of the strategy program, when requesting market data, you will encounter various unexpected situations.
For example, some market interfaces return unexecuted data:
var depth = exchange.GetDepth()

// depth.Asks[0].Price < depth.Bids[0].Price "Selling 1" price is lower than "buying 1" price, this situation cannot exist on the market.
// Because the selling price is lower than the buying price, the order must have been executed.
// depth.Bids[n].Amount = 0 Order book buying list "nth" layer, order quantity is 0
// depth.Asks[m].Price = 0 Order book selling list "mth" layer, the order price is 0
Or directly exchange.GetDepth() returns a null value.
There are many such strange situations. Therefore, it is necessary to deal with these foreseeable problems. Such a treatment scheme is called fault-tolerant processing.
The normal way to handle faults is to discard data and reacquire it.
E.g:
function main () {
     while (true) {
         onTick()
         Sleep(500)
     }
}

function GetTicker () {
     while (true) {
         var ticker = exchange.GetTicker()
         if (ticker.Sell > ticker.Buy) { // Take the example of fault-tolerant processing that detects whether the "Selling 1" price is less than the "Buying 1" price.
                                               // Exclude this error, the current function returns "ticker".
             Return ticker
         }
         Sleep(500)
     }
}

function onTick () {
     var ticker = GetTicker() // Make sure the "ticker" you get doesn't exist the situation that "Selling 1" price is less than the "Buying 1" price.
     // ... specific strategy logic
}
A similar approach can be used for other foreseeable fault-tolerant processes.
The design principle is that you can never using the wrong logic to drive the strategy logic.
Use of K-line data
K line data acquisition, call:
var r = exchange.GetRecords()
The obtained K line data is an array, such as this:
[
    {"Time":1562068800000,"Open":10000.7,"High":10208.9,"Low":9942.4,"Close":10058.8,"Volume":6281.887000000001},
    {"Time":1562072400000,"Open":10058.6,"High":10154.4,"Low":9914.5,"Close":9990.7,"Volume":4322.099},
    ...
    {"Time":1562079600000,"Open":10535.1,"High":10654.6,"Low":10383.6,"Close":10630.7,"Volume":5163.484000000004}
]
You can see that each curly brace {} contains time, opening price, highest price, lowest price, closing price, and volume.
This is a K line bar. General K-line data is used to calculate indicators such as moving averages, MACD and so on.
The K-line data is passed as a parameter (raw material data), and then the indicator parameters are set to calculate the function of the indicator data, which we call the indicator function.
There are lots of indicator functions on the FMZ Quant quantitative trading platform.
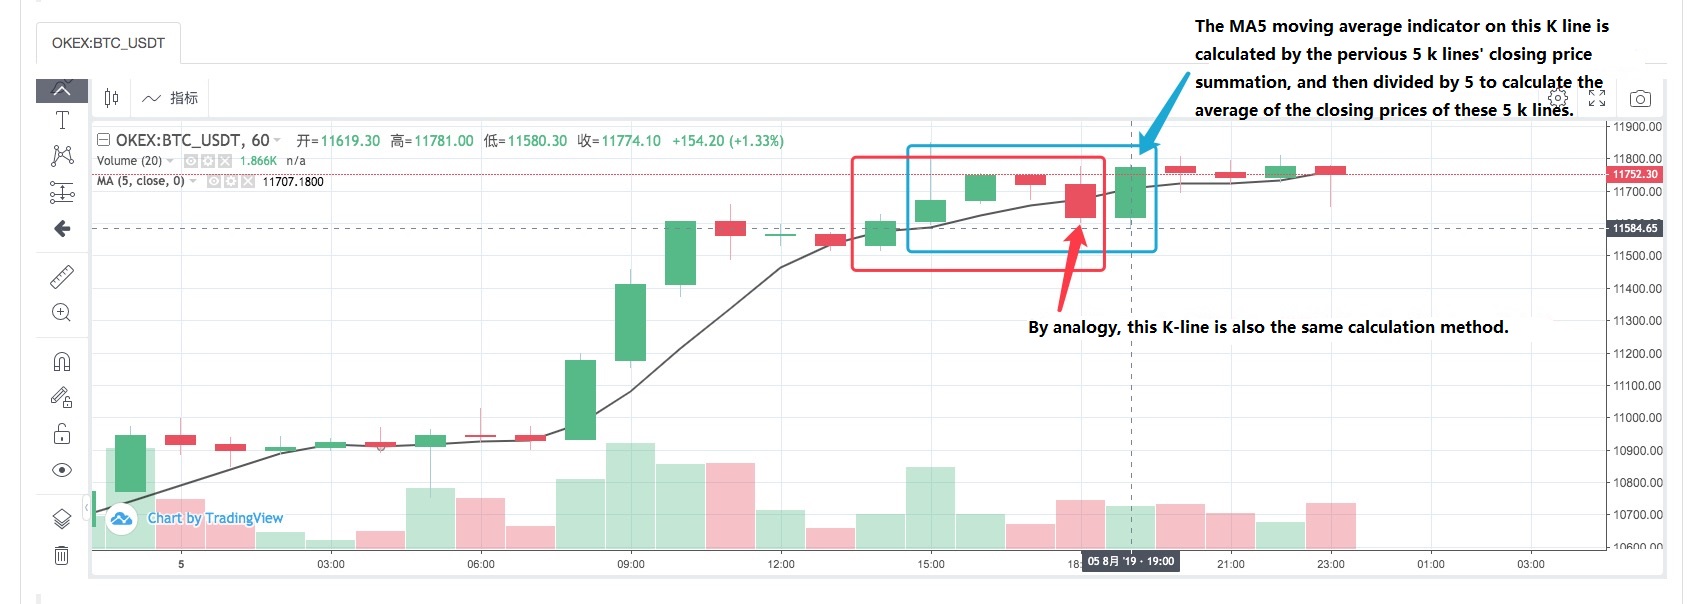
For example, we calculate the moving average indicator. According to the cycle of the passed K-line data, we calculate the moving average of the corresponding cycle.
For example, the passing K-line data (one K-line bar represents one day), calculates the daily average line, the same thing, if the K-line data of the passing average indicator function is a 1-hour cycle, then the calculated indicator is the 1-hour moving average.
Usually we often ignore a problem when calculating the indicator. If I want to calculate the 5-day moving average indicator, then we first prepare the daily K-line data:
var r = exchange.GetRecords(PERIOD_D1) // Pass parameters to the "GetRecords" function "PERIOD_D1" specifies the day K line to be acquired.
                                       // Specific function using method can be seen at: https://www.fmz.com/api#GetRecords
With the daily K-line data, we can calculate the moving average indicator. if We want to calculate the 5-day moving average, then we have to set the indicator parameter of the indicator function to 5.
var ma = TA.MA(r, 5) // "TA.MA()" is the indicator function used to calculate the moving average indicator. The first parameter sets the daily K-line data r just obtained.
                             // The second parameter is set to 5. The calculated 5-day moving average is the same as the other indicators.
We have overlooked a potential problem. If the number of K line bar in the K-line data is less than 5, what can we do to calculate a valid 5-day moving average?
The answer is nothing you can do.
Because the moving average indicator is the average of the closing prices of a certain number of K-line bars.
Therefore, before using the K-line data and the indicator function to calculate the indicator data, it is necessary to determine whether the number of K-line bars in the K-line data satisfies the conditions for the indicator calculation (indicator parameters).
So before calculating the 5-day moving average, you have to check it first. The complete code is as follows:
function CalcMA () {
     var r = _C(exchange.GetRecords, PERIOD_D1) // _C() is a fault-tolerant function, the purpose is to avoid r being null, you can get more information at: https://www.fmz.com/api#_C
     if (r.length > 5) {
         Return TA.MA(r, 5) // Calculate the moving average data with the moving average indicator function "TA.MA", return it as a function return value.
     }

     Return false
}

function main () {
     var ma = CalcMA()
     Log(ma)
}
Backtest display:
[null,null,null,null,4228.7,4402.9400000000005, ... ]
You can see the calculated 5-day moving average indicator. The first four are null, because the number of K-line bars are less than 5, and the average cannot be calculated. When you reach the 5th K-line bar, you can calculate it.
Tips for judging the K-line updates
When we writing the strategy, often have such a scenario, such as the strategy need to process some operations when each K-line cycle is completed, or print some logs.
How do we implement such functions? For beginners who have no programming experience, it may be a troublesome problem. Here we give you the solutions.
How to judge a K-line bar cycle is completed. We can start with the time attribute in the K-line data. Each time we get the K-line data, we will judge the time attribute of the last K-line bar of this K-line data changing or not. If it is changed, it means that there is a new K-line bar generated (proving that the previous K-line bar cycle of the newly generated K-line bar is completed), if there is no change, it means no new K-line bar is generated (the current last K-line bar cycle has not yet been completed).
So we need a variable to record the time of the last K-line bar of the K-line data.
var r = exchange.GetRecords()
var lastTime = r[r.length - 1].Time // "lastTime" used to record the last K-line bar time.
In practice, this is usually the case:
function main () {
     var lastTime = 0
     while (true) {
         var r = _C(exchange.GetRecords)
         if (r[r.length - 1].Time != lastTime) {
             Log ("New K-line bar generated")
             lastTime = r[r.length - 1].Time // Be sure to update "lastTime", this is crucial.

             // ... other processing logic
             // ...
         }

         Sleep(500)
     }
}
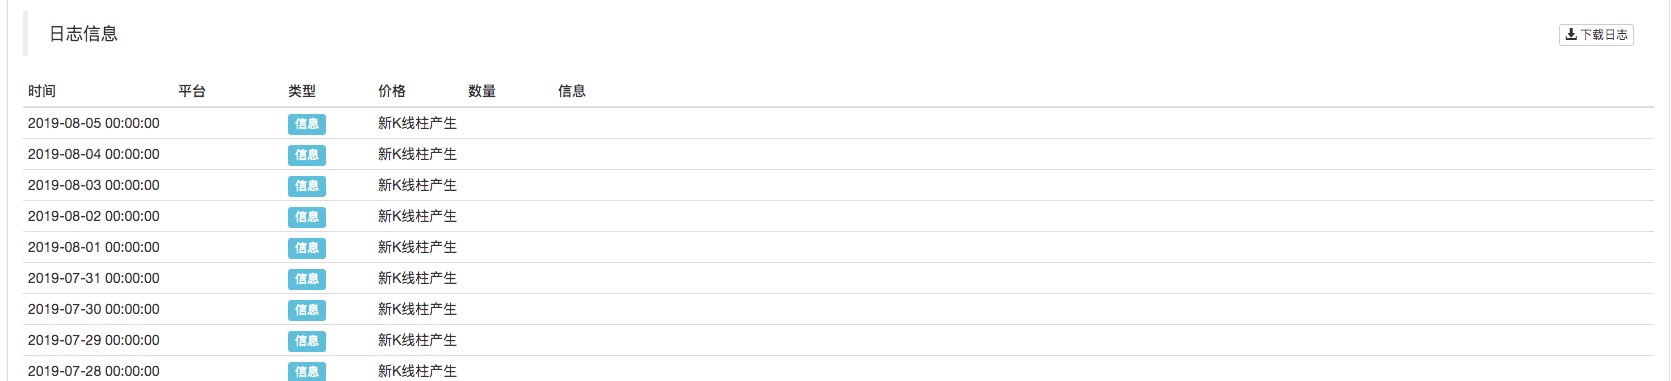
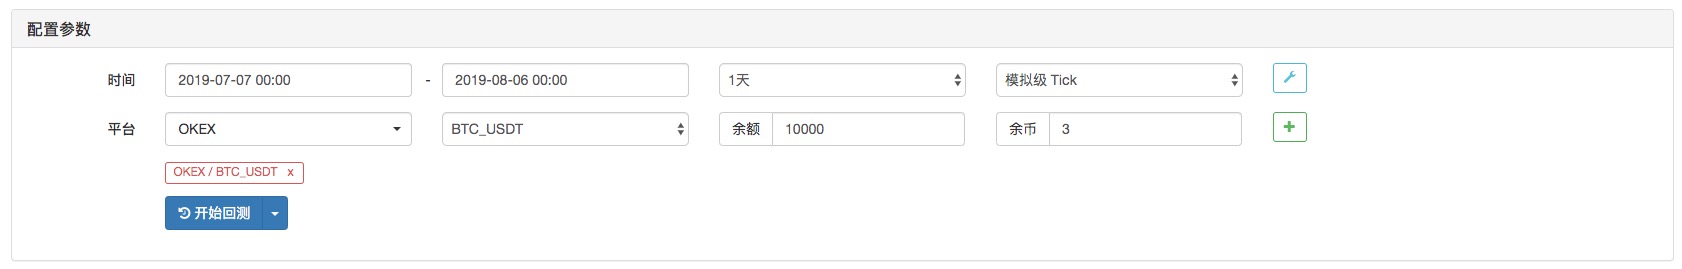
You can see that in the backtest, the K line cycle is set to the daily (the parameter is not specified when the exchange.GetRecords function is called, and the K line cycle set according to the backtest is the default parameter). Whenever the new K-line bar appears, it prints a log.
Numeral Value Calculations
- Calculate the time spent accessing the exchange interface
If you want to have a certain display or control over the time it takes for the strategy to access the exchange’s interface, you can use the following code:
function main () {
     while (true) {
         var beginTime = new Date().getTime()
         var ticker = exchange.GetTicker()
         var endTime = new Date().getTime()

         LogStatus(_D(), "GetTicker() function time-consuming:", endTime - beginTime, "millisecond")
         Sleep(1000)
     }
}
Simply put, the timestamp recorded after calling the GetTicker function is subtracted from the timestamp before the call, and the number of milliseconds experienced is calculated, that is, the time taken by the GetTicker function from execution to return.
- Use “Math.min / Math.max” to limit the upper and lower limits of the value
For example, in the process of placing a selling order, the amount of the selling order must not be greater than the number of coins in the account. Because if it is greater than the number of coins available in the account, the order will cause errors.
We control it like this:
For example, we plan to short sell 0.2 coins.
var planAmount = 0.2
var account = _C(exchange.GetAccount)
var amount = Math.min(account.Stocks, planAmount)
This ensures that the number of orders placed will not exceed the number of coins available in the account.
For the same reason, Math.max is used to ensure the lower limit of a value.
- What kind of scene does this usually apply to?
Generally, normal exchange has a minimum sending order limit for certain trade pairs. If it is lower than the minimum amount, the order will be rejected. This will also cause the program failure.
Assuming that the BTC usually has a minimum placing order quantity of 0.01.
Trading strategies can sometimes result in less than 0.01 order quantities, so we can use Math.max to ensure the minimum order quantity.
- Order quantity, price precision control
Precision can be controlled using the _N() function or the SetPrecision function.
The SetPrecision() function only need set once, and the number of decimal places in the order quantity and price value is automatically truncated in the system.
The _N() function is to perform decimal point truncation (precision control) for a certain value.
E.g:
var pi = _N(3.141592653, 2)
Log(pi)
The value of pi is truncated by the decimal place, and 2 decimal places are reserved, which is: 3.14
See the API documentation for details.
Some logic settings
- Timing, perform some operations for a certain period of time
You can use such a mechanism to use the timestamp detection method to determine the current timestamp minus the timestamp of the last time the scheduled task was executed, and calculate the elapsed time in real time. When the elapsed time exceeds a certain set time length. After that, a new operation is performed.
For example, used in a fixed investment strategy.
var lastActTime = 0
var waitTime = 1000 * 60 * 60 * 12 // number of milliseconds a day
function main () {
     while (true) {
         var nowTime = new Date().getTime()
         if (nowTime - lastActTime > waitTime) {
             Log ("Execution Fixed")
             // ... specific fixed investment operation, buying operation.


             lastActTime = nowTime
         }

         Sleep(500)
     }
}
This is a simple example.
- Design an automatic recovery mechanism for the strategy
Using the FMZ Quant _G() function, and exiting the save function, it is convenient to design a strategy to exit the saving progress and restart the automatic recovery state.
var hold = {
     Price : 0,
     Amount : 0,
}

function main () {
     if (_G("hold")) {
         var ret = _G("hold")
         hold.price = ret.price
         hold.amount = ret.amount
         Log("restore hold:", hold)
     }

     var count = 1
     while (true) {
         // ... strategy logic
         // ... In the strategy operation, it is possible that when opening a position, then assign the position price of the open position to "hold.price", and the amount of open positions is assigned to "hold.amount" to record the position information.

         hold.price = count++ // simulate some values
         hold.amount = count/10 // Simulate some values

         Sleep(500)
     }
}

function onexit () { // Click the stop button on the robot to trigger the execution of this function. After the execution, the robot stops.
     _G("hold", hold)
     Log("save hold:", JSON.stringify(hold))
}
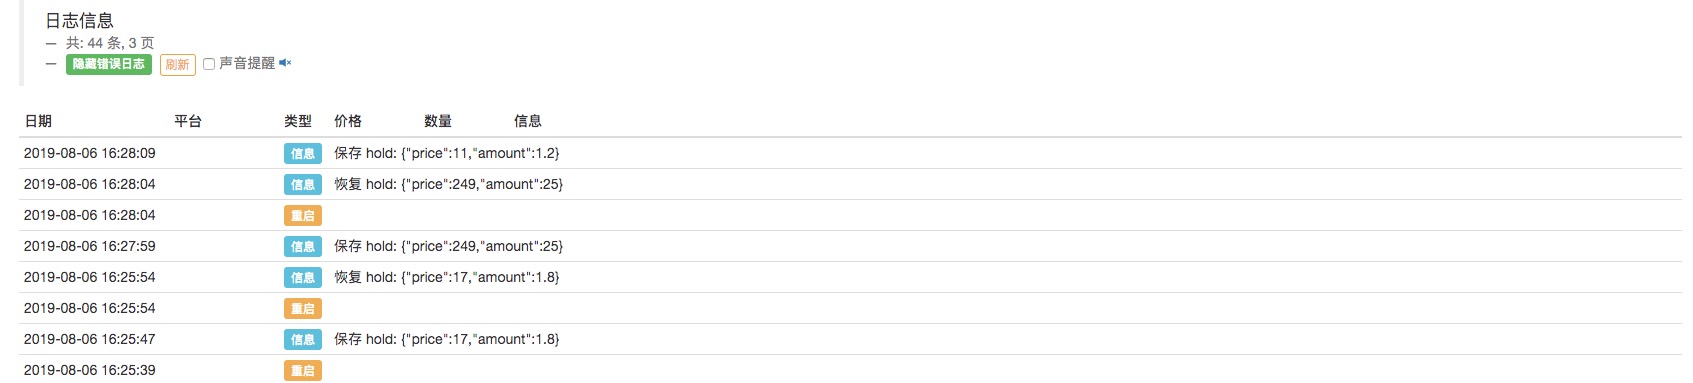
It can be seen that the data in the hold object is saved each time the robot is stopped. and when each time the data is restarted, the data is read and the value of the hold is restored to the state before the stop.
Of course, the above is a simple example. If it is used in an actual trading strategy, it should be designed according to the key data that needs to be restored in the strategy (generally are account information, position, profit value, trading direction and so on.).
Futhermore, you can also set some other conditions to restore.
These are some tips for developing a trading strategies, and I hope it could help beginners!
Hands-on practice training is the fastest way to improve oneself! I wish you all good luck.
- Parabolic Steering SAR and Price High and Low Point Strategy
- 工欲善其事必先利其器-学习使用研究环境分析交易原理
- Teach you how to let an old strategy docking the websocket quotes interface
- Similarities and differences between commodity futures and cryptocurrency exchanges API
- 手把手教你如何给一个老旧策略无缝对接websocket行情接口
- Multi-level percentage take profit strategy
- 商品期货与数字货币交易所API的异同
- Application of the K-line shadow part in trading strategy
- Cryptocurrency quantitative trading strategy exchange configuration
- Tick-level transaction matching mechanism developed for high-frequency strategy backtesting
- K line data processing in quantitative trading
- 数字货币量化交易策略交易所配置详解
- "C++ version of OKEX futures contract hedging strategy" that takes you through hardcore quantitative strategy
- 机器学习技术在交易中的应用
- 带你学习硬核策略 之 「C++ 版 OKEX合约对冲策略」
- 实现有序排列的多空均衡权益策略
- 根据数据驱动技术进行配对交易
- 量化分析数字货币市场
- 用Python实现一个Dual Thrust数字货币量化交易策略
- 程序化交易中的K线数据处理浅谈