Commodity "futures and spots" Arbitrage Chart Based on FMZ Fundamental Data
 0
1049
0
1049
Summary
Some people may be unfamiliar with the word “arbitrage”, but “arbitrage” is very common in real life. For example, the owner of a convenience store buys a bottle of mineral water from the wholesale market for 0.5 yuan, then sells it in the store for 1 yuan, and finally earns a difference of 0.5 yuan. This process is actually similar to arbitrage. Arbitrage in financial markets is similar to this principle, except that there are many forms of arbitrage.
What is arbitrage
In the commodity futures market, in theory, the price of the Apple contract delivered in May minus the price of the Apple contract delivered in October, the result should be close to 0 or stable within a certain price range. But in fact, due to weather, market supply and demand and other factors, the price of short-term and long-term contracts will be affected to varying degrees over a period of time, and the price difference will also fluctuate significantly.
But in any case, the price difference will eventually return to a certain price range, then if the price difference is greater than this range, sell short the May contract, and buy long the October contract at the same time, short the difference to make a profit; if the price difference is less than this range, buy long May contract, at the same time sell short October contract, make a profit of buying long the spread. This is the intertemporal arbitrage through buying and selling the same variety but different delivery months.
In addition to intertemporal arbitrage, there are cross-market arbitrage such as buying soybeans from exporting countries while selling soybeans from importing countries, or selling soybeans from exporting countries and importing soybeans from importing countries; buying upstream raw materials, iron ore, and selling downstream finished thread Steel, or sell the upstream raw material iron ore while buying downstream finished rebar arbitrage, etc.
What is “futures and spots” arbitrage
Although the above arbitrage methods are literally “arbitrage”, they are not purely arbitrage. they are essentially risky speculation. This way of speculation is to make profit by buying long or selling short the price spreads. Although the spread has stabilized for most of the time, there may be a market situation that the price spread does not return for a long time.
The core principle of “futures and spots” arbitrage is that the same commodity can only have one price at the same time point. Futures will become a spot when the delivery time is reached, so a price return will be forced when the contract delivery time is near. This is completely different from intertemporal arbitrage. The intertemporal arbitrage is a contract with two different delivery months. When it expires, it becomes the spot of two different months. Or it can be two prices.
- Spread = Futures price - Spot price
The biggest feature of “futures and spots” arbitrage is that there is no risk in theory, mainly based on the spread of the state to calculate the profit range. If the spread is too large, you can long the spot and short the futures at the same time, wait for the spread to return to zero, you can close the position on both sides of the futures and spot, and earn a profit from the spread. There are two main methods: “double close position” arbitrage and “contract delivery” arbitrage.
Commodity “futures and spots” arbitrage channel
To put it simply, the most complicated link is spot trading of commodities, which involves a series of issues such as warehouse receipts, taxation and so on. First of all, a company related to the investment scope is needed. If it is a contract delivery arbitrage futures account, it must be a corporate legal person. If double close position arbitrage is needed, a reliable sales channel is needed. There are many online spot trading websites.
It should be noted that spot transactions usually have a value-added tax of 17% to 20%, so if it is a double close position arbitrage, you need to short futures 1.2 to 1.25 times after buying spot. In the case of contract delivery arbitrage, you need to short the same proportion of futures after buying the spot, and you also need to consider the costs of transaction fees, transportation, and warehouses. Of course, the premise of all this is that the current price spread is large enough and there are enough boundaries.
In addition, due to the existence of gold (T+D) on the Shanghai Gold Exchange, the current arbitrage in the gold period can not only be positive arbitrage, but also reverse arbitrage operations without gold leasing. The deferred trading of spot gold (T+D) on the Shanghai Gold Exchange is not only convenient to trade, but also has a large volume of transactions and positions, and liquidity is very suitable for “futures and spots” arbitrage.
How to obtain spot and spread data
There are many types of spot and spread data online, most of which are presented in the form of tables, which is obviously not suitable for analyzing and judging the market. FMZ Quant trading platform (FMZ.COM) has built-in commodity futures fundamental data, including spot data and spread data. Only need to call a function to get the spot and spread price of each variety, and support historical data from 2016 to the present.
# Backtest configuration
'''backtest
start: 2020-06-01 00:00:00
end: 2020-06-02 00:00:00
period: 1d
basePeriod: 1h
exchanges: [{"eid":"Futures_CTP","currency":"FUTURES"}]
'''

# Strategy entry
def main():
    while True:
        ret = exchange.GetData("GDP")  # Calling GDP data
        Log(ret)  # Print data
        Sleep(1000 * 60 * 60 * 24 * 30)
Return result
{
     "Quarterly": "Q1 2006",
     "GDP": {
         "Absolute Value (100 million yuan)": 47078.9,
         "YoY Growth": 0.125
     },
     "primary industry": {
         "Absolute Value (100 million yuan)": 3012.7,
         "YoY Growth": 0.044
     },
     "Tertiary Industry": {
         "Absolute Value (100 million yuan)": 22647.4,
         "YoY Growth": 0.131
     },
     "Secondary industry": {
         "Absolute Value (100 million yuan)": 21418.7,
         "YoY Growth": 0.131
     }
}
Spot and spread chart implementation
Let us use FMZ platform to quantify and realize spot prices and spread prices in the form of charts. First, register and log in to the FMZ website (FMZ.COM), click “Dashboard” , and click Strategy Library + New Strategy. Select Python in the drop-down menu in the upper left corner and fill in the name of the strategy.
Step 1: Write the strategy framework
# Strategy main function
def onTick():
     pass


# Strategy entrance
def main():
     while True: # Enter loop mode
         onTick() # execution strategy main function
         Sleep(1000 * 60 * 60 * 24) # Strategy sleep for one day
The strategy framework are two functions, the main function is the entrance of the strategy, the main function is the pre-processing before the trading, the program will start from the main function, and then enter the infinite loop mode, repeatedly execute the onTick function, the onTick function is the main function of the strategy , Mainly execute the core code.
Step 2: Adding chart function
# Global variables
# Futures and Spots chart
cfgA = {
    "extension": {
        "layout":'single',
        "col": 6,
        "height": "500px",
    },
    "title": {
        "text": "futures and spots chart"
    },
    "xAxis": {
        "type": "datetime"
    },
    "series": [{
        "name": "Futures Price",
        "data": [],
    }, {
        "name": "Spot Price",
        "data": [],
    }
    ]
}
# Spread chart
cfgB = {
    "extension": {
        "layout":'single',
        "col": 6,
        "height": "500px",
    },
    "title": {
        "text": "Spread chart"
    },
    "xAxis": {
        "type": "datetime"
    },
    "series": [{
        "name": "Spread Price",
        "data": [],
    }]
}
chart = Chart([cfgA, cfgB]) # Create a chart object


# Strategy main function
def onTick():
    chart.add(0, []) # draw chart
    chart.add(1, []) # draw chart
    chart.add(2, []) # draw chart
    chart.update([cfgA, cfgB]) # update chart


# Strategy entrance
def main():
    LogReset() # Clear the previous log information before running
    chart.reset() # Clear the previous chart information before running
    while True: # Enter loop mode
        onTick() # execution strategy main function
        Sleep(1000 * 60 * 60 * 24) # Strategy sleep for one day
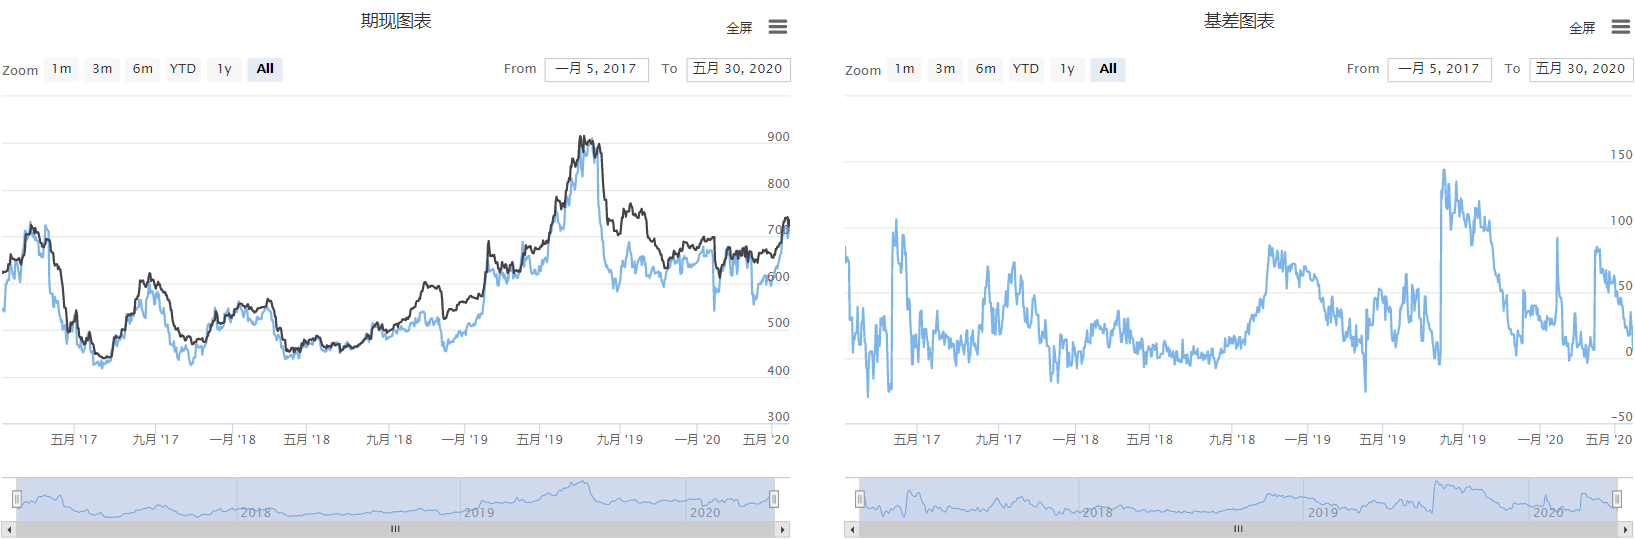
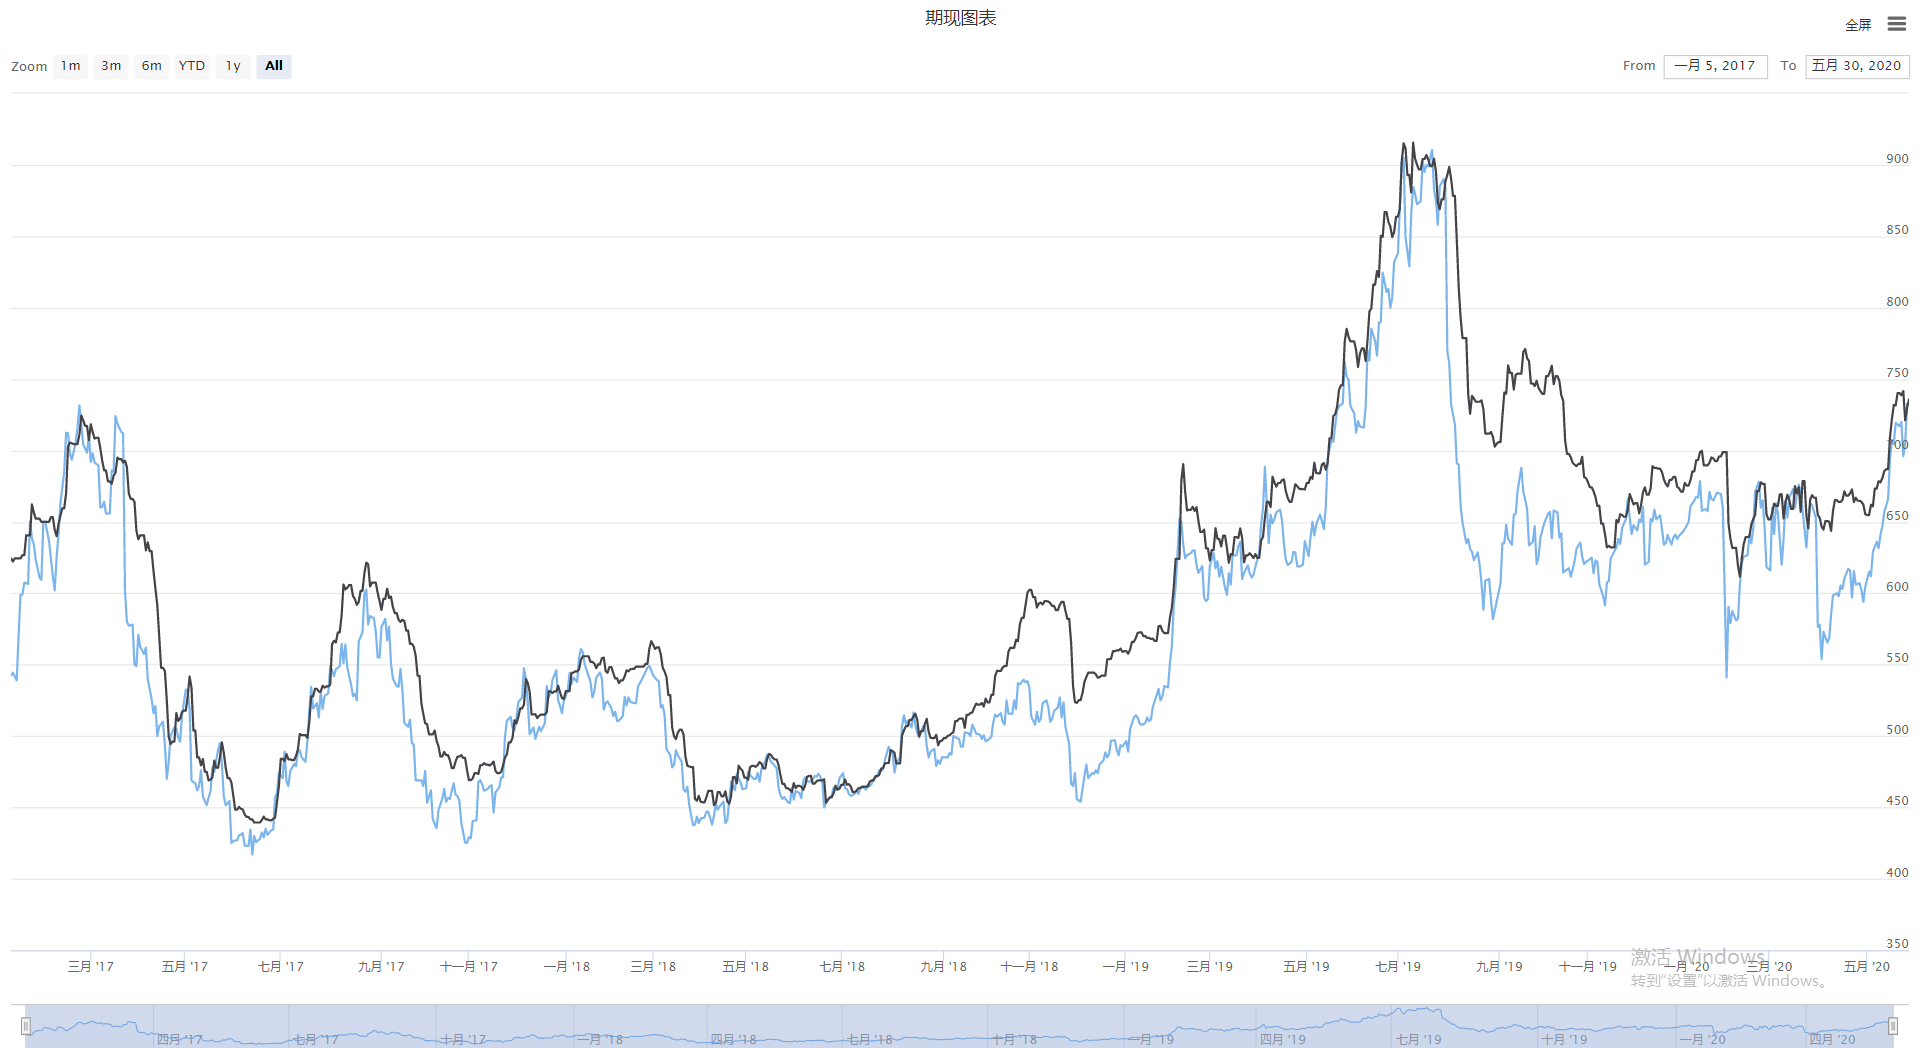
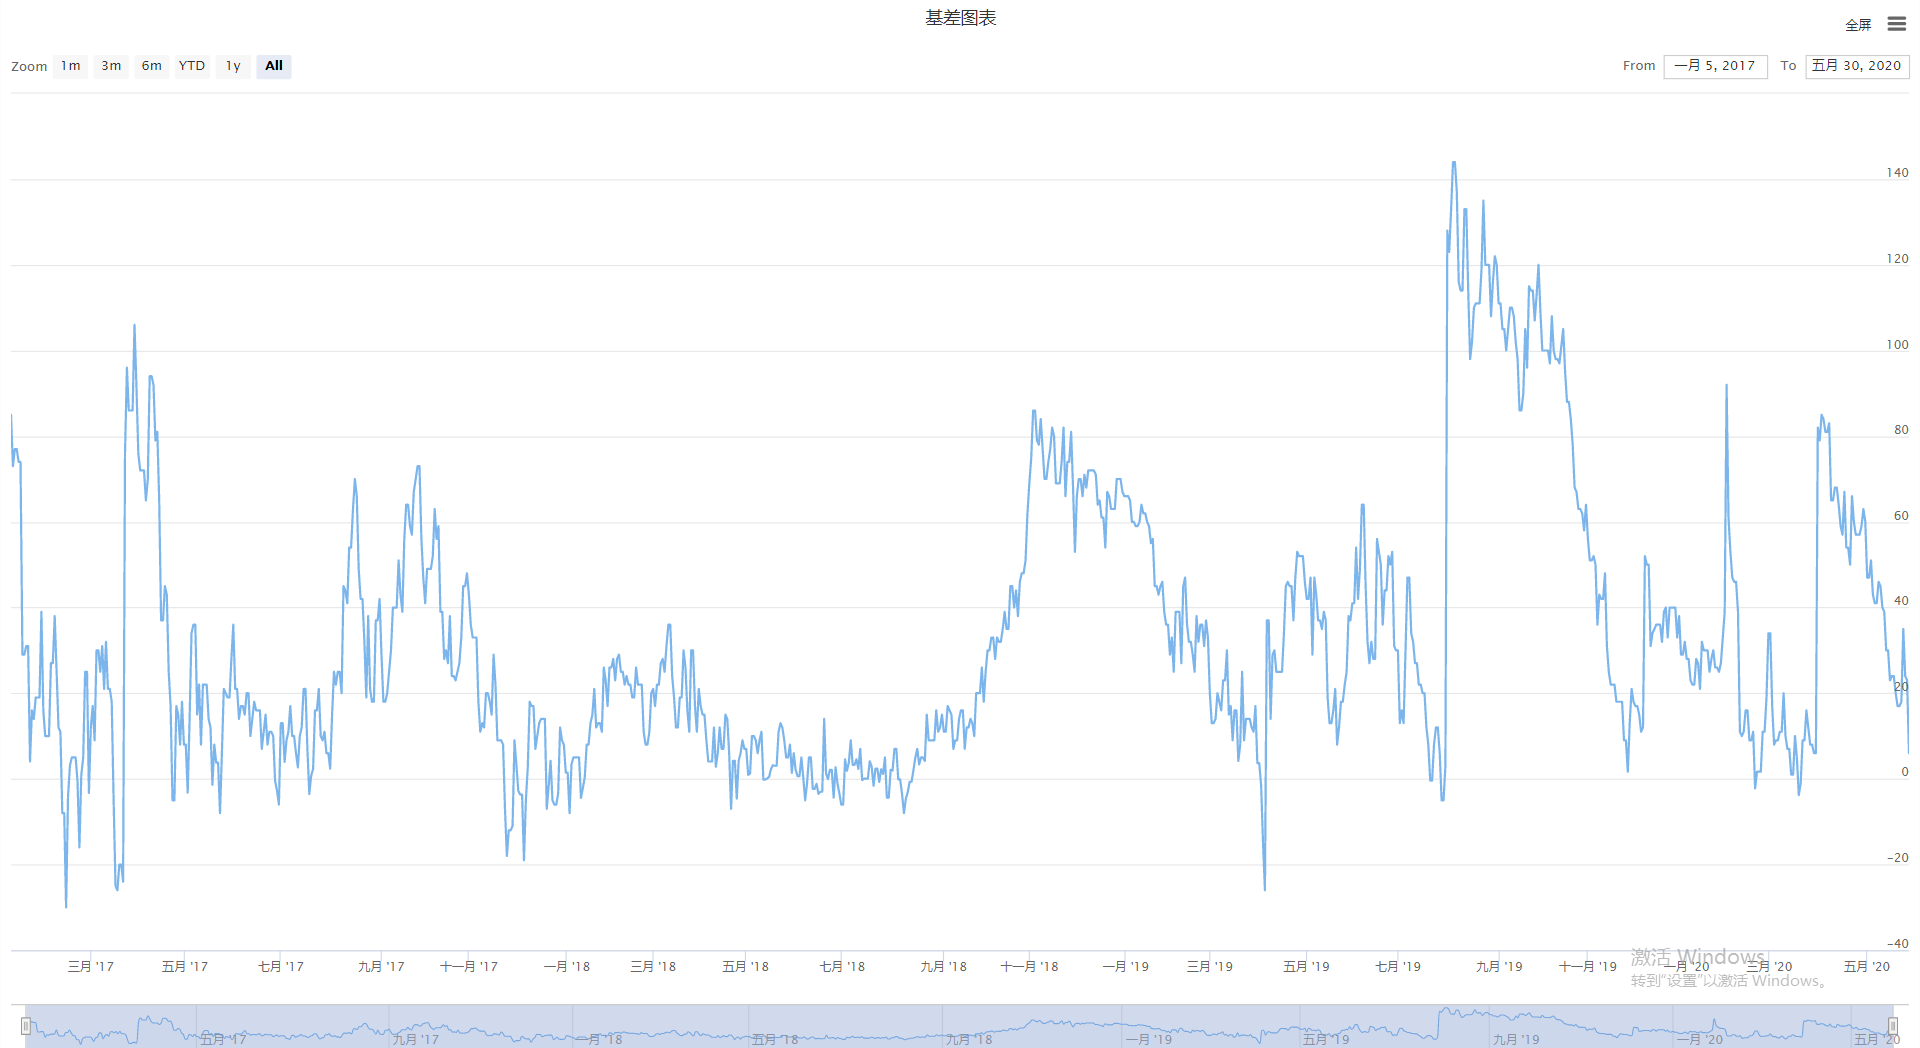
In this strategy, a total of 2 charts have been created and are arranged side by side. Among them, cfgA on the left is a current chart, including futures prices and spot prices, and cfgB on the right is a spread chart. Then call the FMZ platform built-in Python line drawing library to create a chart object. Finally, the data in the chart is updated in real time in the onTick function.
Step 3: Get data
last_spot_price = 0 # Save the last valid spot price
last_spread_price = 0 # Save the last valid spread price

def onTick():
    global last_spread_price, last_spot_price # import global variables
    exchange.SetContractType("i888") # Subscribe to futures varieties
    futures = _C(exchange.GetRecords)[-1] # Get the latest K line data
    futures_ts = futures.Time # Get the latest K-line futures timestamp
    futures_price = futures.Close # Get the latest K-line closing price

    spot = exchange.GetData("SPOTPRICE") # Get spot data
    spot_ts = spot.Time # Get spot timestamp
    if 'iron ore' in spot.Data:
        spot_price = spot.Data['iron ore']
        last_spot_price = spot_price
    else:
        spot_price = last_spot_price

    spread = exchange.GetData("spread") # Get spread data
    spread_ts = spread.Time # Get spread timestamp
    if 'iron ore' in spread.Data:
        spread_price = spread.Data['iron ore']
        last_spread_price = spread_price
    else:
        spread_price = last_spread_price
In total, we need to obtain three kinds of data: futures price, spot price, and spread price. Obtaining the futures price is simple. Use the SetContractType function to directly subscribe to the futures symbol, and then use the GetRecords function to obtain the closing price of the K line. For the prices of spot and spread, you can use the method introduced earlier, use the GetData function to call the fundamental data code, and return the dictionary data that contains the timestamp.
Chart Display
Get the complete strategy code
# fmz@b72930603791887d7452f25f23a13bde
'''backtest
start: 2017-01-01 00:00:00
end: 2020-06-01 00:00:00
period: 1d
basePeriod: 1d
exchanges: [{"eid":"Futures_CTP","currency":"FUTURES"}]
'''


# Global variables
# Futures and Spots chart
cfgA = {
    "extension": {
        "layout":'single',
        "col": 6,
        "height": "500px",
    },
    "title": {
        "text": "futures and spots chart"
    },
    "xAxis": {
        "type": "datetime"
    },
    "series": [{
        "name": "Futures Price",
        "data": [],
    }, {
        "name": "Spot Price",
        "data": [],
    }
    ]
}
# spread chart
cfgB = {
    "extension": {
        "layout":'single',
        "col": 6,
        "height": "500px",
    },
    "title": {
        "text": "spread chart"
    },
    "xAxis": {
        "type": "datetime"
    },
    "series": [{
        "name": "spread Price",
        "data": [],
    }]
}
last_spot_price = 0 # Save the last valid spot price
last_spread_price = 0 # Save the last valid spread price
chart = Chart([cfgA, cfgB]) # Create a chart object

def onTick():
    global last_spread_price, last_spot_price # import global variables
    exchange.SetContractType("i888") # Subscribe to futures varieties
    futures = _C(exchange.GetRecords)[-1] # Get the latest candlestick data
    futures_ts = futures.Time # Get the latest K-line futures timestamp
    futures_price = futures.Close # Get the latest K-line closing price
    Log('Future price:', futures_ts, futures_price)

    spot = exchange.GetData("SPOTPRICE") # Get spot data
    spot_ts = spot.Time # Get spot timestamp
    if 'iron ore' in spot.Data:
        spot_price = spot.Data['iron ore']
        last_spot_price = spot_price
    else:
        spot_price = last_spot_price
    Log('Spot price:', spot_ts, spot_price)

    spread = exchange.GetData("spread") # Get spread data
    spread_ts = spread.Time # Get spread timestamp
    if 'iron ore' in spread.Data:
        spread_price = spread.Data['iron ore']
        last_spread_price = spread_price
    else:
        spread_price = last_spread_price
    Log('spread price:', spread_ts, spread_price)

    chart.add(0, [futures_ts, futures_price]) # draw chart
    chart.add(1, [spot_ts, spot_price]) # draw chart
    chart.add(2, [spread_ts, spread_price]) # draw chart
    chart.update([cfgA, cfgB]) # update chart
    Log('---------')


# Strategy entrance
def main():
    LogReset() # Clear the previous log information before running
    chart.reset() # Clear the previous chart information before running
    while True: # Enter loop mode
        onTick() # execution strategy main function
        Sleep(1000 * 60 * 60 * 24) # Strategy sleep for one day
The complete strategy has been posted on the FMZ platform (FMZ.COM) strategy square, it can be used directly by clicking the link below.
https://www.fmz.com/strategy/211941
End
Arbitrage is not as complicated as imagined. It does not require too much knowledge of financial theory, nor does it require too complicated mathematical or statistical models. Arbitrage is essentially to make a profit from an unreasonable price to a reasonable return. Market conditions change every year. For traders, it is best not to copy historical data to the present, but to combine the current data to study whether the price spread is reasonable.
- 基于FMZ平台Web3 Tron封装接入SunSwap DEX的实践
- FMZ 平台 Web3 以太坊实践 —— 基于智能合约的挂单兑换
- How to Implement Pending Orders in Decentralized Exchanges — Taking Curve as An Example
- 去中心化交易所如何实现挂单——以Curve为例
- FMZ Quant Web3 Expansion: Tron Support Added, Expand On-chain Tradings
- A Brief Analysis of Arbitrage Strategy: How to Capture Low-risk Opportunities with Short Time Lags
- 套利策略浅析:如何捕捉短时滞后的低风险机会
- FMZ量化Web3拓展:新增Tron支持,扩展链上交易能力
- Design and Implementation of DEX-CEX Exchange Price Difference Monitoring Based on FMZ Quant
- 基于FMZ量化的DEX-CEX交易所差价监控设计与实现
- Quantitative Analysis Helps Grid Strategy (II): Relationship Between Grid Number and Yield
- 调用钉钉接口实现机器人推送消息
- FMEX交易解锁最优下单量优化
- Simple Volatility EMV Strategy
- 手把手教你把一个Python策略封装成本地文件
- Deviation rate BIAS trading strategy
- Evaluation of backtest capital curve using "pyfolio" tool
- FMZ量化麦(My)语言--界面图表
- Python version of Commodity Futures Intertemporal Bollinger Hedge Strategy (Study purpose only)
- Interfacing with FMZ robot using "Tradingview" indicator
- FMZ量化麦语言(My)--麦语言交易类库参数
- High-frequency backtest system based on each transaction and the defects of K-line backtest
- Python version of commodity futures intertemporal hedging strategy
- Some Thoughts on the Logic of Crypto Currency Futures Trading
- Enhanced analysis tool based on Alpha101 grammar development
- Teach you to upgrade the market collector backtest the custom data source
- 基于逐笔成交的高频回测系统兼论K线回测的缺陷
- FMZ simulation level backtest mechanism explanation
- The best way to install and upgrade FMZ docker on Linux VPS
- Commodity Futures R-Breaker Strategy
- 数字货币期货交易逻辑的一点思考