মোমেন্টাম ডাবল মুভিং এভারেজ ক্রসওভার কৌশল
ওভারভিউ
এই কৌশলটি মূল্যের গতির দিকনির্দেশের জন্য গড় লাইন ক্রস ব্যবহার করে, গোল্ডেন ফোর্কের সাহায্যে সামগ্রিক প্রবণতা নির্ধারণ করে এবং প্রবণতা অনুসরণ করে।
কৌশল নীতি
এই কৌশলটি ইএমএ এবং এসএমএ দুটি সমান্তরাল লাইনগুলির ক্রস ব্যবহার করে দামের গতির দিকটি বিচার করে, ইএমএ আরও দ্রুত প্রতিক্রিয়া জানায়, এসএমএ আরও স্থিতিশীল প্রতিক্রিয়া জানায়। যখন ইএমএ-তে এসএমএ অতিক্রম করা হয় তখন দামের উত্থানের গতি শক্তিশালী বলে বিচার করা হয়, আরও বেশি করা হয়; যখন ইএমএ-তে এসএমএ অতিক্রম করা হয় তখন দামের পতনের গতি শক্তিশালী বলে বিচার করা হয়, খালি করা হয়।
এছাড়াও, এই কৌশলটি সামগ্রিক প্রবণতার দিকনির্দেশের জন্য দ্রুত চক্রের এসএমএ এবং ধীর চক্রের এসএমএর ক্রস ব্যবহার করে। যখন দ্রুত এসএমএতে ধীর এসএমএ অতিক্রম করা হয়, তখন এটি একটি গোল্ড ফর্ক, দীর্ঘমেয়াদী উত্থানের প্রবণতা হিসাবে বিচার করা হয়; যখন দ্রুত এসএমএতে ধীর এসএমএ অতিক্রম করা হয় তখন এটি একটি মৃত ফর্ক, দীর্ঘমেয়াদী পতনের প্রবণতা হিসাবে বিচার করা হয়।
কৌশলটি ইএমএতে এসএমএ অতিক্রম করার সময় অতিরিক্ত সুযোগ হিসাবে বিচার করা হয়। যদি এই সময়টি সোনার ফর্ক হয় তবে এটি বোঝায় যে এটি কেবলমাত্র স্বল্পমেয়াদী গতিশীল সমর্থন নয়, এটি দীর্ঘমেয়াদী প্রবণতার সাথে সামঞ্জস্যপূর্ণও, এটি একটি ভাল অতিরিক্ত সময়; যদি এই সময়টি মৃত ফর্ক হয়, তবে এটি কেবলমাত্র স্বল্পমেয়াদী গতিশীল সমর্থন রয়েছে, এটি দীর্ঘমেয়াদী প্রবণতার সাথে সামঞ্জস্যপূর্ণ নয়, এটি একটি ঝুঁকিপূর্ণ অতিরিক্ত সময়।
সামর্থ্য বিশ্লেষণ
- গড় রেখার ক্রস ব্যবহার করে দামের গতি এবং দিকনির্দেশনা নির্ধারণ করা
- স্বল্পমেয়াদী গতিশীলতা এবং দীর্ঘমেয়াদী প্রবণতা বিবেচনা করুন
- ডাবল ইন্ডিকেটর কনফার্মেশন সিগন্যালের সাথে যুক্ত, উচ্চ নির্ভরযোগ্যতা
- গড় রেখার প্যারামিটারগুলি সামঞ্জস্য করে বিভিন্ন সময়কালের সাথে খাপ খাইয়ে নেওয়া যায়
- নির্দিষ্ট ট্রেডিং সিগন্যাল প্রদর্শন করা যায় কিনা তা কনফিগার করা যায়, ইন্টারফেসটি কাস্টমাইজ করা যায়
ঝুঁকি বিশ্লেষণ
- গড় লাইন ক্রস-এর পিছনে রয়েছে, যার ফলে সেরা ক্রয়-বিক্রয় পয়েন্ট মিস হতে পারে
- স্থির-চক্রের এসএমএগুলি রিয়েল-টাইমে মূল্য পরিবর্তনের প্রতিফলন করতে পারে না
- দীর্ঘ ও স্বল্পকালীন গড় রেখা ভুল ক্রস সংকেত সৃষ্টি করতে পারে
- দীর্ঘমেয়াদে ঝুঁকি বাড়ানোর সম্ভাবনা
অন্যান্য সূচকগুলির সাথে সংযুক্ত করে সংকেত নিশ্চিতকরণ, গড় লাইন চক্রের প্যারামিটারগুলি অপ্টিমাইজ করা বা স্টপ লস সেট করে ঝুঁকি হ্রাস করা যায়।
অপ্টিমাইজেশান দিক
- অন্যান্য সূচক যেমন লেনদেনের পরিমাণ, ব্রিনব্যান্ড ইত্যাদির জন্য ফিল্টার যুক্ত করুন
- স্টপ লস বাড়ান
- সমান্তরাল চক্রের প্যারামিটার অপ্টিমাইজ করুন
- তহবিল ব্যবস্থাপনা অপ্টিমাইজ করুন
- রিয়েল-টাইম হোল্ডিং অনুপাত সংশোধন বিবেচনা করুন
সারসংক্ষেপ
এই কৌশলটি সামগ্রিকভাবে একটি স্থিতিশীল এবং নির্ভরযোগ্য প্রবণতা অনুসরণকারী কৌশল। এটি একই সাথে স্বল্পমেয়াদী মূল্যের গতিশীলতা এবং দীর্ঘমেয়াদী প্রবণতার দিক বিবেচনা করে, গড় লাইন ক্রস করে একটি লেনদেনের সংকেত তৈরি করে। একক গড় লাইন কৌশলটির তুলনায়, এটি দ্বৈত সূচক নিশ্চিতকরণের সাথে যুক্ত, এটির নির্ভরযোগ্যতা বেশি। তবে প্রবণতা অনুসরণকারী কৌশল হিসাবে, এর প্যারামিটার অপ্টিমাইজেশন এবং ঝুঁকি নিয়ন্ত্রণ অত্যন্ত গুরুত্বপূর্ণ, কৌশলটির কার্যকারিতাটি সত্যই কার্যকর করার জন্য পুনরাবৃত্তি পরীক্ষা এবং সমন্বয় প্রয়োজন। ক্রমাগত অপ্টিমাইজেশন এবং উন্নতির মাধ্যমে, এই কৌশলটি একটি বহুমুখী বিনিয়োগের একটি বহুমুখী উপাদান হতে পারে যা দীর্ঘমেয়াদে রাখা মূল্যবান।
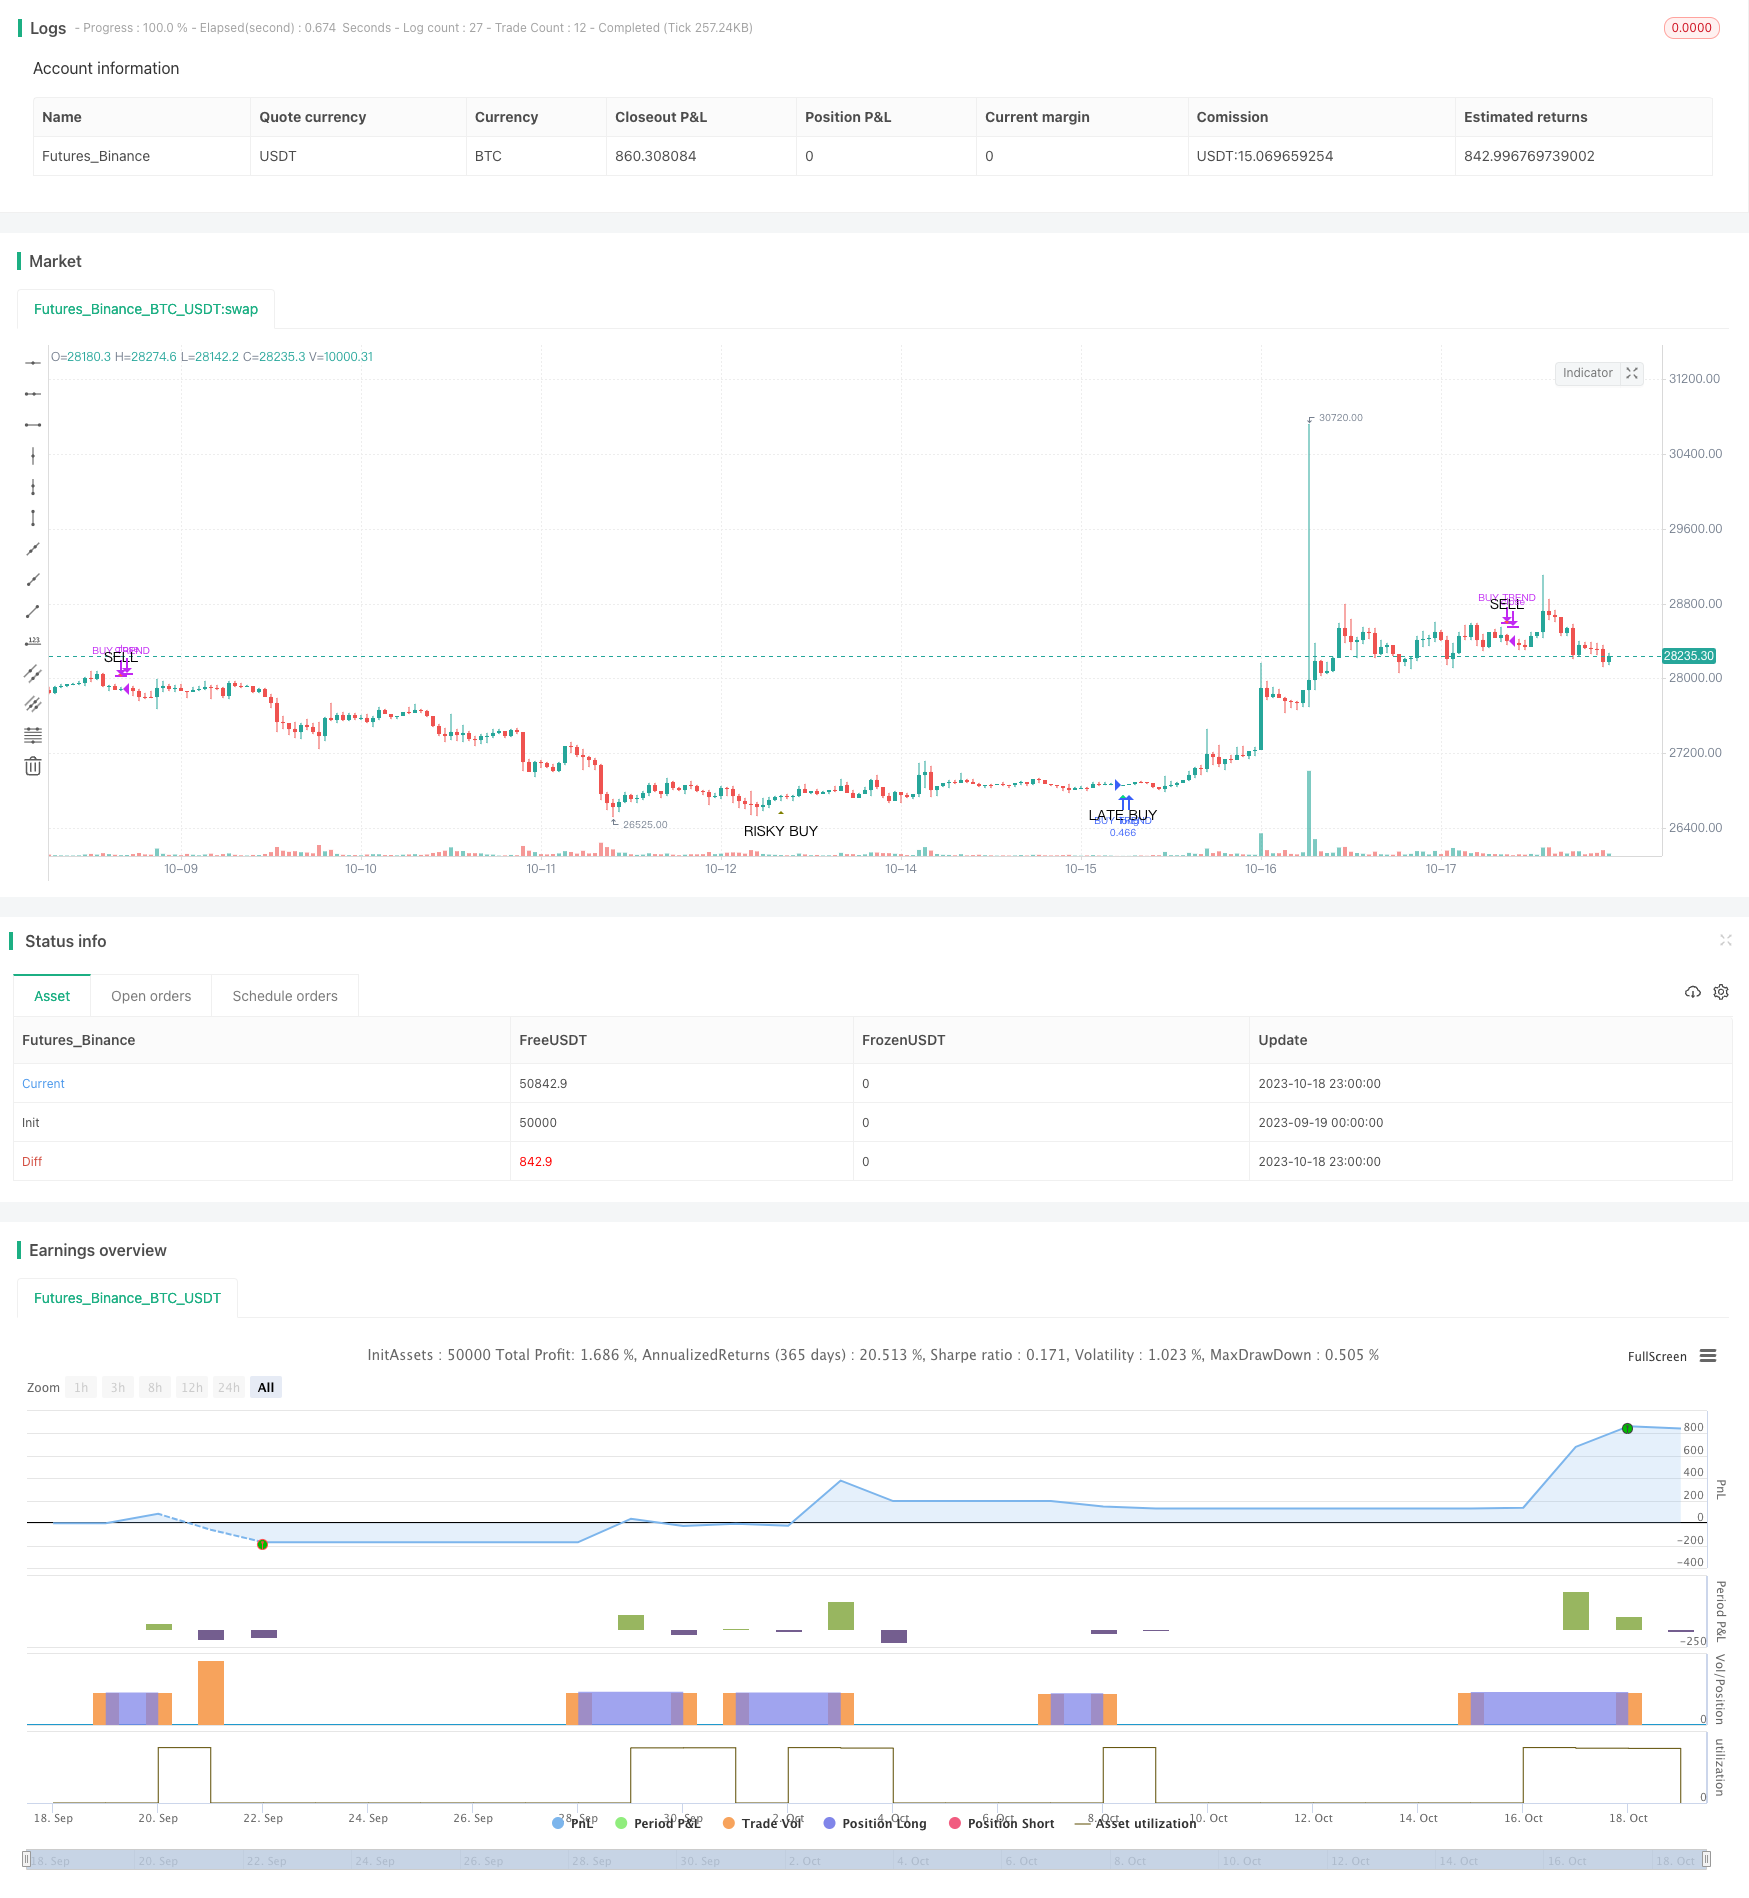
/*backtest
start: 2023-09-19 00:00:00
end: 2023-10-19 00:00:00
period: 1h
basePeriod: 15m
exchanges: [{"eid":"Futures_Binance","currency":"BTC_USDT"}]
*/

// This source code is subject to the terms of the Mozilla Public License 2.0 at https://mozilla.org/MPL/2.0/
// © Cryptoluc1d

//@version=4
strategy("Equal-Length EMA/SMA Crossover Strategy", initial_capital=10000, default_qty_type=strategy.percent_of_equity, default_qty_value=25, commission_type=strategy.commission.percent, commission_value=0.2, overlay=true)

// Create inputs

mom_length = input(title="Momentum Length (EMA=SMA)", defval=50)
bias_length_fast  = input(title="Golden Cross Length (Fast)", defval=50)
bias_length_slow  = input(title="Golden Cross Length (Slow)", defval=100)

// Define MAs

ema = ema(close, mom_length) // EMA/SMA crossover of the same period for detecting trend acceleration/deceleration
sma = sma(close, mom_length)
bias_fast = sma(close, bias_length_fast) // golden/death cross for overall trend bias
bias_slow = sma(close, bias_length_slow)

// Define signal conditions

buy_trend = crossover(ema, sma) and bias_fast >= bias_slow // buy when EMA cross above SMA. if this happens during a bullish golden cross, buying is in confluence with the overall trend (bias).
buy_risky = crossover(ema, sma) and bias_fast < bias_slow // buy when EMA cross above SMA. if this happens during a bearish death cross, buying is early, more risky, and not in confluence with the overall trend (bias).
buy_late = crossover(sma, bias_slow) and ema > sma // the SMA crossing the Slow_SMA gives further confirmation of bullish trend, but signal comes later.
sell = crossunder(ema, sma) // sell when EMA cross under SMA.

// Enable option to hide signals, then plot signals

show_signal = input(title="Show Signals", defval=true)

plotshape(show_signal ? buy_trend : na, title='Trend Buy', style=shape.triangleup, location=location.belowbar, color=color.green, text='TREND BUY')
plotshape(show_signal ? buy_risky : na, title='Risky Buy', style=shape.triangleup, location=location.belowbar, color=color.olive, text='RISKY BUY')
plotshape(show_signal ? buy_late : na, title='Late Buy', style=shape.triangleup, location=location.belowbar, color=color.lime, text='LATE BUY')
plotshape(show_signal ? sell : na, title='Sell', style=shape.triangledown, location=location.abovebar, color=color.red, text='SELL')

// Define entry and exit conditions

longCondition = ema > sma and bias_fast >= bias_slow // LONG when EMA above SMA, and overall trend bias is bullish
if (longCondition)
    strategy.entry("BUY TREND", strategy.long)
exitLong = crossunder(ema, sma) // close LONG when EMA cross under SMA
strategy.close("BUY TREND", when=exitLong)

// // short conditions. turned off because up only.
// shortCondition = ema < sma and bias_fast <= bias_slow // SHORT when EMA under SMA, and overall trend bias is bearish
// if (shortCondition)
//     strategy.entry("SELL TREND", strategy.short)
// exitShort = crossover(ema, sma) // close SHORT when EMA cross over SMA
// strategy.close("SELL TREND", when=exitShort)

// Enable option to show MAs, then plot MAs

show_ma = input(title="Show MAs", defval=false)

plot(show_ma ? ema : na, title="Momentum EMA", color=color.green, linewidth=1)
plot(show_ma ? sma : na, title="Momentum SMA", color=color.yellow, linewidth=1)
plot(show_ma ? bias_fast : na, title="Golden Cross SMA (Fast)", color=color.orange, linewidth=2)
plot(show_ma ? bias_slow : na, title="Golden Cross SMA (Slow)", color=color.red, linewidth=2)