দ্বিমুখী চলাচল সূচক কৌশলের উপর ভিত্তি করে
ওভারভিউ
এই কৌশলটি দ্বি-দিকের গতিশীলতা সূচক DI+ , DI- এবং গড় দিকনির্দেশক সূচক ADX গণনা করে, সূচকীয় চলমান গড় EMA এর সাথে মিলিত হয়ে একটি ট্রেডিং সিগন্যাল উৎপন্ন করে। DI+ এর উপরে DI- এবং ADX 20 এর বেশি হলে একটি কেনার সংকেত উৎপন্ন হয়; যখন DI- এর নীচে DI+ এবং ADX 25 এর বেশি হয় তখন একটি বিক্রয় সংকেত উৎপন্ন হয়। ট্রেডিং স্টপ লস সিগন্যালটি DI- এর উপরে DI+ এবং ADX 30 এর বেশি হলে।
কৌশল নীতি
ডিআই +, ডিআই-এডিএক্স গণনা করুন
- ta.dmi () ফাংশনটি ডিআই+, ডিআই- এবং এডিএক্স গণনা করে
- ডিআই+/ডিআই - মূল্যের দিকনির্দেশনা প্রতিফলিত করে
- ADX হল দামের পরিবর্তনের গড় মাত্রা
ইন্ডেক্স চলমান গড় EMA গণনা
- কাস্টমাইজড my_ema () ফাংশন কল করে EMA গণনা করুন
- ইএমএ কার্যকরভাবে দামের তথ্য মসৃণ করতে পারে
ট্রেডিং সংকেত উৎপন্ন
- ক্রয় সংকেতঃ ডিআই + এ ডিআই- এবং এডিএক্স> 20 এবং ক্লোজিং মূল্য> ইএমএ
- দামের প্রবণতা বৃদ্ধি পেয়েছে এবং দামের পরিবর্তন হয়েছে
- বিক্রয় সংকেতঃ ডিআই-এর অধীনে ডিআই+ এবং এডিএক্স> 25 এবং ক্লোজ-আপ মূল্য < ইএমএ
- দামের প্রবণতা নিম্নমুখী এবং ব্যাপকভাবে পরিবর্তিত হয়েছে
- ক্রয় সংকেতঃ ডিআই + এ ডিআই- এবং এডিএক্স> 20 এবং ক্লোজিং মূল্য> ইএমএ
লেনদেন বন্ধ
- ক্রয় ক্ষতি বন্ধ করুনঃ ডিআই-তে ডিআই+ পরুন এবং ADX> 30
- দামের বিপরীত প্রবণতা ব্যাখ্যা করা
- বিক্রয় বন্ধঃ ডিআই + এর নিচে ডিআই- এবং এডিএক্স> 30
- দামের বিপরীত প্রবণতা ব্যাখ্যা করা
- ক্রয় ক্ষতি বন্ধ করুনঃ ডিআই-তে ডিআই+ পরুন এবং ADX> 30
সমষ্টিগতভাবে, এই কৌশলটি গতিশীলতার সূচক এবং প্রবণতা সূচককে সংযুক্ত করে, যখন দামের প্রবণতা বেশি থাকে তখন ট্রেডিং সংকেত তৈরি করে।
সামর্থ্য বিশ্লেষণ
- ডাবল ডিআই ব্যবহার করে মিথ্যা সংকেত এড়ানো
- একক ডিআই একটি ভুল সংকেত তৈরি করতে পারে, ডিআই + এবং ডিআই - এর সংমিশ্রণ প্রবণতা নিশ্চিত করে
- এডিএক্স শর্তগুলি মূল্যের পরিবর্তনের বৃহত্তরতা নিশ্চিত করে
- বাজারের অস্থিরতা এড়ানোর জন্য কেবলমাত্র দামের অস্থিরতা বাড়লে ট্রেড করুন
- ইএমএ শর্তাদি সহযোগিতা ডিআই
- ইএমএ মূল্যের মধ্য-দীর্ঘ লাইন প্রবণতা কার্যকরভাবে সনাক্ত করতে পারে
- কঠোর ক্ষতিপূরণ
- সময়মতো ক্ষতি বন্ধ করুন, বিপুল ক্ষতি এড়িয়ে চলুন
ঝুঁকি বিশ্লেষণ
- ঘন ঘন ক্ষতি
- যদি পরিস্থিতি খুব খারাপ হয়, তাহলে ক্ষতির পরিমাণ অনেক বেশি হবে।
- প্যারামিটার নির্ভরতা
- ডিআই এবং এডিএক্স প্যারামিটারগুলিকে সর্বোত্তম সমন্বয় খুঁজে পেতে অপ্টিমাইজ করা দরকার
- কম লেনদেন
- কঠোর লেনদেনের শর্তাবলী লেনদেনের ঘনত্ব হ্রাস করবে
ট্রেডিং ফ্রিকোয়েন্সি বাড়ানোর জন্য স্টপ লস, প্যারামিটার সমন্বয়, বা অতিরিক্ত ফিল্টারিং শর্ত যোগ করে অপ্টিমাইজ করা যায়।
অপ্টিমাইজেশান দিক
- প্যারামিটার অপ্টিমাইজেশান
- ডিআই এবং এডিএক্স প্যারামিটারগুলি অপ্টিমাইজ করুন এবং সর্বোত্তম প্যারামিটার সমন্বয় খুঁজে পান
- ফিল্টার যোগ করুন
- সংকেত ফিল্টার করুন যেমন যোগদানের পরিমাণ, বিচ্ছিন্নতা ইত্যাদি
- স্টপ লস প্রসারিত করুন
- যথাযথভাবে স্টপ শর্তাবলী শিথিল করুন, ঘন ঘন স্টপ হ্রাস করুন
সারসংক্ষেপ
এই কৌশলটি গতিশীলতার সূচক এবং প্রবণতা বিশ্লেষণের সূচককে একত্রিত করে, যখন দামের প্রবণতা বেশি থাকে তখন ট্রেডিং সংকেত উত্পন্ন করে। কঠোর স্টপ শর্তগুলি সেট করুন এবং ঝুঁকি নিয়ন্ত্রণ করুন। প্যারামিটার অপ্টিমাইজেশন, সংকেত ফিল্টার যুক্ত করা এবং স্টপ ল্যাম্পটি যথাযথভাবে প্রসারিত করে কৌশলটির কার্যকারিতা আরও বাড়িয়ে তুলতে পারে।
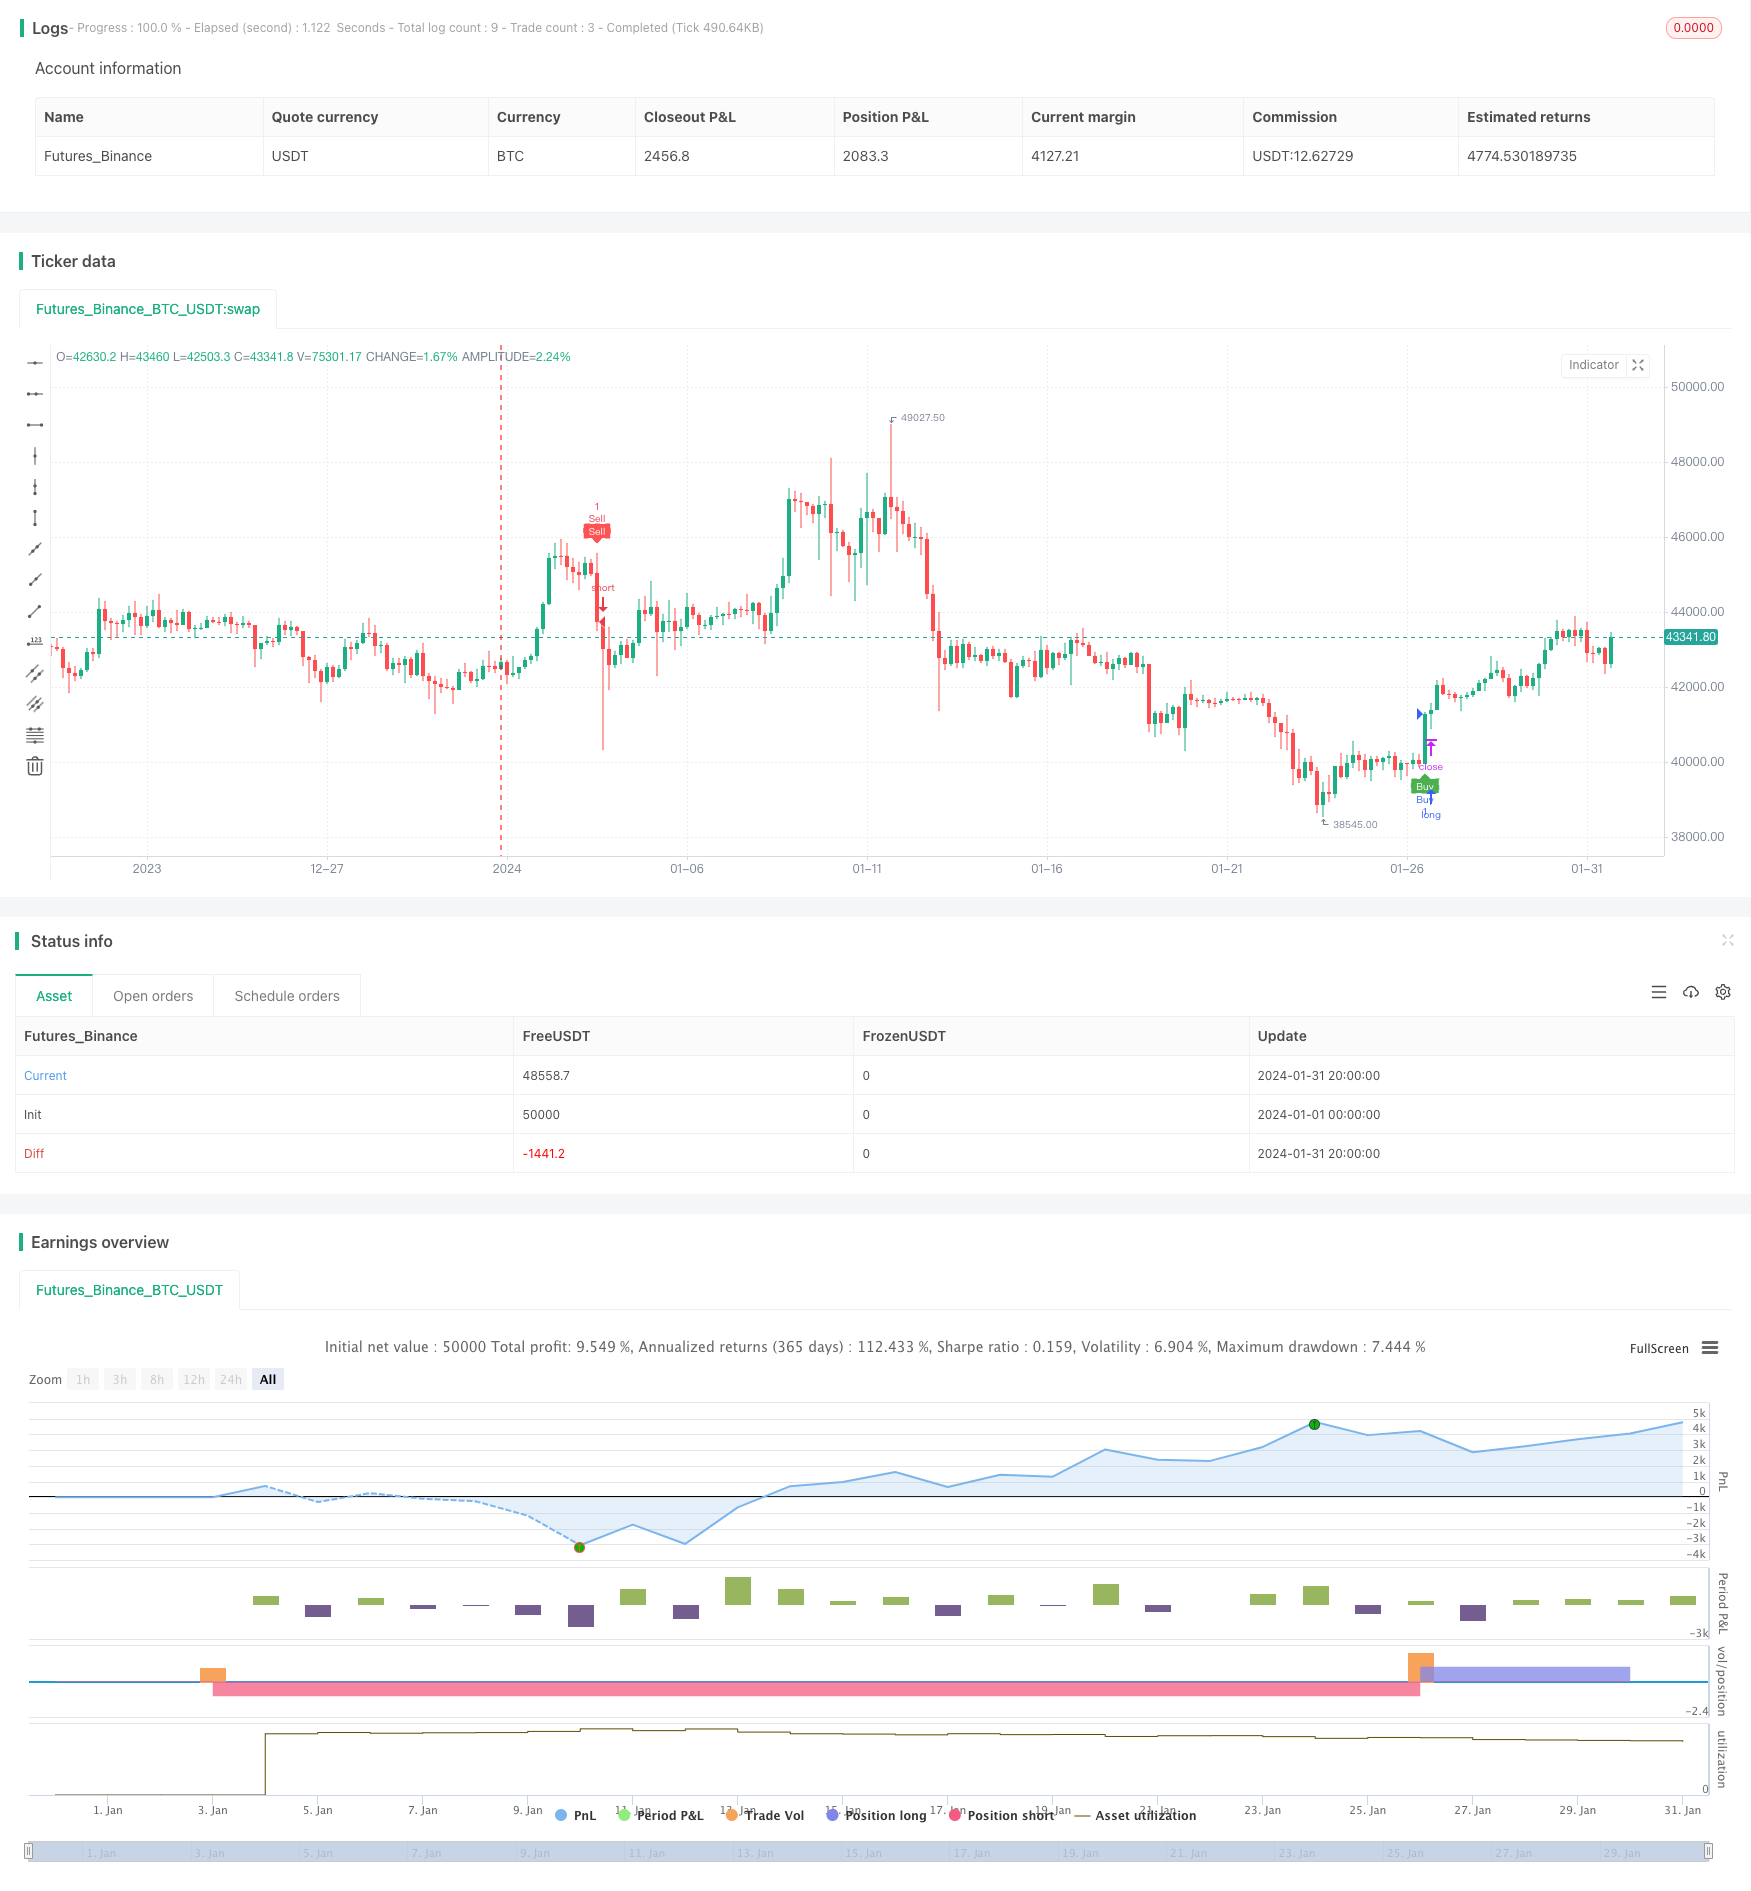
/*backtest
start: 2024-01-01 00:00:00
end: 2024-01-31 23:59:59
period: 4h
basePeriod: 15m
exchanges: [{"eid":"Futures_Binance","currency":"BTC_USDT"}]
*/

// This Pine Script™ code is subject to the terms of the Mozilla Public License 2.0 at https://mozilla.org/MPL/2.0/
// © Tamil_FNO_Trader

//@version=5
strategy("Overlay Signals by TFOT", overlay=true)

// Calculate DMI
len = input.int(14, minval=1, title="DI Length")
lensig = input.int(14, title="ADX Smoothing", minval=1, maxval=50)
[diplus, diminus, adx] = ta.dmi(len, lensig)

// Get EMA
emalen = input.int(26, minval=1, title = "EMA Length")
emasrc = input.source(close, title = "EMA Source")

my_ema(src, length) =>
    alpha = 2 / (length + 1)
    sum = 0.0
    sum := na(sum[1]) ? src : alpha * src + (1 - alpha) * nz(sum[1])
EMA2 = my_ema(emasrc, emalen)

// Variables
var bool buycondition1 = false
var bool sellcondition1 = false

var int firstbuybar = na
var int firstsellbar = na

var int buyexitbar = na
var int sellexitbar = na

var bool buyexit1 = false
var bool sellexit1 = false

// Buy & Sell Conditions
buycondition1 := (ta.crossover(diplus, diminus)) and (adx > 20) and (close > EMA2) and na(firstbuybar)
sellcondition1 := (ta.crossover(diminus, diplus)) and (adx > 25) and (close < EMA2) and na(firstsellbar)

buyexit1 := ta.crossover(diminus, diplus) and (adx > 30) and na(buyexitbar)
sellexit1 := ta.crossover(diplus, diminus) and (adx > 30) and na(sellexitbar)

if buycondition1
    if(na(firstbuybar))
        firstbuybar := bar_index
        buyexitbar := na
        firstsellbar := na
        strategy.entry("Buy", strategy.long)

if sellcondition1
    if(na(firstsellbar))
        firstsellbar := bar_index
        sellexitbar := na
        firstbuybar := na
        strategy.entry("Sell", strategy.short)

if buyexit1 and not na(firstbuybar)
    if(na(buyexitbar))
        buyexitbar := bar_index
        firstbuybar := na
        firstsellbar := na
        strategy.close("Buy")

if sellexit1 and not na(firstsellbar)
    if(na(sellexitbar))
        sellexitbar := bar_index
        firstsellbar := na
        firstbuybar := na
        strategy.close("Sell")

// Plot signals on chart
hl = input.bool(defval = true, title = "Signal Labels")

plotshape(hl and buycondition1 and bar_index == firstbuybar ? true : na, "Buy", style = shape.labelup, location = location.belowbar, color = color.green, text = "Buy", textcolor = color.white, size = size.tiny)
plotshape(hl and sellcondition1 and bar_index == firstsellbar ? true : na, "Sell", style = shape.labeldown, location = location.abovebar, color = color.red, text = "Sell", textcolor = color.white, size = size.tiny)

plotshape(hl and buyexit1 and bar_index == buyexitbar ? true : na, "Buy Exit", style = shape.labelup, location = location.belowbar, color = color.red, text = "Buy X", textcolor = color.white, size = size.tiny)
plotshape(hl and sellexit1 and bar_index == sellexitbar ? true : na, "Sell Exit", style = shape.labeldown, location = location.abovebar, color = color.red, text = "Sell X", textcolor = color.white, size = size.tiny)