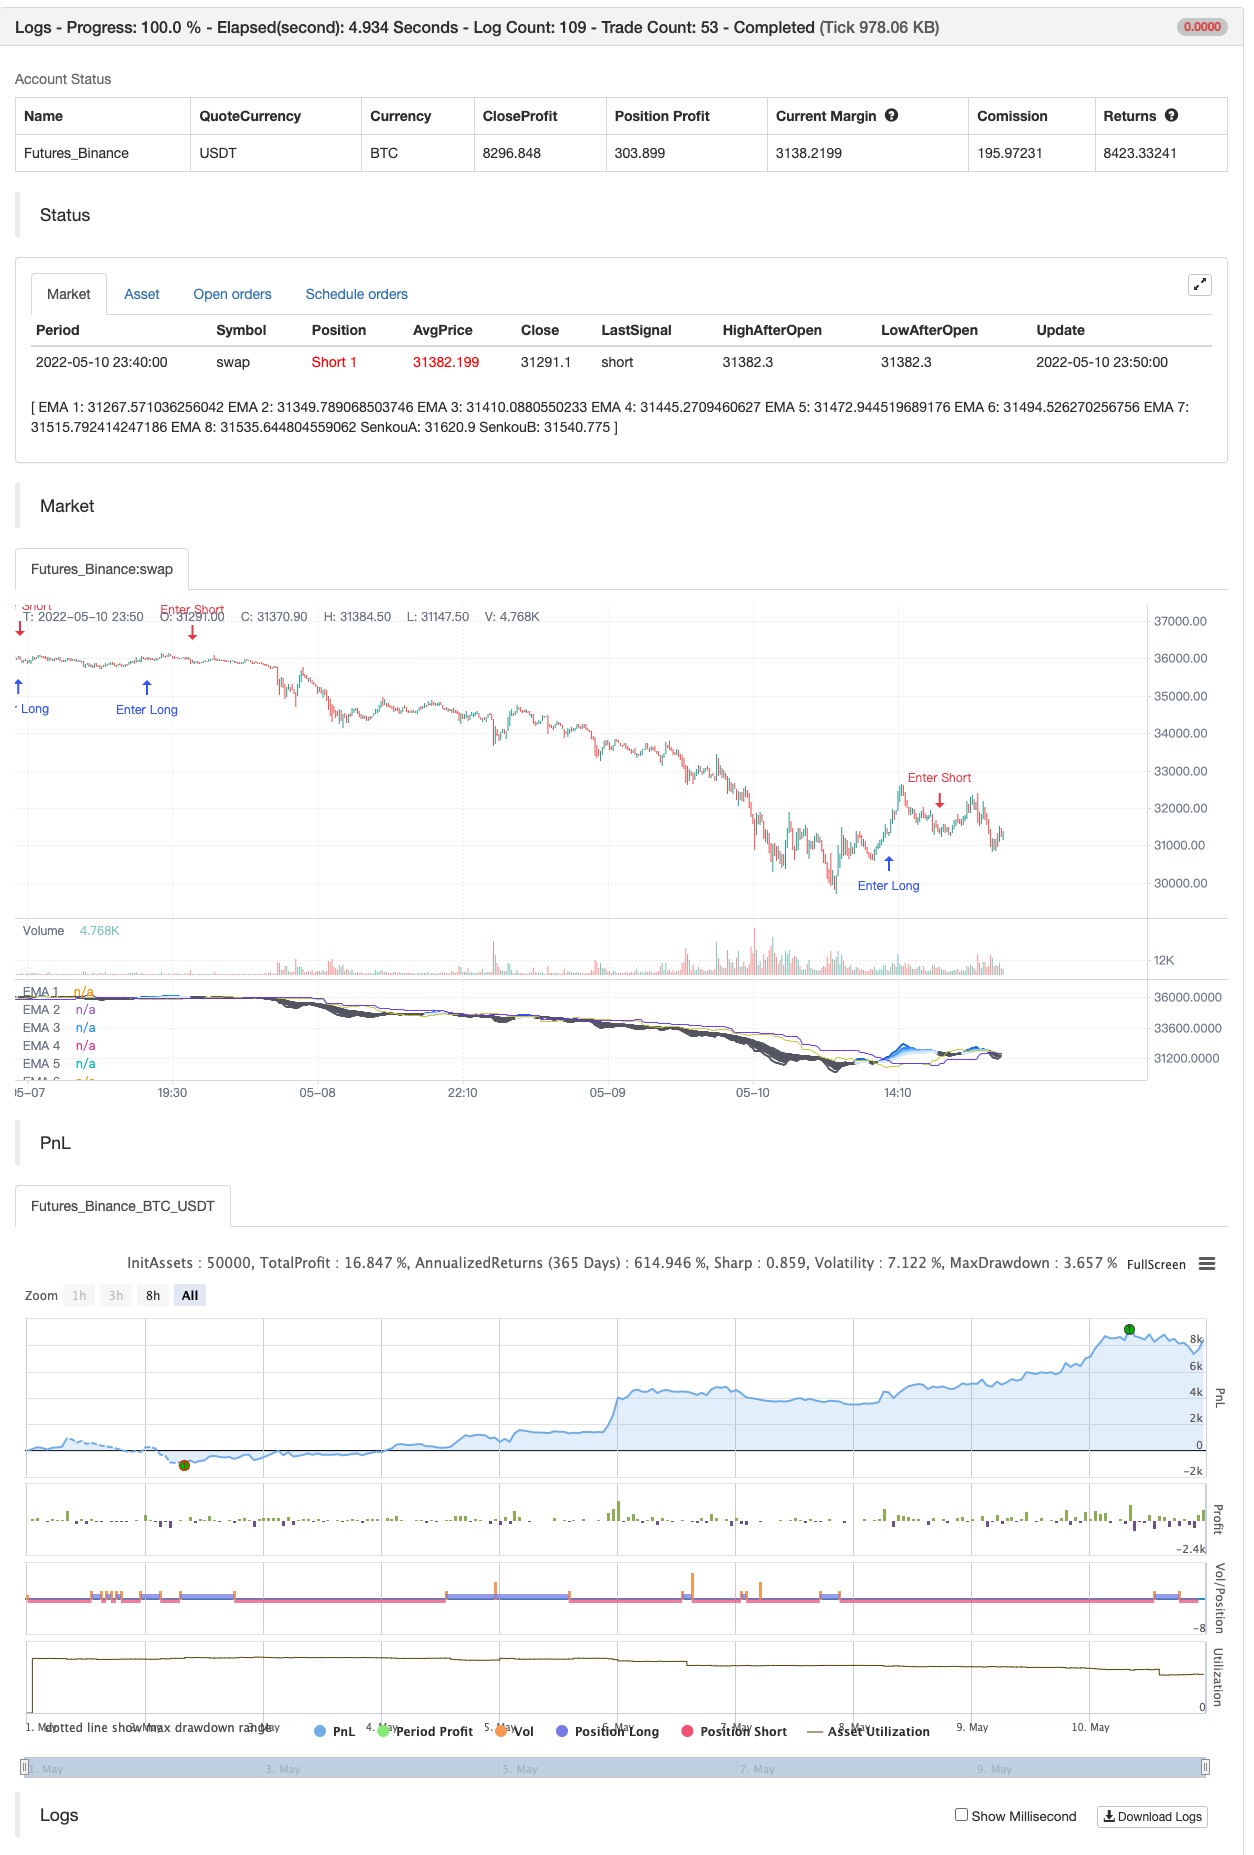
Fukuiz Octa-EMA + Ichimoku
Schriftsteller:ChaoZhang, Datum: 2022-05-16 17:43:51Tags:EMA
Diese Strategie basiert auf EMA von 8 verschiedenen Perioden und Ichimoku Cloud, die besser in 1h 4h und täglich funktioniert.
Eine kurze Einführung in Ichimoku Die Ichimoku-Wolke ist eine Sammlung technischer Indikatoren, die Unterstützungs- und Widerstandsniveaus sowie Momentum und Trendrichtung zeigen. Sie erfolgt durch mehrere Durchschnittswerte und wird auf einem Diagramm dargestellt.
Eine kurze Einführung in die EMA Ein exponentieller gleitender Durchschnitt (EMA) ist eine Art gleitender Durchschnitt (MA), der den jüngsten Datenpunkten ein größeres Gewicht und eine größere Bedeutung verleiht. Der exponentielle gleitende Durchschnitt wird auch als exponentiell gewichteter gleitender Durchschnitt bezeichnet.
Wie man benutzt Die Strategie gibt die Einstiegspunkte selbst, Sie können manuell (empfohlen) überwachen und Gewinn machen oder Sie können die Ausgangseinrichtung verwenden.
EMA (Farbe) = Aufwärtstrend EMA (Grau) = Bärentrend
#Bedingung# Kaufen = Alle Ema (Farbe) über der Wolke. SELL= Alle Ema werden grau.
Zurückprüfung

/*backtest
start: 2022-05-01 00:00:00
end: 2022-05-10 23:59:00
period: 10m
basePeriod: 1m
exchanges: [{"eid":"Futures_Binance","currency":"BTC_USDT"}]
*/

//@version=5
//Fukuiz

//strategy(title='Fukuiz Octa-EMA + Ichimoku', shorttitle='Fuku octa strategy', overlay=true, process_orders_on_close=true,
//     default_qty_type= strategy.cash , default_qty_value=1000, currency=currency.USD, initial_capital=10000 ,commission_type = strategy.commission.percent,commission_value=0.25)


//OCTA EMA ##################################################


// Functions
f_emaRibbon(_src, _e1, _e2, _e3, _e4, _e5, _e6, _e7, _e8) =>
    _ema1 = ta.ema(_src, _e1)
    _ema2 = ta.ema(_src, _e2)
    _ema3 = ta.ema(_src, _e3)
    _ema4 = ta.ema(_src, _e4)
    _ema5 = ta.ema(_src, _e5)
    _ema6 = ta.ema(_src, _e6)
    _ema7 = ta.ema(_src, _e7)
    _ema8 = ta.ema(_src, _e8)
    [_ema1, _ema2, _ema3, _ema4, _ema5, _ema6, _ema7, _ema8]

showRibbon = input(true, 'Show Ribbon (EMA)')
ema1Len = input(5, title='EMA 1 Length')
ema2Len = input(11, title='EMA 2 Length')
ema3Len = input(15, title='EMA 3 Length')
ema4Len = input(18, title='EMA 4 Length')
ema5Len = input(21, title='EMA 5 Length')
ema6Len = input(24, title='EMA 6 Length')
ema7Len = input(28, title='EMA 7 Length')
ema8Len = input(34, title='EMA 8 Length')

[ema1, ema2, ema3, ema4, ema5, ema6, ema7, ema8] = f_emaRibbon(close, ema1Len, ema2Len, ema3Len, ema4Len, ema5Len, ema6Len, ema7Len, ema8Len)

//Plot

ribbonDir = ema8 < ema2
p1 = plot(ema1, color=showRibbon ? ribbonDir ? #1573d4 : color.new(#5d606b, 15) : na, linewidth=2, title='EMA 1')
p2 = plot(ema2, color=showRibbon ? ribbonDir ? #3096ff : color.new(#5d606b, 15) : na, linewidth=2, title='EMA 2')
plot(ema3, color=showRibbon ? ribbonDir ? #57abff : color.new(#5d606b, 15) : na, linewidth=2, title='EMA 3')
plot(ema4, color=showRibbon ? ribbonDir ? #85c2ff : color.new(#5d606b, 15) : na, linewidth=2, title='EMA 4')
plot(ema5, color=showRibbon ? ribbonDir ? #9bcdff : color.new(#5d606b, 30) : na, linewidth=2, title='EMA 5')
plot(ema6, color=showRibbon ? ribbonDir ? #b3d9ff : color.new(#5d606b, 30) : na, linewidth=2, title='EMA 6')
plot(ema7, color=showRibbon ? ribbonDir ? #c9e5ff : color.new(#5d606b, 30) : na, linewidth=2, title='EMA 7')
p8 = plot(ema8, color=showRibbon ? ribbonDir ? #dfecfb : color.new(#5d606b, 30) : na, linewidth=2, title='EMA 8')
fill(p1, p2, color.new(#1573d4, 85))
fill(p2, p8, color.new(#1573d4, 85))

//ichimoku##################################################

//color
colorblue = #3300CC
colorred = #993300
colorwhite = #FFFFFF
colorgreen = #CCCC33
colorpink = #CC6699
colorpurple = #6633FF

//switch
switch1 = input(false, title='Chikou')
switch2 = input(false, title='Tenkan')
switch3 = input(false, title='Kijun')

middleDonchian(Length) =>
    lower = ta.lowest(Length)
    upper = ta.highest(Length)
    math.avg(upper, lower)

//Functions
conversionPeriods = input.int(9, minval=1)
basePeriods = input.int(26, minval=1)
laggingSpan2Periods = input.int(52, minval=1)
displacement = input.int(26, minval=1)
Tenkan = middleDonchian(conversionPeriods)
Kijun = middleDonchian(basePeriods)
xChikou = close
SenkouA = middleDonchian(laggingSpan2Periods)
SenkouB = (Tenkan[basePeriods] + Kijun[basePeriods]) / 2

//Plot
A = plot(SenkouA[displacement], color=color.new(colorpurple, 0), title='SenkouA')
B = plot(SenkouB, color=color.new(colorgreen, 0), title='SenkouB')
plot(switch1 ? xChikou : na, color=color.new(colorpink, 0), title='Chikou', offset=-displacement)
plot(switch2 ? Tenkan : na, color=color.new(colorred, 0), title='Tenkan')
plot(switch3 ? Kijun : na, color=color.new(colorblue, 0), title='Kijun')
fill(A, B, color=color.new(colorgreen, 90), title='Ichimoku Cloud')

//Buy and Sell signals
fukuiz = math.avg(ema2, ema8)
white = ema2 > ema8
gray = ema2 < ema8
buycond = white and white[1] == 0
sellcond = gray and gray[1] == 0
bullish = ta.barssince(buycond) < ta.barssince(sellcond)
bearish = ta.barssince(sellcond) < ta.barssince(buycond)
buy = bearish[1] and buycond and fukuiz > SenkouA[displacement] and fukuiz > SenkouB
sell = bullish[1] and sellcond and fukuiz > SenkouA[displacement] and fukuiz > SenkouB
sell2=ema2 < ema8
buy2 = white and fukuiz > SenkouA[displacement] and fukuiz > SenkouB

//$$$$$$$$$$$$$$$$$$$$$$$$$$$$$$$$$$$$$$$$$$$$$$$$$$$$$$$$$$$$$$$$$$$$$$
//Back test

startYear = input.int(defval=2017, title='Start Year', minval=2000, maxval=3000)
startMonth = input.int(defval=1, title='Start Month', minval=1, maxval=12)
startDay = input.int(defval=1, title='Start Day', minval=1, maxval=31)
endYear = input.int(defval=2023, title='End Year', minval=2000 ,maxval=3000)
endMonth = input.int(defval=12, title='End Month', minval=1, maxval=12)
endDay = input.int(defval=31, title='End Day', minval=1, maxval=31)

start = timestamp(startYear, startMonth, startDay, 00, 00)
end = timestamp(endYear, endMonth, endDay, 23, 59)
period() => time >= start and time <= end ? true : false

if buy2
    strategy.entry("Enter Long", strategy.long)
else if sell2
    strategy.entry("Enter Short", strategy.short)
- Multi-EMA-Swing-Trading-Strategie mit ATR-basiertem Risikomanagement
- Adaptiver Trend nach Strategie mit dynamischem Abzugsteuerungssystem
- Multi-EMA-Golden Cross-Strategie mit getrennter Gewinnspanne
- Dynamische Buy-Entry-Strategie, die EMA-Crossing und Candle Body Penetration kombiniert
- Intelligente Wellen-Trend-Dollar-Kosten-Durchschnitts-Zyklische Handelsstrategie
- Anpassungsfähige EMA-Dynamische Position-Breakout-Handelsstrategie
- Dynamische Wellen-Trend-Tracking-Strategie
- Handelsstrategie für den Handel mit mehreren Indikatoren
- Multi-Filter Trend Durchbruch Smart Moving Average Handelsstrategie
- Dynamische EMA-Strategie für Durchbruch und Umkehr
- Multi-Indikator-Trend nach Optionenhandel EMA-Kreuzstrategie
- Momentum-basierte ZigZag
- VuManChu-Chiffer B + Divergenzstrategie
- Konzept Dual SuperTrend
- Super Scalper
- Zurückprüfung - Indikator
- Trendylich
- Sma-BTC-Killer
- ML-Warnungsvorlage
- Fibonacci-Progression mit Pausen
- RSI MTF Ob+Os
- MTF Ob+Os der KMU
- Ein intelligenter MACD
- Strategie des OCC R5.1
- Willkommen auf dem Bärenmarkt.
- - Ich weiß.
- Drehpunkte Hoch-Niedrig-Multi-Zeitrahmen
- Geistertrends verfolgen Strategiedatenbanken
- Geistertrends verfolgen Strategien für die Geschäftsbank
- Geistertrend-Verfolgungsstrategien
- Regenbogen-Oszillator