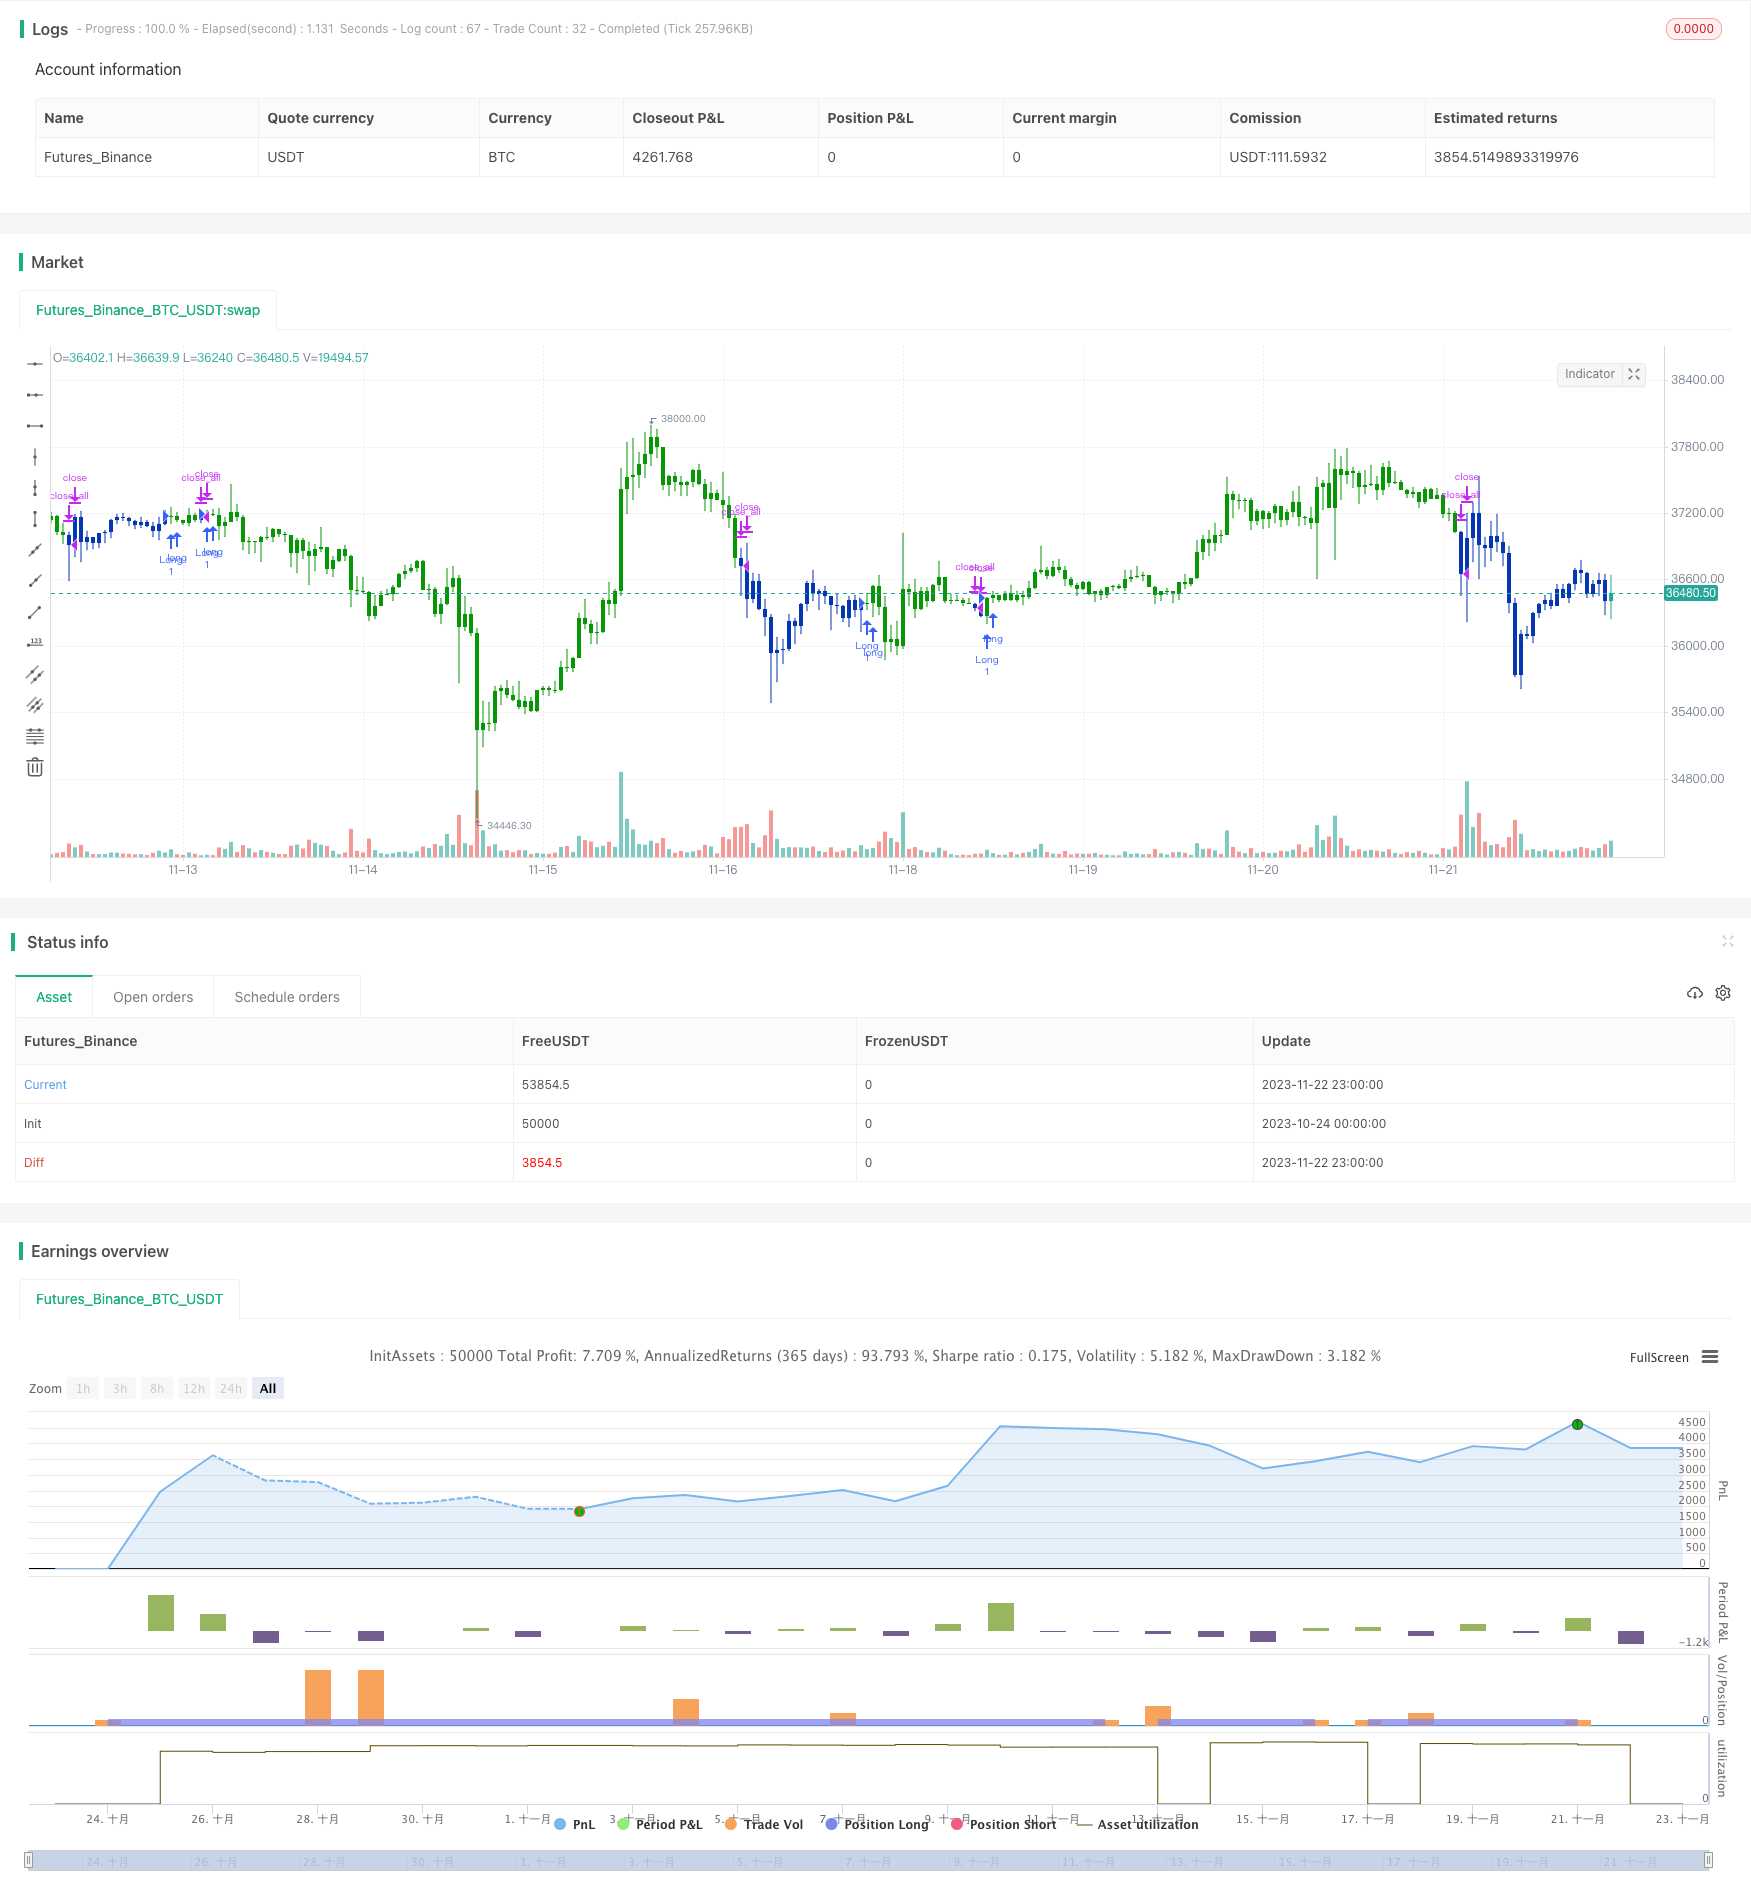
Momentum-Reversal-Dual-Track-Pairing-Strategie

Überblick
Die Strategie verwendet mehrere technische Indikatoren, um eine Dynamikumkehr mit einer Doppelschienen-Paarung zu erreichen, um ein Handelssignal zu bilden. Die Strategie verwendet 123 Formen, um einen Wendepunkt zu bestimmen, um ein Paarungssignal mit einem ergodic CSI-Indikator zu bilden, um einen Trend zu verfolgen. Die Strategie zielt darauf ab, einen mittleren kurzfristigen Trend zu erfassen und einen höheren Gewinn zu erzielen.
Strategieprinzip
Die Strategie besteht aus zwei Teilen:
- 123 Wendepunkte für die Formentscheidung
- ergodic CSI-Indikatoren erzeugen ein Paarungssignal
Die 123-Form-Beschlüsse werden anhand der letzten 3 K-Linien-Klusskursbeziehungen für die Preisumkehr herangezogen. Die spezifische Beurteilungslogik lautet: Wenn die ersten beiden K-Linien nach einem Anstieg des Schlusskurses stehen und die aktuellen Schnell- und Langsam-Stoken-Indikatoren alle unter 50 liegen, ist dies ein Kaufsignal. Wenn die ersten beiden K-Linien nach einem Rückgang des Schlusskurses fallen und die aktuellen Schnell- und Langsam-Stock-Indikatoren alle über 50 liegen, wird ein Verkaufssignal ausgesprochen.
Der ergodic CSI-Indikator berücksichtigt mehrere Faktoren wie Preis, reale Bandbreite und Trendindikator, um die Entwicklung der Märkte zu beurteilen und Kauf- und Verkaufsbereiche zu erzeugen. Ein Kaufsignal wird erzeugt, wenn der Indikator über der Kaufzone liegt, und ein Verkaufsignal wird erzeugt, wenn er unter der Verkaufszone liegt.
Schließlich wird das Umkehrsignal der Form 123 mit dem Orbitalsignal der ergodischen CSI in einer Schnitt-Schnitt-Operation berechnet, um ein endgültiges Strategie-Signal zu erhalten.
Strategische Vorteile
- Das ist ein sehr interessanter Trend, der sich in den letzten Jahren stark entwickelt hat.
- Umkehrform-Urteile, um die Wendepunkte effektiv zu erfassen
- Doppelspur-Paarung reduziert Fehlsignale
Strategisches Risiko
- Die Aktienmärkte könnten abweichen, was zu Stop-Losses führen könnte.
- Umkehrformen sind anfällig für Marktschwankungen
- Die Optimierung der Parameter ist begrenzt und die Wirkung ist schwankend.
Optimierungsrichtung
- Optimierung von Parametern, um die Ertragswirksamkeit der Strategie zu verbessern
- Erhöhung der Stop-Loss-Logik und Verringerung der Einzelschäden
- Mehrfaktormodelle zur Verbesserung der Aktienqualität
Zusammenfassen
Die Strategie ermöglicht die effektive Verfolgung von Kurz-Zentral-Trend-Trends durch die Pairing von Inversion-Form und Doppelbahn. Es hat eine höhere Stabilität und Gewinnspanne im Vergleich zu einem einzigen technischen Indikator. Der nächste Schritt besteht darin, die Parameter weiter zu optimieren und die Stop-Loss- und Stock-Option-Module zu erweitern, um Rücktritte zu verringern und die Gesamtwirkung zu verbessern.
/*backtest
start: 2023-10-24 00:00:00
end: 2023-11-23 00:00:00
period: 1h
basePeriod: 15m
exchanges: [{"eid":"Futures_Binance","currency":"BTC_USDT"}]
*/

//@version=4
////////////////////////////////////////////////////////////
//  Copyright by HPotter v1.0 22/07/2020
// This is combo strategies for get a cumulative signal.
//
// First strategy
// This System was created from the Book "How I Tripled My Money In The
// Futures Market" by Ulf Jensen, Page 183. This is reverse type of strategies.
// The strategy buys at market, if close price is higher than the previous close
// during 2 days and the meaning of 9-days Stochastic Slow Oscillator is lower than 50.
// The strategy sells at market, if close price is lower than the previous close price
// during 2 days and the meaning of 9-days Stochastic Fast Oscillator is higher than 50.
//
// Second strategy
// This is one of the techniques described by William Blau in his book
// "Momentum, Direction and Divergence" (1995). If you like to learn more,
// we advise you to read this book. His book focuses on three key aspects
// of trading: momentum, direction and divergence. Blau, who was an electrical
// engineer before becoming a trader, thoroughly examines the relationship between
// price and momentum in step-by-step examples. From this grounding, he then looks
// at the deficiencies in other oscillators and introduces some innovative techniques,
// including a fresh twist on Stochastics. On directional issues, he analyzes the
// intricacies of ADX and offers a unique approach to help define trending and
// non-trending periods.
// This indicator plots Ergotic CSI and smoothed Ergotic CSI to filter out noise.
//
// WARNING:
// - For purpose educate only
// - This script to change bars colors.
////////////////////////////////////////////////////////////
Reversal123(Length, KSmoothing, DLength, Level) =>
    vFast = sma(stoch(close, high, low, Length), KSmoothing)
    vSlow = sma(vFast, DLength)
    pos = 0.0
    pos := iff(close[2] < close[1] and close > close[1] and vFast < vSlow and vFast > Level, 1,
	         iff(close[2] > close[1] and close < close[1] and vFast > vSlow and vFast < Level, -1, nz(pos[1], 0)))
	pos

fADX(Len) =>
    up = change(high)
    down = -change(low)
    trur = rma(tr, Len)
    plus = fixnan(100 * rma(up > down and up > 0 ? up : 0, Len) / trur)
    minus = fixnan(100 * rma(down > up and down > 0 ? down : 0, Len) / trur)
    sum = plus + minus
    100 * rma(abs(plus - minus) / (sum == 0 ? 1 : sum), Len)

ECSI(r,Length,BigPointValue,SmthLen,SellZone,BuyZone) =>
    pos = 0
    source = close
    K = 100 * (BigPointValue / sqrt(r) / (150 + 5))
    xTrueRange = atr(1)
    xADX = fADX(Length)
    xADXR = (xADX + xADX[1]) * 0.5
    nRes = iff(Length + xTrueRange > 0, K * xADXR * xTrueRange / Length,0)
    xCSI = iff(close > 0,  nRes / close, 0)
    xSMA_CSI = sma(xCSI, SmthLen)
    pos := iff(xSMA_CSI > BuyZone, 1,
             iff(xSMA_CSI <= SellZone, -1, nz(pos[1], 0)))
    pos

strategy(title="Combo Backtest 123 Reversal & Ergodic CSI", shorttitle="Combo", overlay = true)
Length = input(14, minval=1)
KSmoothing = input(1, minval=1)
DLength = input(3, minval=1)
Level = input(50, minval=1)
//-------------------------
r = input(32, minval=1)
LengthECSI = input(1, minval=1)
BigPointValue = input(1.0, minval=0.00001)
SmthLen = input(5, minval=1)
SellZone = input(0.06, minval=0.00001)
BuyZone = input(0.02, minval=0.001)
reverse = input(false, title="Trade reverse")
posReversal123 = Reversal123(Length, KSmoothing, DLength, Level)
posECSI = ECSI(r,LengthECSI,BigPointValue,SmthLen,SellZone,BuyZone)
pos = iff(posReversal123 == 1 and posECSI == 1 , 1,
	   iff(posReversal123 == -1 and posECSI == -1, -1, 0))
possig = iff(reverse and pos == 1, -1,
          iff(reverse and pos == -1 , 1, pos))
if (possig == 1)
    strategy.entry("Long", strategy.long)
if (possig == -1)
    strategy.entry("Short", strategy.short)
if (possig == 0)
    strategy.close_all()
barcolor(possig == -1 ? #b50404: possig == 1 ? #079605 : #0536b3 )