概述
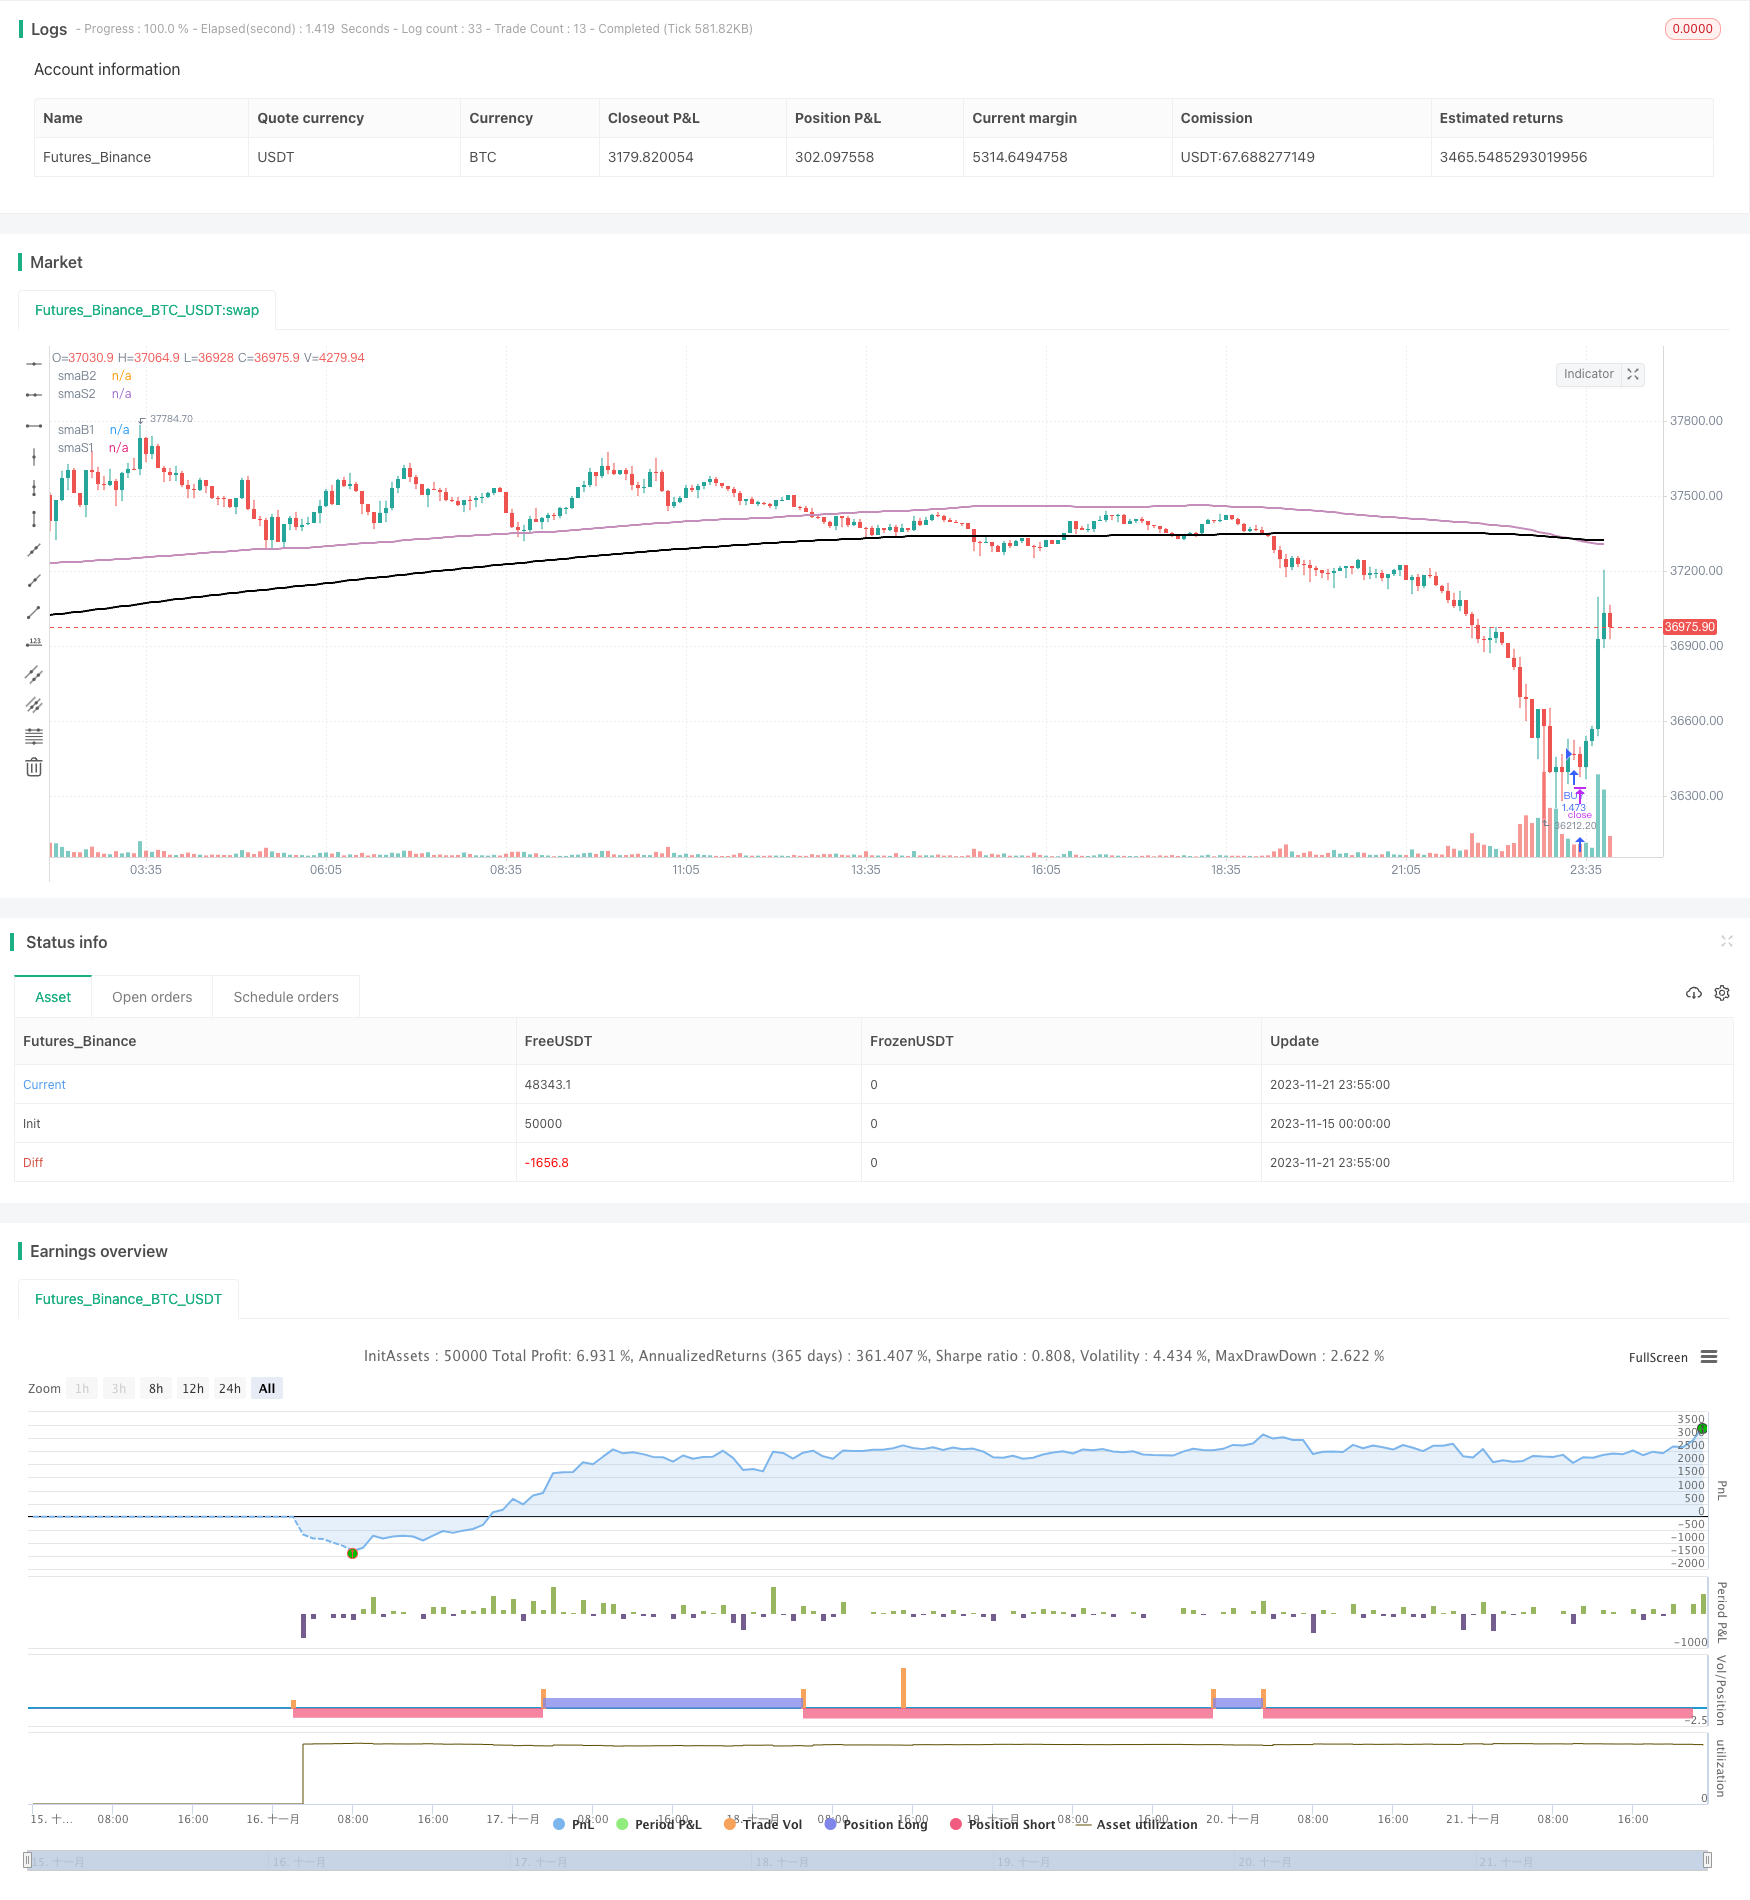
均线交叉策略通过计算两个不同参数设置的SMA均线的交叉来产生交易信号。当较快的SMA均线上穿较慢的SMA均线时,产生买入信号;当较慢的SMA均线下穿较快的SMA均线时,产生卖出信号。该策略同时使用两组SMA均线参数,一组用于确定买入点,另一组用于确定卖出点。
策略原理
该策略中使用了两组SMA均线参数,分别是smaB1、smaB2和smaS1、smaS2。smaB1和smaB2用于确定买入信号,它们分别代表较慢和较快的均线。当smaB1上穿smaB2时产生买入信号。smaS1和smaS2用于确定卖出信号,同样分别代表较慢和较快的均线。当smaS2下穿smaS1时产生卖出信号。这样可以灵活地调整买入和卖出条件,适应不同的市场环境。
具体来说,该策略通过计算close价格的SMA值,并实时监测两组SMA均线的交叉情况来判断买入和卖出的时机。在SMA快线上穿慢线时,认为价格走势正向上,因此此时做多;而在SMA慢线下穿快线时,判断价格走势转为下降,因此平掉多单。
优势分析
该策略有以下主要优势:
- 使用双均线交叉系统,可以灵活调整买入卖出条件,适应市场变化
- SMA均线本身可以滤波掉部分噪音,产生较为可靠的交易信号
- 允许自定义SMA参数组合,可以针对不同品种优化参数
风险分析
该策略也存在一些风险:
- 均线交叉信号可能滞后,无法在转折点前后立即产生信号
- 选择不当的SMA参数组合可能导致过多错误信号
- 大幅震荡市场中产生的信号效果可能不佳
为控制上述风险,可以通过优化SMA参数组合,结合动态止损来锁定利润等方法进行改进。
优化方向
该策略可以从以下几个方面进行优化:
- 测试更多SMA参数组合,寻找最佳参数
- 增加成交量的确认,避免在价格剧烈波动时产生错误信号
- 结合其他指标(如MACD、RSI等)过滤SMA交叉信号
- 增加止损策略,以锁定利润并减少亏损
总结
均线交叉策略通过计算两组SMA均线的交叉情况,产生简单有效的交易信号。该策略允许灵活调整参数,适用于不同品种,是一种常用的趋势跟踪策略。通过参数优化、信号过滤等方法可以进一步改进该策略,使其产生更可靠的信号。
策略源码
/*backtest
start: 2023-11-15 00:00:00
end: 2023-11-22 00:00:00
period: 5m
basePeriod: 1m
exchanges: [{"eid":"Futures_Binance","currency":"BTC_USDT"}]
*/

// This source code is subject to the terms of the Mozilla Public License 2.0 at https://mozilla.org/MPL/2.0/
// © melihtuna

//@version=4
strategy("SMA Strategy", overlay=true, default_qty_type=strategy.percent_of_equity, default_qty_value=100, initial_capital=10000, currency=currency.USD, commission_value=0.1, commission_type=strategy.commission.percent)

smaB1 = input(title="smaB1",defval=377)
smaB2 = input(title="smaB2",defval=200)
smaS1 = input(title="smaS1",defval=377)
smaS2 = input(title="smaS2",defval=200)
smawidth = 2

plot(sma(close, smaB1), color = #EFB819, linewidth=smawidth, title='smaB1')
plot(sma(close, smaB2), color = #FF23FD, linewidth=smawidth, title='smaB2')
plot(sma(close, smaS1), color = #000000, linewidth=smawidth, title='smaS1')
plot(sma(close, smaS2), color = #c48dba, linewidth=smawidth, title='smaS2')

// === INPUT BACKTEST RANGE ===
FromMonth = input(defval = 1, title = "From Month", minval = 1, maxval = 12)
FromDay   = input(defval = 1, title = "From Day", minval = 1, maxval = 31)
FromYear  = input(defval = 2020, title = "From Year", minval = 2017)
ToMonth   = input(defval = 1, title = "To Month", minval = 1, maxval = 12)
ToDay     = input(defval = 1, title = "To Day", minval = 1, maxval = 31)
ToYear    = input(defval = 9999, title = "To Year", minval = 2017)

// === FUNCTION EXAMPLE ===
start     = timestamp(FromYear, FromMonth, FromDay, 00, 00)
finish    = timestamp(ToYear, ToMonth, ToDay, 23, 59)
window()  => time >= start and time <= finish ? true : false

longCondition = crossover(sma(close, smaB1),sma(close, smaB2))

if (window() and longCondition)
    strategy.entry("BUY", strategy.long)

shortCondition = crossover(sma(close, smaS2),sma(close, smaS1))

if (window() and shortCondition)
    strategy.entry("SELL", strategy.short)