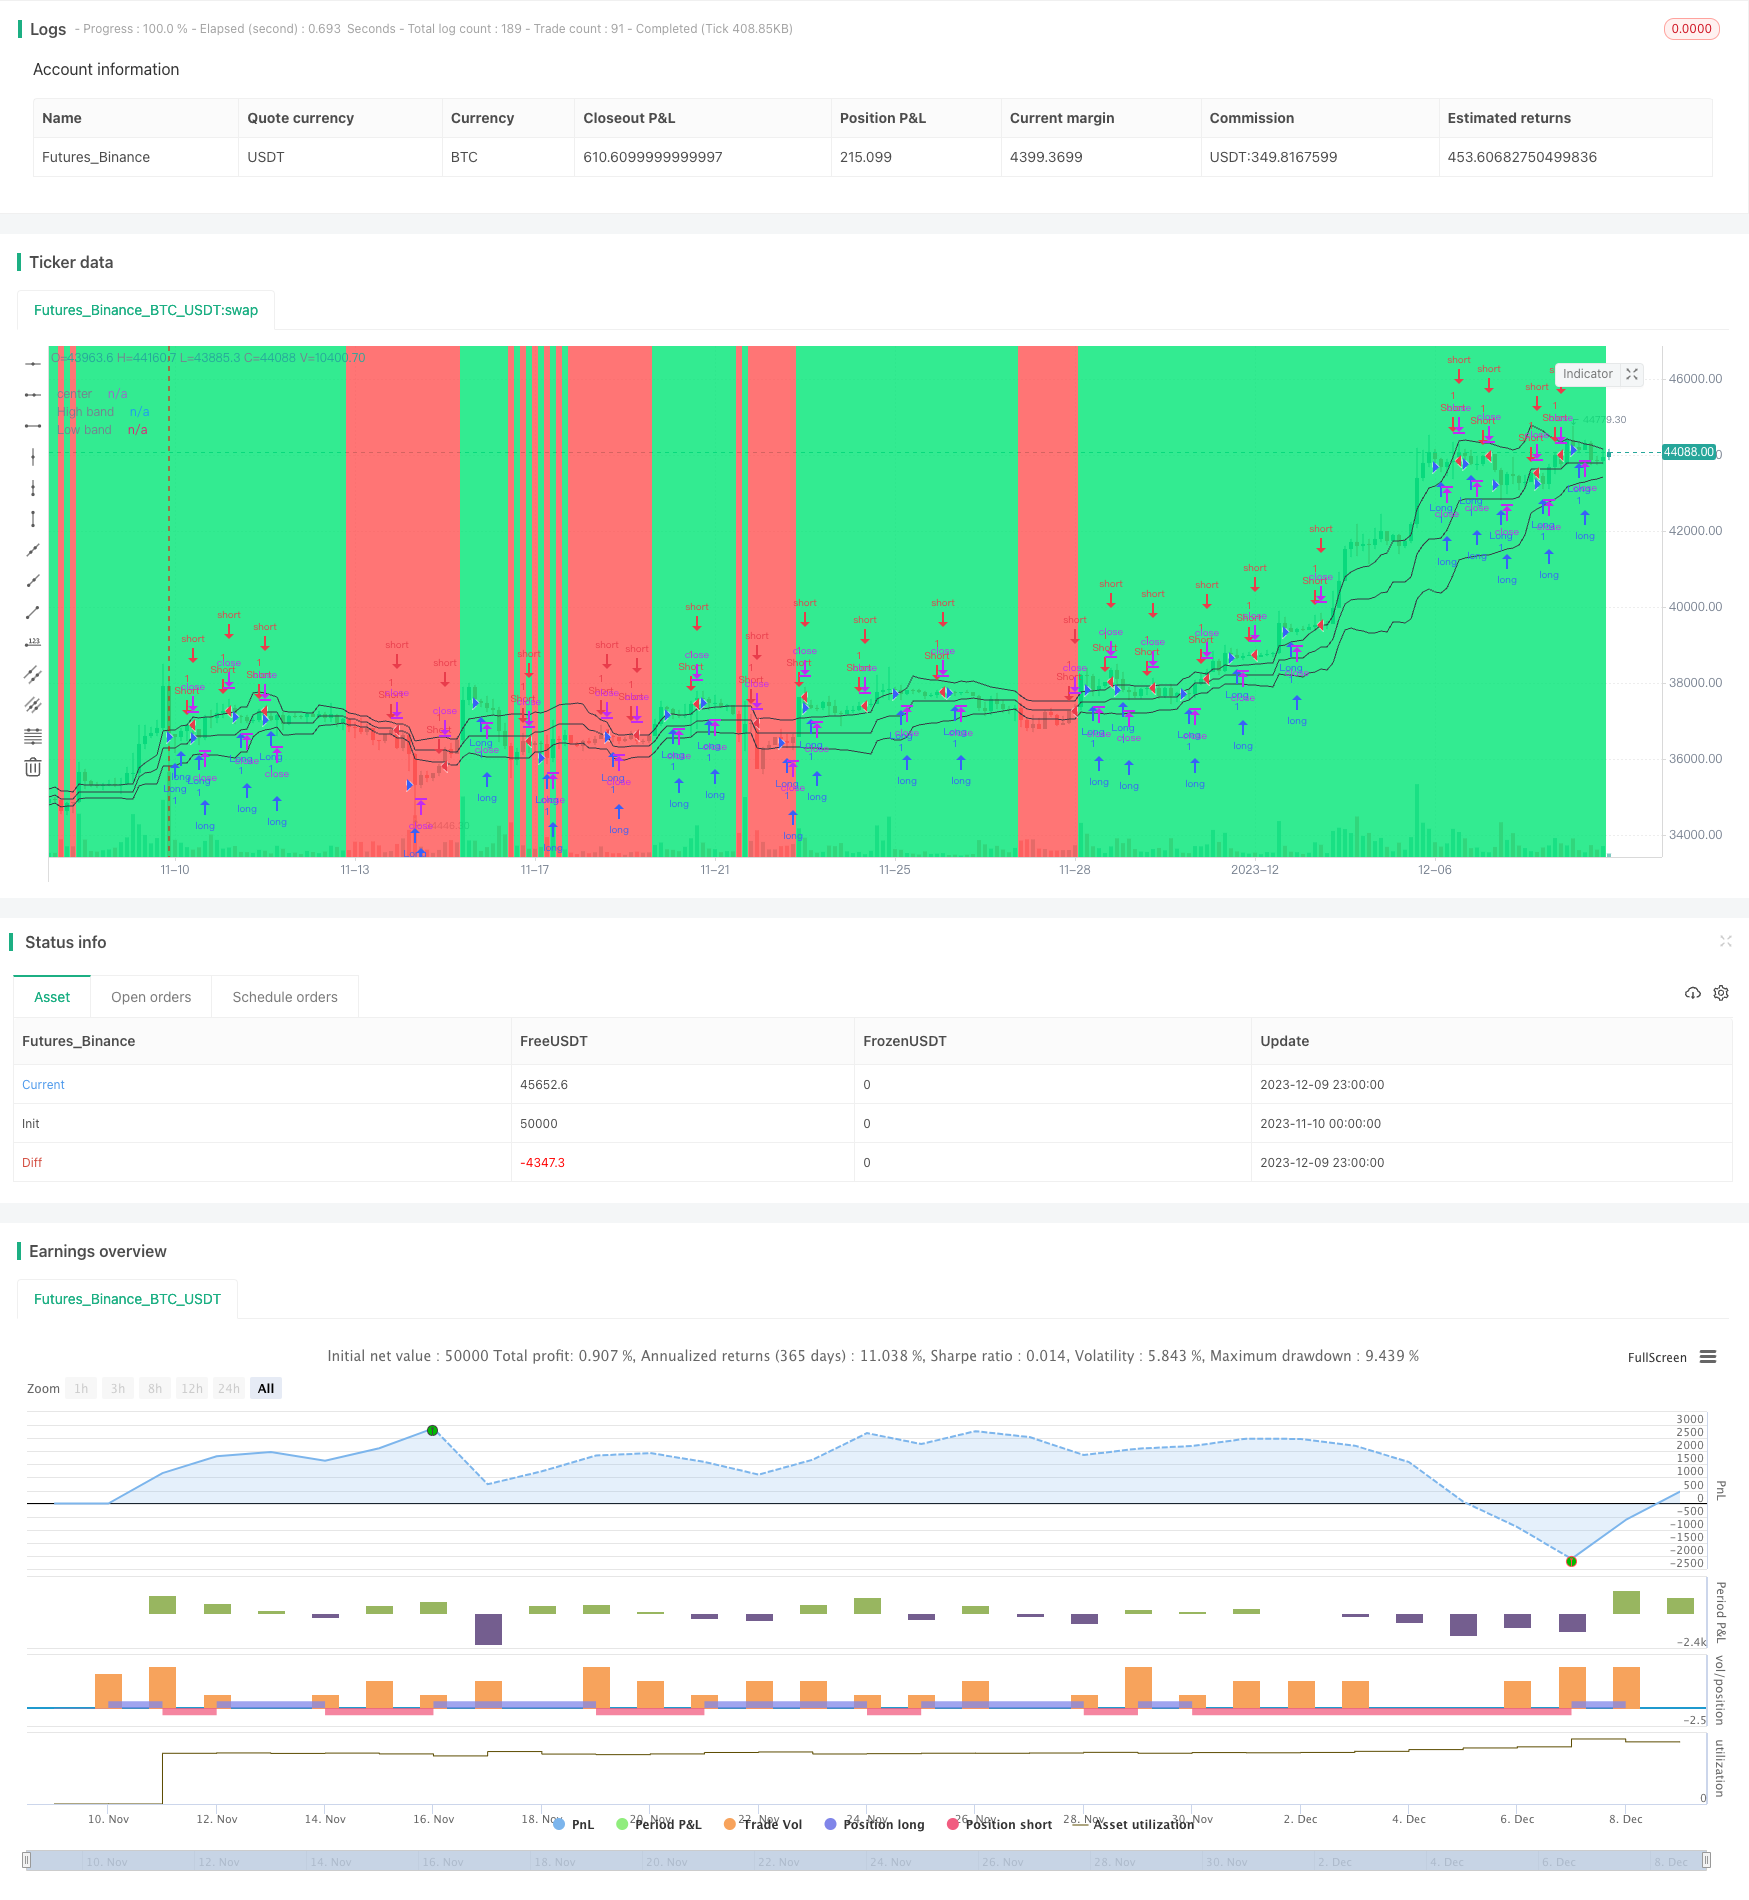
Noro Volatility Channel Scalping-Strategie

Überblick
Noro’s Price Channel Scalping Strategy ist eine Scalping-Handelsstrategie, die auf Preiskanälen und Preisbandschwankungen basiert. Die Strategie nutzt die Preiskanäle und die Preisschwankungen, um Markttrends zu erkennen und bei einer Trendwende einzugreifen.
Strategieprinzip
Die Strategie berechnet zunächst die höchsten und niedrigsten Preiskanäle des Preises und berechnet dann die mittlere Linie des Preiskanals. Anschließend werden die Entfernung des Preises von der mittleren Linie und der einfache bewegliche Durchschnitt der Entfernung berechnet. Daraus können die Preisschwankungsbänder mit der Distanz der mittleren Linie 1x und 2x berechnet werden.
Die Strategie wird bei Anzeichen von Verfall umgekehrt geöffnet. Zum Beispiel, wenn ein bullish Trend auftritt, wenn zwei Positionen entstehen, dann schließen Sie die zweite Position, wenn die zweite Position schließt. Wenn ein bullish Trend auftritt, wenn zwei Positionen entstehen, dann schließen Sie die zweite Position.
Strategische Vorteile
- Die Verwendung von Preiskanälen zur Beurteilung von Markttrends und zur Vermeidung von Fehlhandlungen
- Die Trendwende wird anhand von Preisschwankungen beurteilt, um die Wendepunkte genau zu erfassen.
- Scalping-Handelsmethode, um schnell zu profitieren
Strategisches Risiko
- Bei starken Preisschwankungen können Preiskanäle und Bandbreiten ausfallen.
- Scalping erfordert eine hohe Handelsfrequenz und ist anfällig für erhöhte Handelskosten und Risiken
- Das Risiko von Verlusten muss durch eine Stop-Loss-Strategie kontrolliert werden.
Strategieoptimierung
- Optimierung der Parameter für Preiskanäle und Bandbreiten, um sie besser an Marktbedingungen anzupassen
- Trends und Wendepunkte in Kombination mit anderen Indikatoren
- Erhöhung der Stop-Loss-Strategie
- Berücksichtigung der Auswirkungen von Transaktionskosten und Gleitpunkten
Zusammenfassen
Die Noro Wave Channel-Scalping-Strategie ist insgesamt eine sehr geeignete Strategie für den Scalping-Handel. Sie nutzt die Preiskanäle und die Bandbreiten, um die Marktentwicklung zu beurteilen und bei Anzeichen für einen Höchststand oder einen Tiefpunkt die Position rückgängig zu machen. Die Strategie hat eine hohe Handelsfrequenz und eine schnelle Ertragslage, ist jedoch mit einem gewissen Risiko verbunden.
/*backtest
start: 2023-11-10 00:00:00
end: 2023-12-10 00:00:00
period: 3h
basePeriod: 15m
exchanges: [{"eid":"Futures_Binance","currency":"BTC_USDT"}]
*/


//@version=2
strategy("Noro's Bands Scalper Strategy v1.0", shorttitle = "Scalper str 1.0", overlay=true, default_qty_type = strategy.percent_of_equity, default_qty_value=100.0, pyramiding=0)

//Settings
needlong = input(true, defval = true, title = "Long")
needshort = input(true, defval = true, title = "Short")
len = input(20, defval = 20, minval = 2, maxval = 200, title = "Period")
needbb = input(true, defval = true, title = "Show Bands")
needbg = input(true, defval = true, title = "Show Background")
src = close

//PriceChannel
lasthigh = highest(src, len)
lastlow = lowest(src, len)
center = (lasthigh + lastlow) / 2

//Distance
dist = abs(src - center)
distsma = sma(dist, len)
hd = center + distsma
ld = center - distsma
hd2 = center + distsma * 2
ld2 = center - distsma * 2

//Trend
trend = close < ld and high < hd ? -1 : close > hd and low > ld ? 1 : trend[1]

//Lines
colo = needbb == false ? na : black
plot(hd, color = colo, linewidth = 1, transp = 0, title = "High band")
plot(center, color = colo, linewidth = 1, transp = 0, title = "center")
plot(ld, color = colo, linewidth = 1, transp = 0, title = "Low band")

//Background
col = needbg == false ? na : trend == 1 ? lime : red
bgcolor(col, transp = 80)

//Signals
bar = close > open ? 1 : close < open ? -1 : 0
up7 = trend == 1 and bar == -1 and bar[1] == -1 ? 1 : 0
dn7 = trend == 1 and bar == 1 and bar[1] == 1 and close > strategy.position_avg_price ? 1 : 0
up8 = trend == -1 and bar == -1 and bar[1] == -1 and close < strategy.position_avg_price ? 1 : 0
dn8 = trend == -1 and bar == 1 and bar[1] == 1 ? 1 : 0

if up7 == 1 or up8 == 1
    strategy.entry("Long", strategy.long, needlong == false ? 0 : trend == -1 ? 0 : na)

if dn7 == 1 or dn8 == 1
    strategy.entry("Short", strategy.short, needshort == false ? 0 : trend == 1 ? 0 : na)