Hybride quantitative Handelsstrategie mit zwei Indikatoren
Schriftsteller:ChaoZhang, Datum: 2023-12-20 10:31:06Tags:
Übersicht
Diese Strategie kombiniert doppelte Indikatoren, um die Trendrichtung zu identifizieren und Trades zu tätigen. Erstens verwendet sie die Überschneidung von zwei gleitenden Durchschnitten (schnell und mittelfristig), um den kurzfristigen Trend zu beurteilen; zweitens verwendet sie Kanalbereich und langfristigen gleitenden Durchschnitt, um die Haupttrendrichtung zu bestimmen. Handelssignale werden nur erzeugt, wenn die beiden Urteile konsistent sind. Die hybride Strategie mit mehreren Indikatoren kann falsche Signale effektiv filtern und die Stabilität verbessern.
Strategieprinzip
Die Strategie verwendet drei Sätze von Indikatoren für das Urteilen. Erstens, das goldene Kreuz und das Todeskreuz der schnellen EMA (26 Perioden) und der mittleren EMA (50 Perioden) zur Bestimmung des kurzfristigen Trends; zweitens, berechnen Sie den Kanalbereich, um den mittelfristigen Trend zu beurteilen; schließlich berechnen Sie den langfristigen SMA (200 Perioden) und vergleichen Sie mit dem Preis, um die Haupttrendrichtung zu bestimmen. Handelssignale werden nur erzeugt, wenn alle drei Urteile konsistent sind.
Insbesondere lautet die Logik:
-
Crossover von schnellen und mittleren gleitenden Durchschnitten (goldenes Kreuz für bullish, Todeskreuz für bearish), um den kurzfristigen Trend zu bestimmen.
-
Ob der Preis durch den Kanalbereich bricht, um den mittelfristigen Trend zu bestimmen. Der Kanalbereich basiert auf dem langfristigen MA plus/minus ATR mal einem Koeffizienten.
-
Vergleich des Preises mit dem langfristigen MA zur Bestimmung des wesentlichen Trends.
Schließlich werden Handelssignale nur generiert, wenn alle drei Urteile konsistent sind.
Strategische Vorteile
Diese hybride Strategie mit zwei Indikatoren hat mehrere Vorteile:
-
Wirksam falsche Signale filtern und die Stabilität verbessern, da Handelssignale von mehreren Indikatoren validiert werden müssen, um Fehler aus einer einzigen Metrik zu vermeiden.
-
Hohe Flexibilität bei der Anpassung von Parametern für verschiedene Märkte.
-
Der Trendhandel und der Range-Handel werden kombiniert. Mittelfristige und kurzfristige Indikatoren fangen Trends auf, langfristige Indikatoren bestimmen den Range. Insgesamt verfügt er über die Vorzüge sowohl von Trend- als auch von Mittelumkehrstrategien.
-
Hohe Kapitalnutzungseffizienz: Bestellungen werden nur erteilt, wenn mehrere Indikatoren übereinstimmen, um unnötige Geschäfte zu vermeiden.
Strategische Risiken
Es gibt auch einige Risiken:
-
Parameter, die das Risiko festlegen. MA-Perioden und Kanalbereich müssen richtig konfiguriert werden, falsche Einstellungen können Trends nicht erkennen oder zu übermäßigen falschen Signalen führen.
-
Erhöhte Opportunitätskosten durch doppelte Indikatoren Im Vergleich zu Einzelindikatorstrategien können einige Handelsmöglichkeiten verpasst werden, da sie nicht an den optimalen Punkten eingehen und aussteigen können.
-
Der Stop-Loss-Mechanismus erfordert Vorsicht. Der Breakout-Stop-Loss hier kann unnötige Verluste verursachen. Stop-Loss-Prozentsatz muss sorgfältig konfiguriert werden.
-
Diese Strategie funktioniert besser auf Märkten mit offensichtlichem Trend.
Optimierung der Strategie
Die Strategie kann in folgenden Aspekten verbessert werden:
-
Testen Sie verschiedene Parameterkombinationen, um das Optimum zu finden. Mehr Backtests mit historischen Daten, um optimale Konfigurationen zu finden.
-
Hinzufügen eines anpassungsfähigen Stop-Loss-Mechanismus.
-
Unterstützung bei Volumenindikatoren an kritischen Punkten, Bewertung der Positionsgröße nach Volumen zur Verbesserung der Kapitaleffizienz.
-
Optimieren Sie die Eintrittslogik. Betrachten Sie stufenweise Einträge mit Kostendurchschnitt, um das Risiko eines einzigen Eintritts zu reduzieren.
-
Kombinieren Sie maschinelle Lernmodelle, führen Sie neuronale Netzwerke ein, um die Robustheit und Fitness des Modells zu beurteilen.
Zusammenfassung
Diese Strategie nutzt dreifache Zeitrahmenindikatoren und doppelte Validierung, um falsche Signale zu unterdrücken und die Stabilität zu verbessern. Inzwischen besitzt sie die Vorzüge sowohl des Trend- als auch des Range-Handels, mit hoher Kapitalnutzungseffizienz. Sie kann durch Parameteroptimierung, Stop-Loss-Tuning, Integration mit Volumenindikatoren usw. verbessert werden.
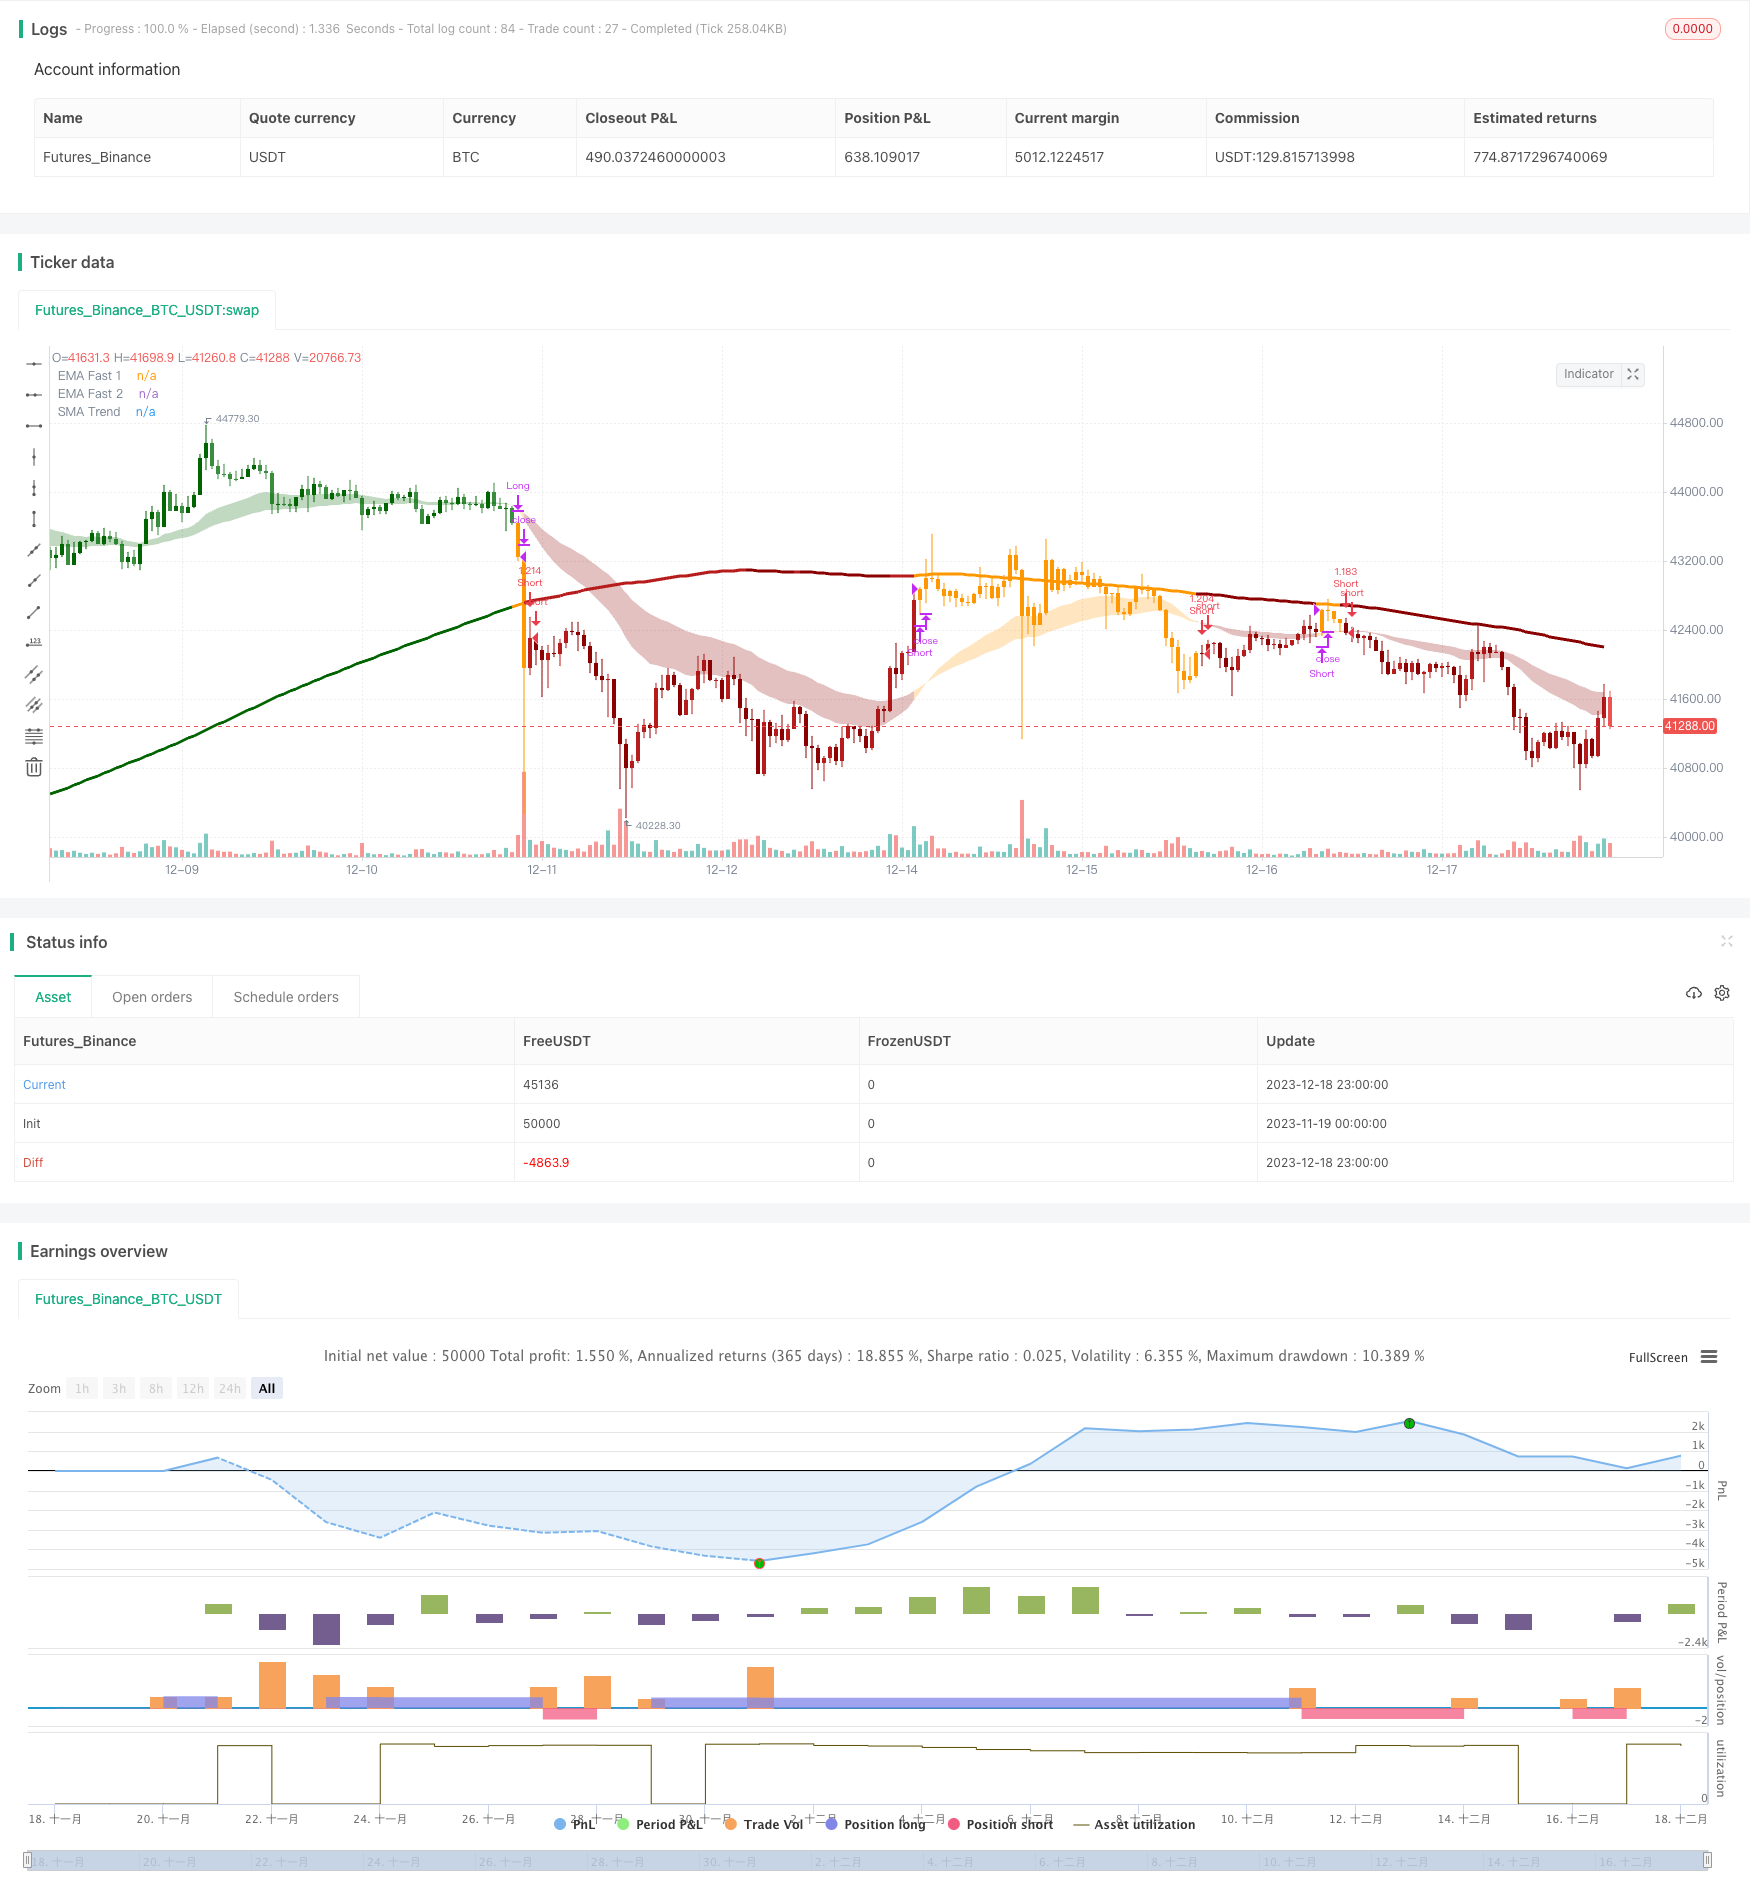
/*backtest
start: 2023-11-19 00:00:00
end: 2023-12-19 00:00:00
period: 1h
basePeriod: 15m
exchanges: [{"eid":"Futures_Binance","currency":"BTC_USDT"}]
*/

//@version=5
// Indicator to combines:
//           Trend Channel[Gu5] (SMA 200) +
//           EMA's cross  (26, 50 ) +
//           Golden Cross (50, 200)
// Author: @gu5tavo71 08/2019
// v2.3.6, 2022.02.18
// Trend Channel [Gu5] // Author: @gu5tavo71 08/2019
//
// This source code is subject to these terms:
// Attribution-NonCommercial 4.0 International (CC BY-NC 4.0)
// https://www.safecreative.org/work/2202190517452-mix1-ema-cross-trend-channel-gu5-
// You are free to:
// Share, copy and redistribute this script
// Adapt, transform and build on this script
// Under the following terms:
// Non-commercial: You cannot sell my indicator. You can't sell my work.
// Attribution: If you post part of my code, you must give me proper credit
//
// I am using part of this code published by @PineCoders and Public Library
// Disclaimer: I am not a financial advisor.
//             For purpose educate only. Use at your own risk.
strategy(title = 'Mix1 : Ema Cross + Trend Channel [Gu5] - Backtest', shorttitle = 'Mix01', overlay = true,
  initial_capital = 100,
  default_qty_value = 100,
  default_qty_type = strategy.percent_of_equity,
  commission_value = 0.075,
  commission_type = strategy.commission.percent,
  format = format.price,
  precision = 2,
  process_orders_on_close = true)


// ---------   Inputs                       "=============================="           |
i_maSrc      = input.source     (close,     'MA Source'                     , group    = 'EMAs')
i_maFast1    = input.int        (26,        'EMA Fast'                      , group    = 'EMAs')
i_maFast2    = input.int        (50,        'EMA Medium'                    , group    = 'EMAs')
i_maLen      = input.int        (200,       'MA Trend'                      , group    = 'Trend Channel')
o_maLen1     =                              'EMA'
o_maLen2     =                              'SMA'
i_maLenSel   = input.string     (o_maLen2,  'MA Type'                       , group    = 'Trend Channel',
               options = [o_maLen1, o_maLen2],
               tooltip = "EMA or SMA")
i_htf        = input.timeframe  ('',        'Select Higher Timeframe'       , tooltip  = 'Only for MA Trend'  , group    = 'Trend Channel')
i_rangeLen   = input.float      (0.618,     'Channel Range Length'          , tooltip  = 'ATR of the MA Trend', group    = 'Trend Channel')
i_slOn       = input.bool       (false,     '■ Stop Loss On/Off'            , group    = 'Stop Loss')
i_sl         = input.float      (2.618,     'SL %'                          , step     = 0.1, group    = 'Stop Loss')
i_periodSw   = input.bool       (true,      '■ Period On/Off'               , group    = 'Period')
o_start      = timestamp        (           '2020-01-01 00:00 GMT-3'        )
o_end        = timestamp        (           '2099-12-31 00:00 GMT-3'        )
i_periodStar = input       (o_start,   'Start Time'                    , group    = 'Period')
i_periodEnd  = input       (o_end,     'End Time'                      , group    = 'Period')
o_posSel1    =                              'Only Long'
o_posSel2    =                              'Only Short'
o_posSel3    =                              'Both'
i_posSel     = input.string     (o_posSel3, 'Position Type'                 , group   = 'Strategy',
               options = [o_posSel1, o_posSel2, o_posSel3],
               tooltip = "Only Long, Only short or Both")
o_typeS1     =                              'Strategy 1'
o_typeS2     =                              'Strategy 2'
i_typeS      = input.string     (o_typeS2,  'Strategy Type'                 , group   = 'Strategy',
               options = [o_typeS1, o_typeS2],
               tooltip = "Strategy 1:\nLong, when the price (close) crosses the ema.\nStrategy 2:\nLong, only when ema goes up")
i_barColOn   = input.bool       (true,      '■ Bar Color On/Off'            , group   = 'Display')
i_alertOn    = input.bool       (false,     '■ Alert On/Off'                , group   = 'Display')
i_channelOn  = input.bool       (false,     '■ Channel Range On/Off'        , tooltip = 'If the price (close) is over than the channel, the trend is bullish. If the price is under, bearish. And if the price is in the channel, it is in range', group   = 'Display')
i_goldenOn   = input.bool       (false,     '■ Golden Cross On/Off'         )
o_alert      =                              '{{strategy.order.comment}}'
i_alert      = input.string     (o_alert,   'Setting alert'                 , tooltip = 'For Alerts, just copy {{strategy.order.comment}} and paste in alert window.', group   = 'Display')

// ---------   Calculations
maFast1      = ta.ema(i_maSrc, i_maFast1)
maFast2      = ta.ema(i_maSrc, i_maFast2)
maDir        = maFast1 > maFast2 ? 1 : -1
maTrend      = request.security(syminfo.tickerid, i_htf,
               i_maLenSel == "SMA" ? ta.sma(close, i_maLen)[1] : ta.ema(close, i_maLen)[1],
               lookahead = barmerge.lookahead_on)  //No repaint
maTrendDir   = i_maSrc >= maTrend ? 1 : -1
rangeAtr     = ta.atr(i_maLen) * i_rangeLen
rangeTop     = maTrend + rangeAtr
rangeBot     = maTrend - rangeAtr
rangeCh      = (open <= rangeTop or close <= rangeTop) and
               (open >= rangeBot or close >= rangeBot)
trendDir     = i_typeS  ==  'Strategy 1'                            ?
               rangeCh                                                ?  0 :
               maTrendDir ==  1 and maDir ==  1 and maTrend > maFast2 ?  0 :
               maTrendDir == -1 and maDir == -1 and maTrend < maFast2 ?  0 :
               maTrendDir ==  1 and maDir ==  1                       ?  1 :
               maTrendDir == -1 and maDir == -1                       ? -1 : 0 :
               rangeCh                                                ?  0 :
               maTrendDir ==  1 and maDir ==  1                       ?  1 :
               maTrendDir == -1 and maDir == -1                       ? -1 : 0
GCross       = i_goldenOn ? ta.crossover (maFast2, maTrend) : na
DCross       = i_goldenOn ? ta.crossunder(maFast2, maTrend) : na

period       = true
// Set initial values
condition    = 0.0
entryLong    = trendDir ==  1 and
               i_posSel != 'Only Short' and
               (i_periodSw ? period : true)
entryShort   = trendDir == -1 and
               i_posSel != 'Only Long' and
               (i_periodSw ? period : true)
exitLong     = (trendDir !=  1 or maDir == -1) and
               condition[1] == 1 and
               i_posSel != 'Only Short' and
               (i_periodSw ? period : true)
exitShort    = (trendDir != -1 or maDir ==  1) and
               condition[1] == -1 and
               i_posSel != 'Only Long' and
               (i_periodSw ? period : true)
closeCond    = exitLong or exitShort
// Stop Loss (sl)
slEntry      = close * i_sl / 100
slTop        = close + slEntry
slBot        = close - slEntry
slTopBuff    = ta.valuewhen(condition[1] !=  1 and entryLong,  slBot, 0)
slBotBuff    = ta.valuewhen(condition[1] != -1 and entryShort, slTop, 0)
slLine       = condition[1] == -1 and entryLong  ? slTopBuff :
               condition[1] ==  1 and entryShort ? slBotBuff :
               condition[1] ==  1  or entryLong  ? slTopBuff :
               condition[1] == -1  or entryShort ? slBotBuff : na
slTopCross   = condition[1] ==  1 and ta.crossunder(close, slLine) or high > slLine and low < slLine
slBotCross   = condition[1] == -1 and ta.crossover (close, slLine) or high > slLine and low < slLine
slExit       = i_slOn ? slTopCross or slBotCross : na
// Conditions
condition   := condition[1] !=  1 and entryLong  ?  1 :
               condition[1] != -1 and entryShort ? -1 :
               condition[1] !=  0 and slExit     ?  0 :
               condition[1] !=  0 and exitLong   ?  0 :
               condition[1] !=  0 and exitShort  ?  0 : nz(condition[1])
long         = condition[1] !=  1 and condition ==  1
short        = condition[1] != -1 and condition == -1
xl           = condition[1] ==  1 and exitLong and not slExit
xs           = condition[1] == -1 and exitShort and not slExit
sl           = condition[1] !=  0 and slExit

// ---------   Colors
c_green      = #006400  //Green
c_greenLight = #388e3c  //Green Light
c_red        = #8B0000  //Red
c_redLight   = #b71c1c  //Red Light
c_emas       = xl                             ? color.new(color.orange, 99) :
               xs                             ? color.new(color.orange, 99) :
               trendDir ==  1 and maDir ==  1 ? color.new(c_green,      99) :
               trendDir == -1 and maDir == -1 ? color.new(c_red,        99) :
               color.new(color.orange, 99)
c_maFill     = xl                             ? color.new(color.orange, 70) :
               xs                             ? color.new(color.orange, 70) :
               trendDir ==  1 and maDir ==  1 ? color.new(c_green,      70) :
               trendDir == -1 and maDir == -1 ? color.new(c_red,        70) :
               color.new(color.orange, 70)
c_maTrend    = trendDir ==  0                           ? color.new(color.orange,  0) :
               trendDir ==  1 and maTrend[1]  < maTrend ? color.new(c_green,       0) :
               trendDir ==  1 and maTrend[1] >= maTrend ? color.new(c_greenLight,  0) :
               trendDir == -1 and maTrend[1]  < maTrend ? color.new(c_redLight,    0) :
               trendDir == -1 and maTrend[1] >= maTrend ? color.new(c_red,         0) : na
c_ch         = trendDir ==  0                           ? color.new(color.orange, 50) :
               trendDir ==  1                           ? color.new(c_green,      50) :
               trendDir == -1                           ? color.new(c_red,        50) : na
c_slLineUp   = ta.rising (slLine, 1)
c_slLineDn   = ta.falling(slLine, 1)
c_slLine     = c_slLineUp ? na :
               c_slLineDn ? na : color.red
c_barCol     = trendDir ==  0                   ? color.new(color.orange,  0) :
               trendDir ==  1 and open <= close ? color.new(c_green,       0) :
               trendDir ==  1 and open  > close ? color.new(c_greenLight,  0) :
               trendDir == -1 and open >= close ? color.new(c_red,         0) :
               trendDir == -1 and open  < close ? color.new(c_redLight,    0) :
               color.new(color.orange, 0)

// ---------   Plots
p_maFast1    = plot(
  maFast1,
  title      = 'EMA Fast 1',
  color      = c_emas,
  linewidth  = 1)
p_maFast2    = plot(
  maFast2,
  title      = 'EMA Fast 2',
  color      = c_emas,
  linewidth  = 2)
fill(
  p_maFast1, p_maFast2,
  title      = 'EMAs Fill',
  color      = c_maFill)
plot(
  maTrend,
  title      = 'SMA Trend',
  color      = c_maTrend,
  linewidth  = 3)
p_chTop      = plot(
  i_channelOn   ? rangeTop : na,
  title      = 'Top Channel',
  color      = c_maTrend,
  linewidth  = 1)
p_chBot      = plot(
  i_channelOn   ? rangeBot : na,
  title      = 'Bottom Channel',
  color      = c_maTrend,
  linewidth  = 1)
fill(
  p_chTop, p_chBot,
  title      = 'Channel',
  color      = c_ch)
plot(
  i_slOn and condition != 0 ? slLine : na,
  title      = 'Stop Loss Line',
  color      = c_slLine,
  linewidth  = 1,
  style      = plot.style_linebr)

// ---------   Alerts
barcolor(i_barColOn ? c_barCol : na)

plotshape(
  i_alertOn and long ? high : na,
  title      = 'Long Label',
  text       = 'Long',
  textcolor  = color.white,
  color      = color.new(c_green, 0),
  style      = shape.labelup,
  size       = size.normal,
  location   = location.belowbar)
plotshape(
  i_alertOn and short ? low : na,
  title      = 'Short Label',
  text       = 'Short',
  textcolor  = color.white,
  color      = color.new(c_red, 0),
  style      = shape.labeldown,
  size       = size.normal,
  location   = location.abovebar)
plotshape(
  i_alertOn and (xl or xs) ? close : na,
  title      = 'Close Label',
  text       = 'Close',
  textcolor  = color.orange,
  color      = color.new(color.orange, 0),
  style      = shape.xcross,
  size       = size.small,
  location   = location.absolute)
plotshape(
  i_alertOn and sl ? slLine : na,
  title      = 'Stop Loss',
  text       = 'Stop\nLoss',
  textcolor  = color.orange,
  color      = color.new(color.orange, 0),
  style      = shape.xcross,
  size       = size.small,
  location   = location.absolute)
plotshape(
  i_alertOn and i_goldenOn and GCross ? maTrend : na,
  title      = 'Golden Cross Label',
  text       = 'Golden\nCross',
  textcolor  = color.white,
  color      = color.new(color.orange, 0),
  style      = shape.labelup,
  size       = size.normal,
  location   = location.absolute)
plotshape(
  i_alertOn and i_goldenOn and DCross ? maTrend : na,
  title      = 'Death Cross Label',
  text       = 'Death\nCross',
  textcolor  = color.white,
  color      = color.new(color.orange, 0),
  style      = shape.labeldown,
  size       = size.normal,
  location   = location.absolute)

bgcolor(
  i_periodSw and not period ? color.new(color.gray, 90) : na,
  title      = 'Session')

// ---------   Backtest
if long  and strategy.position_size == 0 and barstate.isconfirmed
    strategy.entry('Long',  strategy.long,  comment = 'long')
if short and strategy.position_size == 0 and barstate.isconfirmed
    strategy.entry('Short', strategy.short, comment = 'short')
strategy.exit(
  id         = 'XL',
  from_entry = 'Long',
  stop       = i_slOn ? slLine : na)
strategy.exit(
  id         = 'XS',
  from_entry = 'Short',
  stop       = i_slOn ? slLine : na)
strategy.close(
  'Long',
  comment    = 'Close',
  when       = xl)
strategy.close(
  'Short',
  comment    = 'Close',
  when = xs)
- Strategie für einen doppelten Breakout der bewegten Durchschnittsspanne
- Gitterstrategie mit gleitenden Durchschnittslinien
- Dual Moving Average Intelligente Verfolgungsstrategie
- Die RSI-EMA-Strategie für den Trendbruch
- Strategie zur Rückprüfung des Pivotpoint-Oszillators
- Integriertes Ichimoku-Keltner-Handelssystem auf Basis einer gleitenden Durchschnittsstrategie
- Doppelverfolgungs-Schildkrötenhandel
- Ichimoku Kinko Hyo-basierte BTC-Handelsstrategie
- AO-Indikator-basierte Entwicklung nach Strategie
- Universal-Sniper-Strategie
- Bollinger-Bands-Strategie für den Momentum-Ausbruch
- Bollinger-Band-Kürzfristige Umkehrung
- Gradient-MACD-Quantenstrategie
- Zweigleisige schnelle quantitative Umkehrhandelsstrategie
- Heikin Ashi und Kaufman Adaptive Moving Average Handelsstrategie
- Momentum-Breakout-Handelsstrategie
- Ichimoku bewegliche Durchschnitts-Crossover-Strategie
- Momentum- und Volumenhandelsstrategie
- Fraktaler Ausbruch
- Bill Williams - eine tolle Oszillator-Handelsstrategie