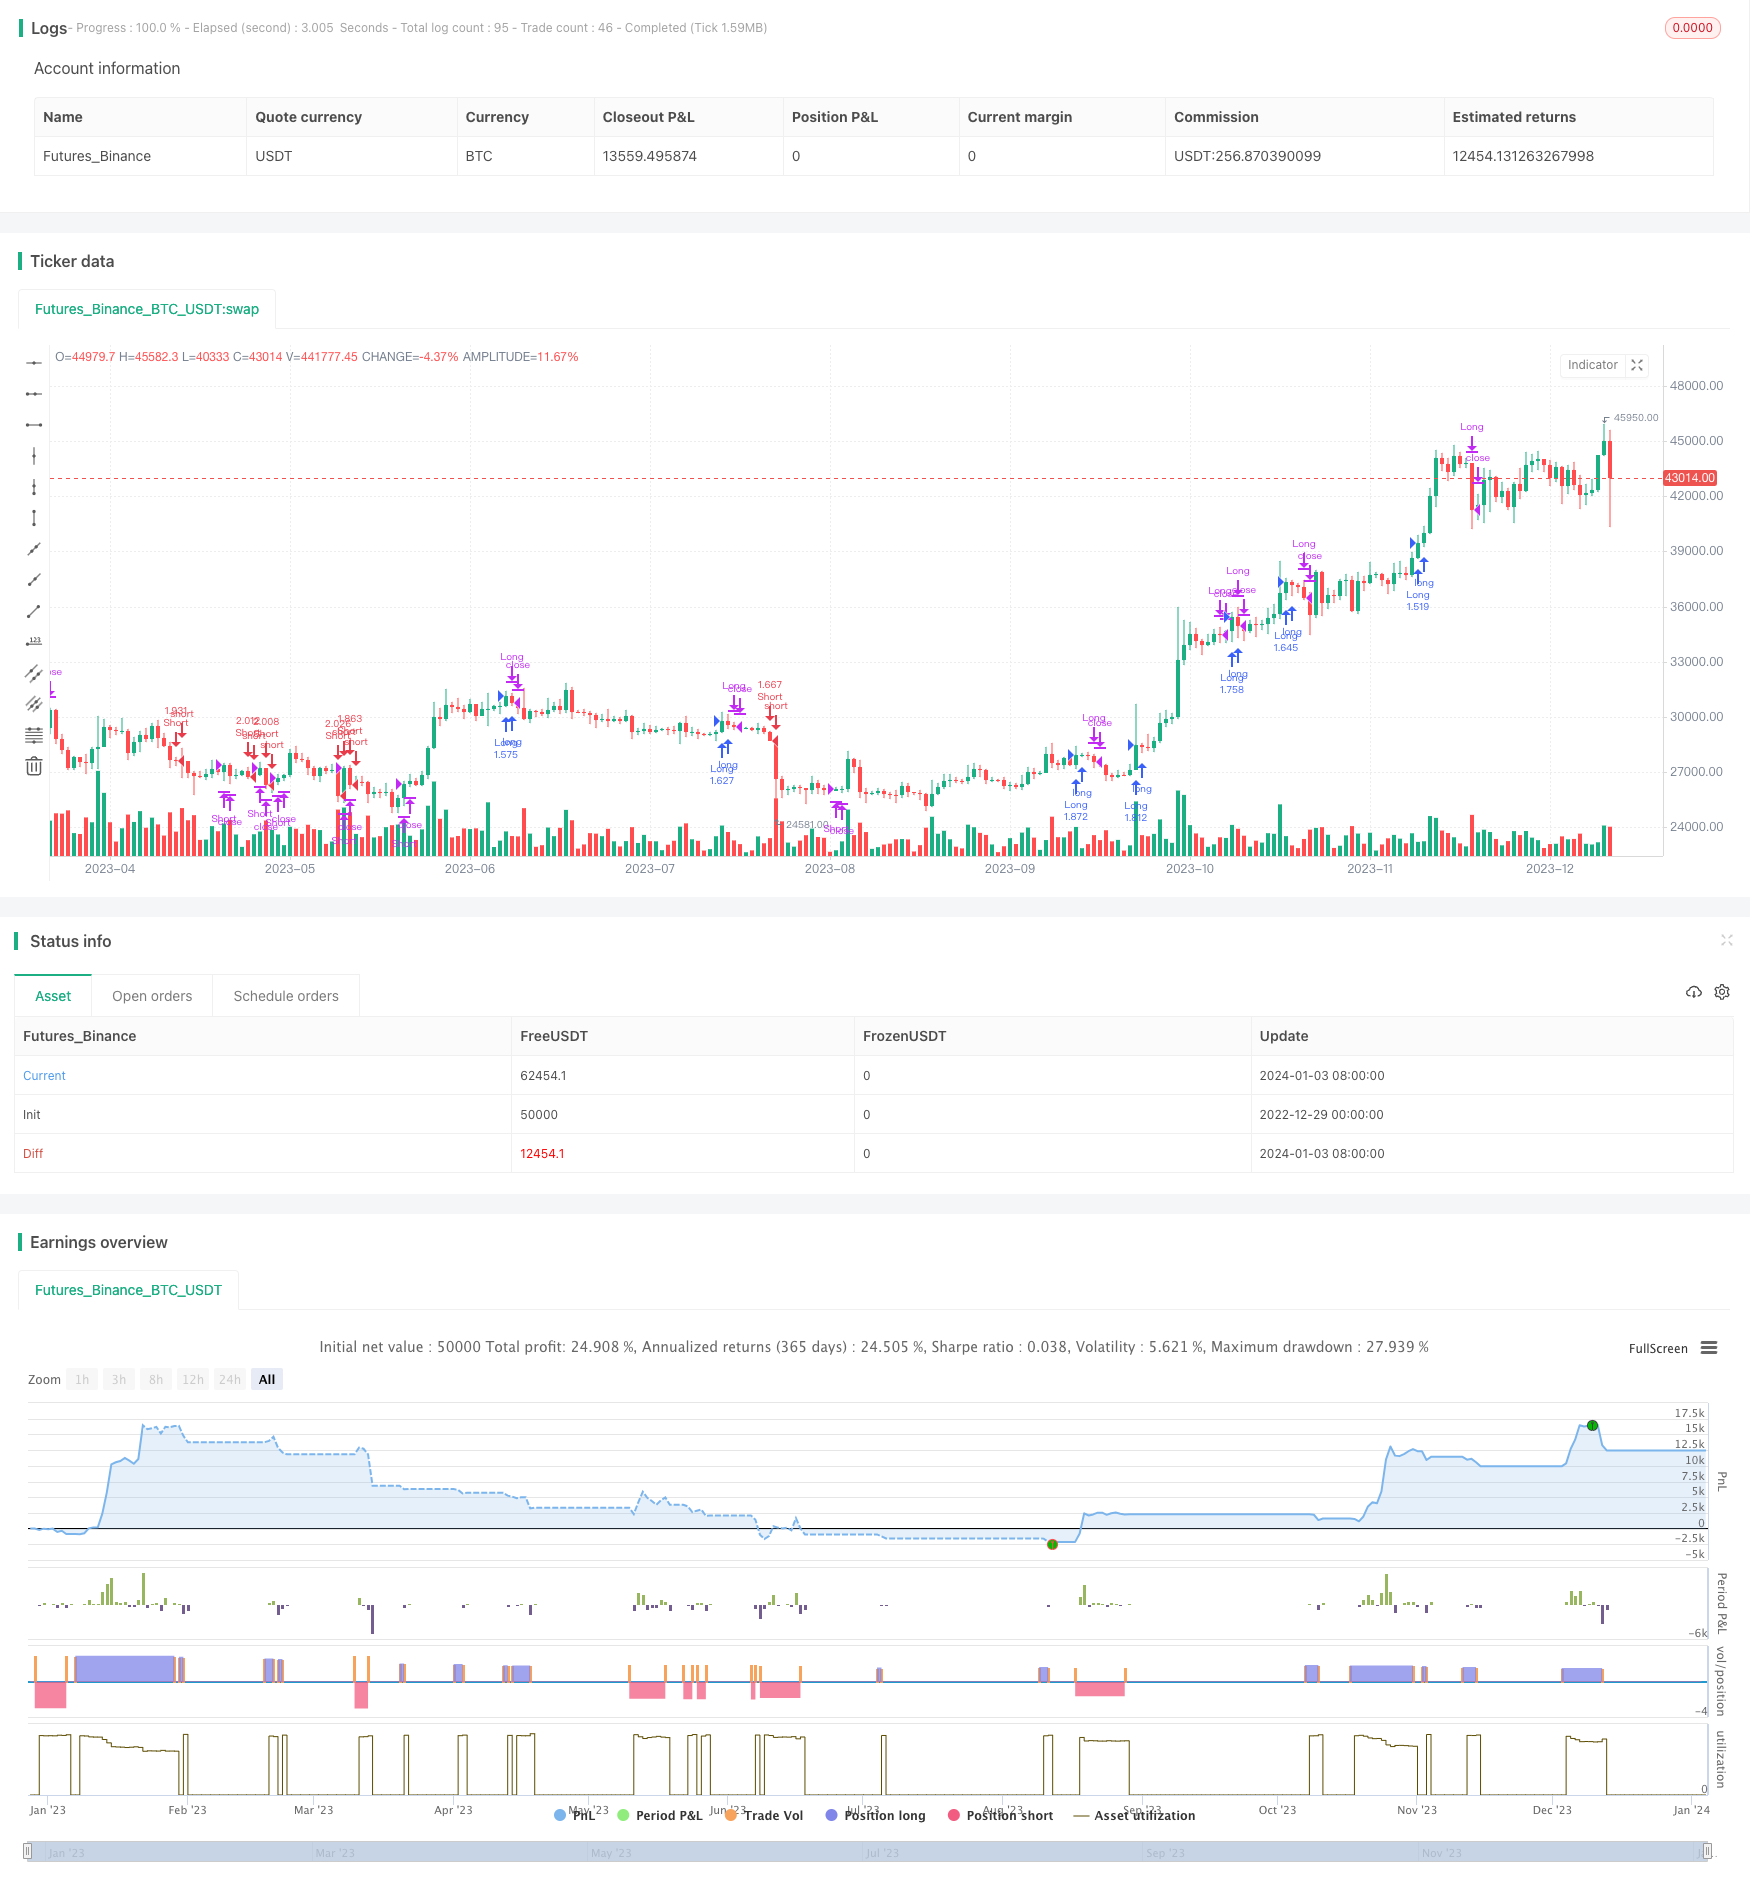
Ichimoku Cloud Quantitative Handelsstrategie

Überblick
Diese Strategie verwendet mehrere Indikatoren wie eine Kurve, eine Tages-K-Linie, einen Hull-Moving-Average und einen MACD-Indikator, um einen langfristigen und mehrfristigen Entscheidungsmechanismus zu erstellen, der den automatischen Handel ermöglicht.
Strategieprinzip
Auf der Grundlage von Ichimoku-Wolkenstreifen werden Übergangs- und Verzögerungslinien erstellt, um mehrere Handelssignale zu erstellen. Die Richtung des Trends wird in Kombination mit dem Hull Moving Average bestimmt. Die MACD-Anzeige wird verwendet, um den langen oder kurzen Rhythmus zu bestimmen. Die intraday-K-Linie wird als Einstiegssignal beurteilt.
Die Umschaltlinie ist der Mittelwert von fast 9 Tagen. Die Verzögerungslinie ist der Mittelwert von fast 26 Tagen. Wenn Sie die Verzögerungslinie auf der Umschaltlinie durchlaufen, machen Sie mehr.
Der Hull-Moving-Average beurteilt die Tendenz durch die Überschneidung der doppelten Mittelwerte, wenn die Schnelllinie die langsame Linie durchquert, wird er als Aufwärtstrend beurteilt; umgekehrt wird dann als Abwärtstrend beurteilt.
Der MACD nimmt die Differenz zwischen den Indikatoren 12 und 26 als Moving Average auf und beurteilt die Leerheit anhand der Null-Achse und der Gold- und Todesfalle des Durchschnitts.
Die K-Linie innerhalb eines Tages durchbricht die Verzögerungslinie als Einstiegszeit.
Strategische Vorteile
- Das ist eine sehr gute Methode, um die Richtung der Trends zu bestimmen.
- Die Wahl ist präzise und man vermeidet unnötige Transaktionen.
- Das Risiko ist unter Kontrolle und die Verletzungsdämpfung ist eingestellt.
Strategisches Risiko
- Eine falsche Einstellung der Parameter kann zu einem zu starken Einstieg führen.
- Die Kombination von mehreren Indikatoren erhöht die Komplexität der Strategie.
- Die Kurzstreckenoperationen werden unweigerlich zurückgenommen.
Strategieoptimierung
- Anpassung der Parameterkombinationen an weitere Sorten und Perioden.
- Das Modul wurde mit einem Modul für maschinelles Lernen ergänzt, um die Anpassung der Parameter zu ermöglichen.
- Optimierung der Eintrittswerte und Erhöhung der Gewinnquote.
Zusammenfassen
Die Strategie kombiniert mehrere Kennzeichen wie die Ichimoku-Wolkenstreifen, um ein vollständiges quantitatives Entscheidungssystem zu schaffen. Strenge Stop-Loss-Stopp-Mechanismen kontrollieren das Handelsrisiko. Durch die Anpassung der Parameter und die Optimierung der Modelle können mehr Handelsarten angepasst werden und haben eine breite Anwendungspotenziale.
/*backtest
start: 2022-12-29 00:00:00
end: 2024-01-04 00:00:00
period: 1d
basePeriod: 1h
exchanges: [{"eid":"Futures_Binance","currency":"BTC_USDT"}]
*/

//@version=2
// Any timeFrame ok but good on 15 minute & 60 minute , Ichimoku + Daily-Candle_cross(DT) + HULL-MA_cross + MacD combination 420 special blend
strategy("Ichimoku + Daily-Candle_X + HULL-MA_X + MacD", shorttitle="٩(̾●̮̮̃̾•̃̾)۶", overlay=true, default_qty_type=strategy.percent_of_equity, max_bars_back=720, default_qty_value=100, calc_on_order_fills= true, calc_on_every_tick=true, pyramiding=0)
keh=input(title="Double HullMA",defval=14, minval=1)
dt = input(defval=0.0010, title="Decision Threshold (0.001)", type=float, step=0.0001)
SL = input(defval=-500.00, title="Stop Loss in $", type=float, step=1)
TP = input(defval=25000.00, title="Target Point in $", type=float, step=1)
ot=1
n2ma=2*wma(close,round(keh/2))
nma=wma(close,keh)
diff=n2ma-nma
sqn=round(sqrt(keh))
n2ma1=2*wma(close[1],round(keh/2))
nma1=wma(close[1],keh)
diff1=n2ma1-nma1
sqn1=round(sqrt(keh))
n1=wma(diff,sqn)
n2=wma(diff1,sqn)
b=n1>n2?lime:red
c=n1>n2?green:red
d=n1>n2?red:green
confidence=(request.security(syminfo.tickerid, 'D', close)-request.security(syminfo.tickerid, 'D', close[1]))/request.security(syminfo.tickerid, 'D', close[1])
conversionPeriods = input(9, minval=1, title="Conversion Line Periods")
basePeriods = input(26, minval=1, title="Base Line Periods")
laggingSpan2Periods = input(52, minval=1, title="Lagging Span 2 Periods")
displacement = input(26, minval=1, title="Displacement")
donchian(len) => avg(lowest(len), highest(len))
conversionLine = donchian(conversionPeriods)
baseLine = donchian(basePeriods)
leadLine1 = avg(conversionLine, baseLine)
leadLine2 = donchian(laggingSpan2Periods)
LS=close, offset = -displacement
MACD_Length = input(9)
MACD_fastLength = input(12)
MACD_slowLength = input(26)
MACD = ema(close, MACD_fastLength) - ema(close, MACD_slowLength)
aMACD = ema(MACD, MACD_Length)
closelong = n1<n2 and close<n2 and confidence<dt or strategy.openprofit<SL or strategy.openprofit>TP
if (closelong)
    strategy.close("Long")
closeshort = n1>n2 and close>n2 and confidence>dt or strategy.openprofit<SL or strategy.openprofit>TP
if (closeshort)
    strategy.close("Short")
longCondition = n1>n2 and strategy.opentrades<ot and confidence>dt and close>n2 and leadLine1>leadLine2 and open<LS and MACD>aMACD
if (longCondition)
    strategy.entry("Long",strategy.long)
shortCondition = n1<n2 and strategy.opentrades<ot and confidence<dt and close<n2 and leadLine1<leadLine2 and open>LS and MACD<aMACD
if (shortCondition)
    strategy.entry("Short",strategy.short)//                         /L'-,
//                               ,'-.           /MM . .             /  L '-,
//     .                    _,--dMMMM\         /MMM  `..           /       '-,
//     :             _,--,  )MMMMMMMMM),.      `QMM   ,<>         /_      '-,'
//     ;     ___,--. \MM(    `-'   )M//MM\       `  ,',.;      .-'* ;     .'
//     |     \MMMMMM) \MM\       ,dM//MMM/     ___ < ,; `.      )`--'    /
//     |      \MM()M   MMM)__   /MM(/MP'  ___, \  \ `  `. `.   /__,    ,'
//     |       MMMM/   MMMMMM( /MMMMP'__, \     | /      `. `-,_\     /
//     |       MM     /MMM---' `--'_ \     |-'  |/         `./ .\----.___
//     |      /MM'   `--' __,-  \""   |-'  |_,               `.__) . .F. )-.
//     |     `--'       \   \    |-'  |_,     _,-/            J . . . J-'-. `-.,
//     |         __  \`. |   |   |         \    / _           |. . . . \   `-.  F
//     |   ___  /  \  | `|   '      __  \   |  /-'            F . . . . \     '`
//     |   \  \ \  /  |        __  /  \  |  |,-'        __,- J . . . . . \
//     |    | /  |/     __,-  \  ) \  /  |_,-     __,--'     |. .__.----,'
//     |    |/    ___     \    |'.  |/      __,--'           `.-;;;;;;;;;\
//     |     ___  \  \     |   |  `   __,--'                  /;;;;;;;;;;;;.
//     |     \  \  |-'\    '    __,--'                       /;;;;;;;;;;;;;;\
// \   |      | /  |      __,--'                             `--;;/     \;-'\
//  \  |      |/    __,--'                                   /  /         \  \
//   \ |      __,--'                                        /  /           \  \
//    \|__,--'                                          _,-;M-K,           ,;-;\
//                                                     <;;;;;;;;           '-;;;;
//a1=plot(n1,color=c)
//a2=plot(n2,color=c)
//plot(cross(n1, n2) ? n1 : na, style = circles, color=b, linewidth = 4)
//plot(cross(n1, n2) ? n1 : na, style = line, color=d, linewidth = 4)
//plot(conversionLine, color=#0496ff, title="Conversion Line")
//plot(baseLine, color=#991515, title="Base Line")
//plot(close, offset = -displacement, color=#459915, title="Lagging Span")
//p1=plot (leadLine1, offset = displacement, color=green,  title="Lead 1")
//p2=plot (leadLine2, offset = displacement, color=red,  title="Lead 2")
//fill(p1, p2, color = leadLine1 > leadLine2 ? green : red)
// remove the "//" from before the plot script if want to see the indicators on chart