Doppelte EMA Golden Cross Take-Profit-Strategie
Überblick
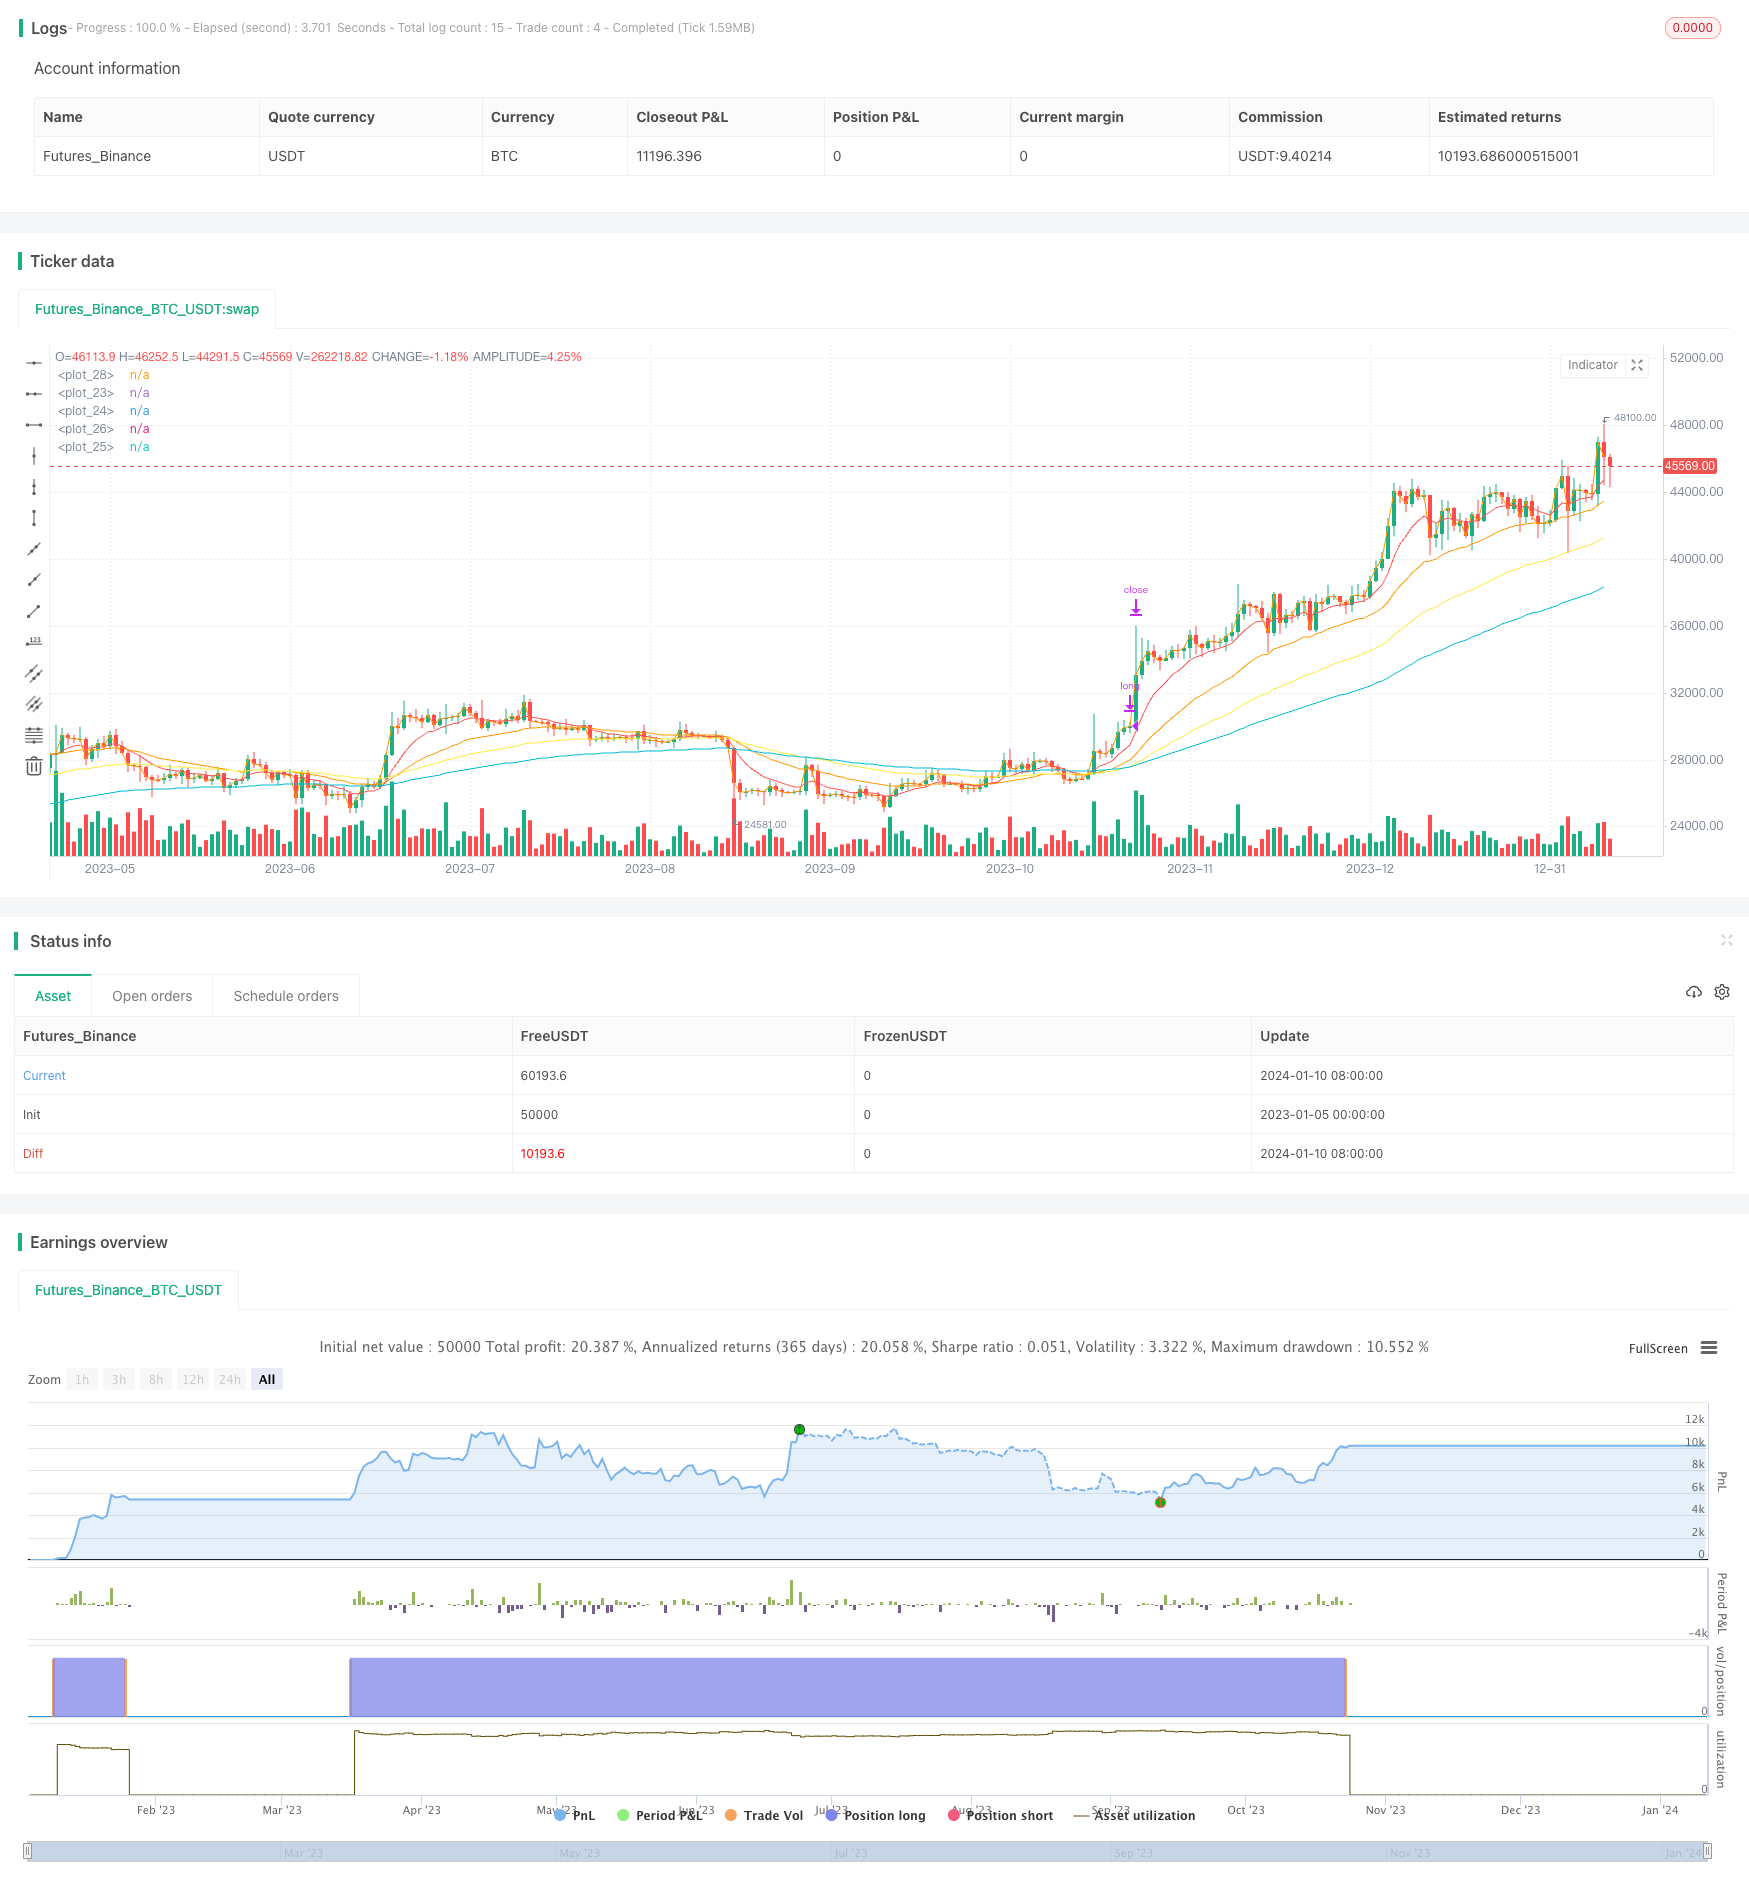
Diese Strategie ermöglicht eine effiziente Short-Line-Trading-Strategie, indem sie zwei EMA-Indikatoren mit unterschiedlichen Parametern berechnet und ein Kaufsignal für eine Gold-Kreuzung zweier EMA-Indikatoren und ein Verkaufssignal für eine Todes-Kreuzung zweier anderer EMA-Indikatoren setzt.
Strategieprinzip
Die Strategie verwendet vier EMA-Indikatoren, 9 Zyklen EMA1, 26 Zyklen EMA2, 100 Zyklen EMA3 und 55 Zyklen EMA4. Wenn ein Kaufsignal auf EMA1 eingestellt ist, um EMA2 zu überschreiten, handelt es sich um ein typisches Gold-Kreuzsignal. Wenn ein Verkaufssignal auf EMA3 eingestellt ist, um EMA4 zu überschreiten, handelt es sich um ein Todeskreuz.
Strategische Vorteile
- Schnelle Ein- und Ausgänge mit doppelter EMA-Kreuzung, um die Gewinnspanne in kurzen Zeilen zu schließen
- Handelssignale sind einfach, klar und umsetzbar
- Parameter sind anpassbar und können an unterschiedliche Märkte angepasst werden
- Der Scalping-Bereich ist groß und eignet sich für Short-Line-Scalping.
Risikoanalyse
- Bei doppelten EMA-Kreuzungen kann es zu Fehlsignalen kommen, die in Kombination mit anderen Indikatoren gefiltert werden müssen.
- Unzureichende Einstellungen der EMA-Parameter können zu überempfindlich oder langsam werden.
- Die Bewegung auf der großen Ebene muss genau beobachtet werden, um sie zu stoppen.
Optimierungsrichtung
- Die MACD, KDJ und andere Indikatoren können zur Signalfilterung verwendet werden, um die Signalgenauigkeit zu verbessern.
- Es gibt mehr Kombinationen, um optimale EMA-Parameter zu finden.
- Es ist möglich, einen mobilen Stop-Loss einzurichten, um Gewinne zu sperren.
Zusammenfassen
Diese Strategie ist insgesamt eine sehr typische und effektive Short-Line-Handelsstrategie. Die Vorteile sind schnelles Ein- und Aussteigen, geeignet für Scalping, mit großer Gewinnspanne. Es gibt jedoch auch einige Risiken, vor denen Sie sich schützen müssen. Wenn die Parameter richtig angepasst werden und andere Indikatoren zur Signalfilterung unterstützt werden, kann dies eine sehr praktische Short-Line-Handelsstrategie sein.
/*backtest
start: 2023-01-05 00:00:00
end: 2024-01-11 00:00:00
period: 1d
basePeriod: 1h
exchanges: [{"eid":"Futures_Binance","currency":"BTC_USDT"}]
*/

// This source code is subject to the terms of the Mozilla Public License 2.0 at https://mozilla.org/MPL/2.0/
// © YukalMoon

//@version=5
strategy(title="EMA SCALPEUR", overlay=true, initial_capital = 1000)


//// input controls

EMA_L = input.int (title = "EMA_L", defval = 9, minval = 1, maxval = 100, step =1)
EMA_L2 = input.int (title = "EMA_L2", defval = 26, minval = 1, maxval = 100, step =1)
EMA_S = input.int (title = "EMA_S", defval = 100, minval = 1, maxval = 100, step =1)
EMA_S2 = input.int (title = "EMA_S2", defval = 55, minval = 1, maxval = 100, step =1)


/// mise en place de ema

shortest = ta.ema(close, 9)
short = ta.ema(close, 26)
longer = ta.ema(close, 100)
longest = ta.ema(close, 55)

plot(shortest, color = color.red)
plot(short, color = color.orange)
plot(longer, color = color.aqua)
plot(longest, color = color.yellow)

plot(close)

//// trading indicators

EMA1 = ta.ema (close,EMA_L)
EMA2 = ta.ema (close,EMA_L2)
EMA3 = ta.ema (close, EMA_S)
EMA4 = ta.ema (close, EMA_S2)


buy = ta.crossover(EMA1, EMA2)
//sell = ta.crossunder(EMA1, EMA2)

buyexit = ta.crossunder(EMA3, EMA4)
//sellexit = ta.crossover(EMA3, EMA4)

/////strategy

strategy.entry ("long", strategy.long, when = buy, comment = "EXIT-LONG")
//strategy.entry ("short", strategy.short, when = sell, comment = "ENTER-SHORT")


///// market exit

strategy.close ("long", when = buyexit, comment = "ENTER-LONG")
//strategy.close ("short",  when = sellexit, comment = "EXIT-SHORT")