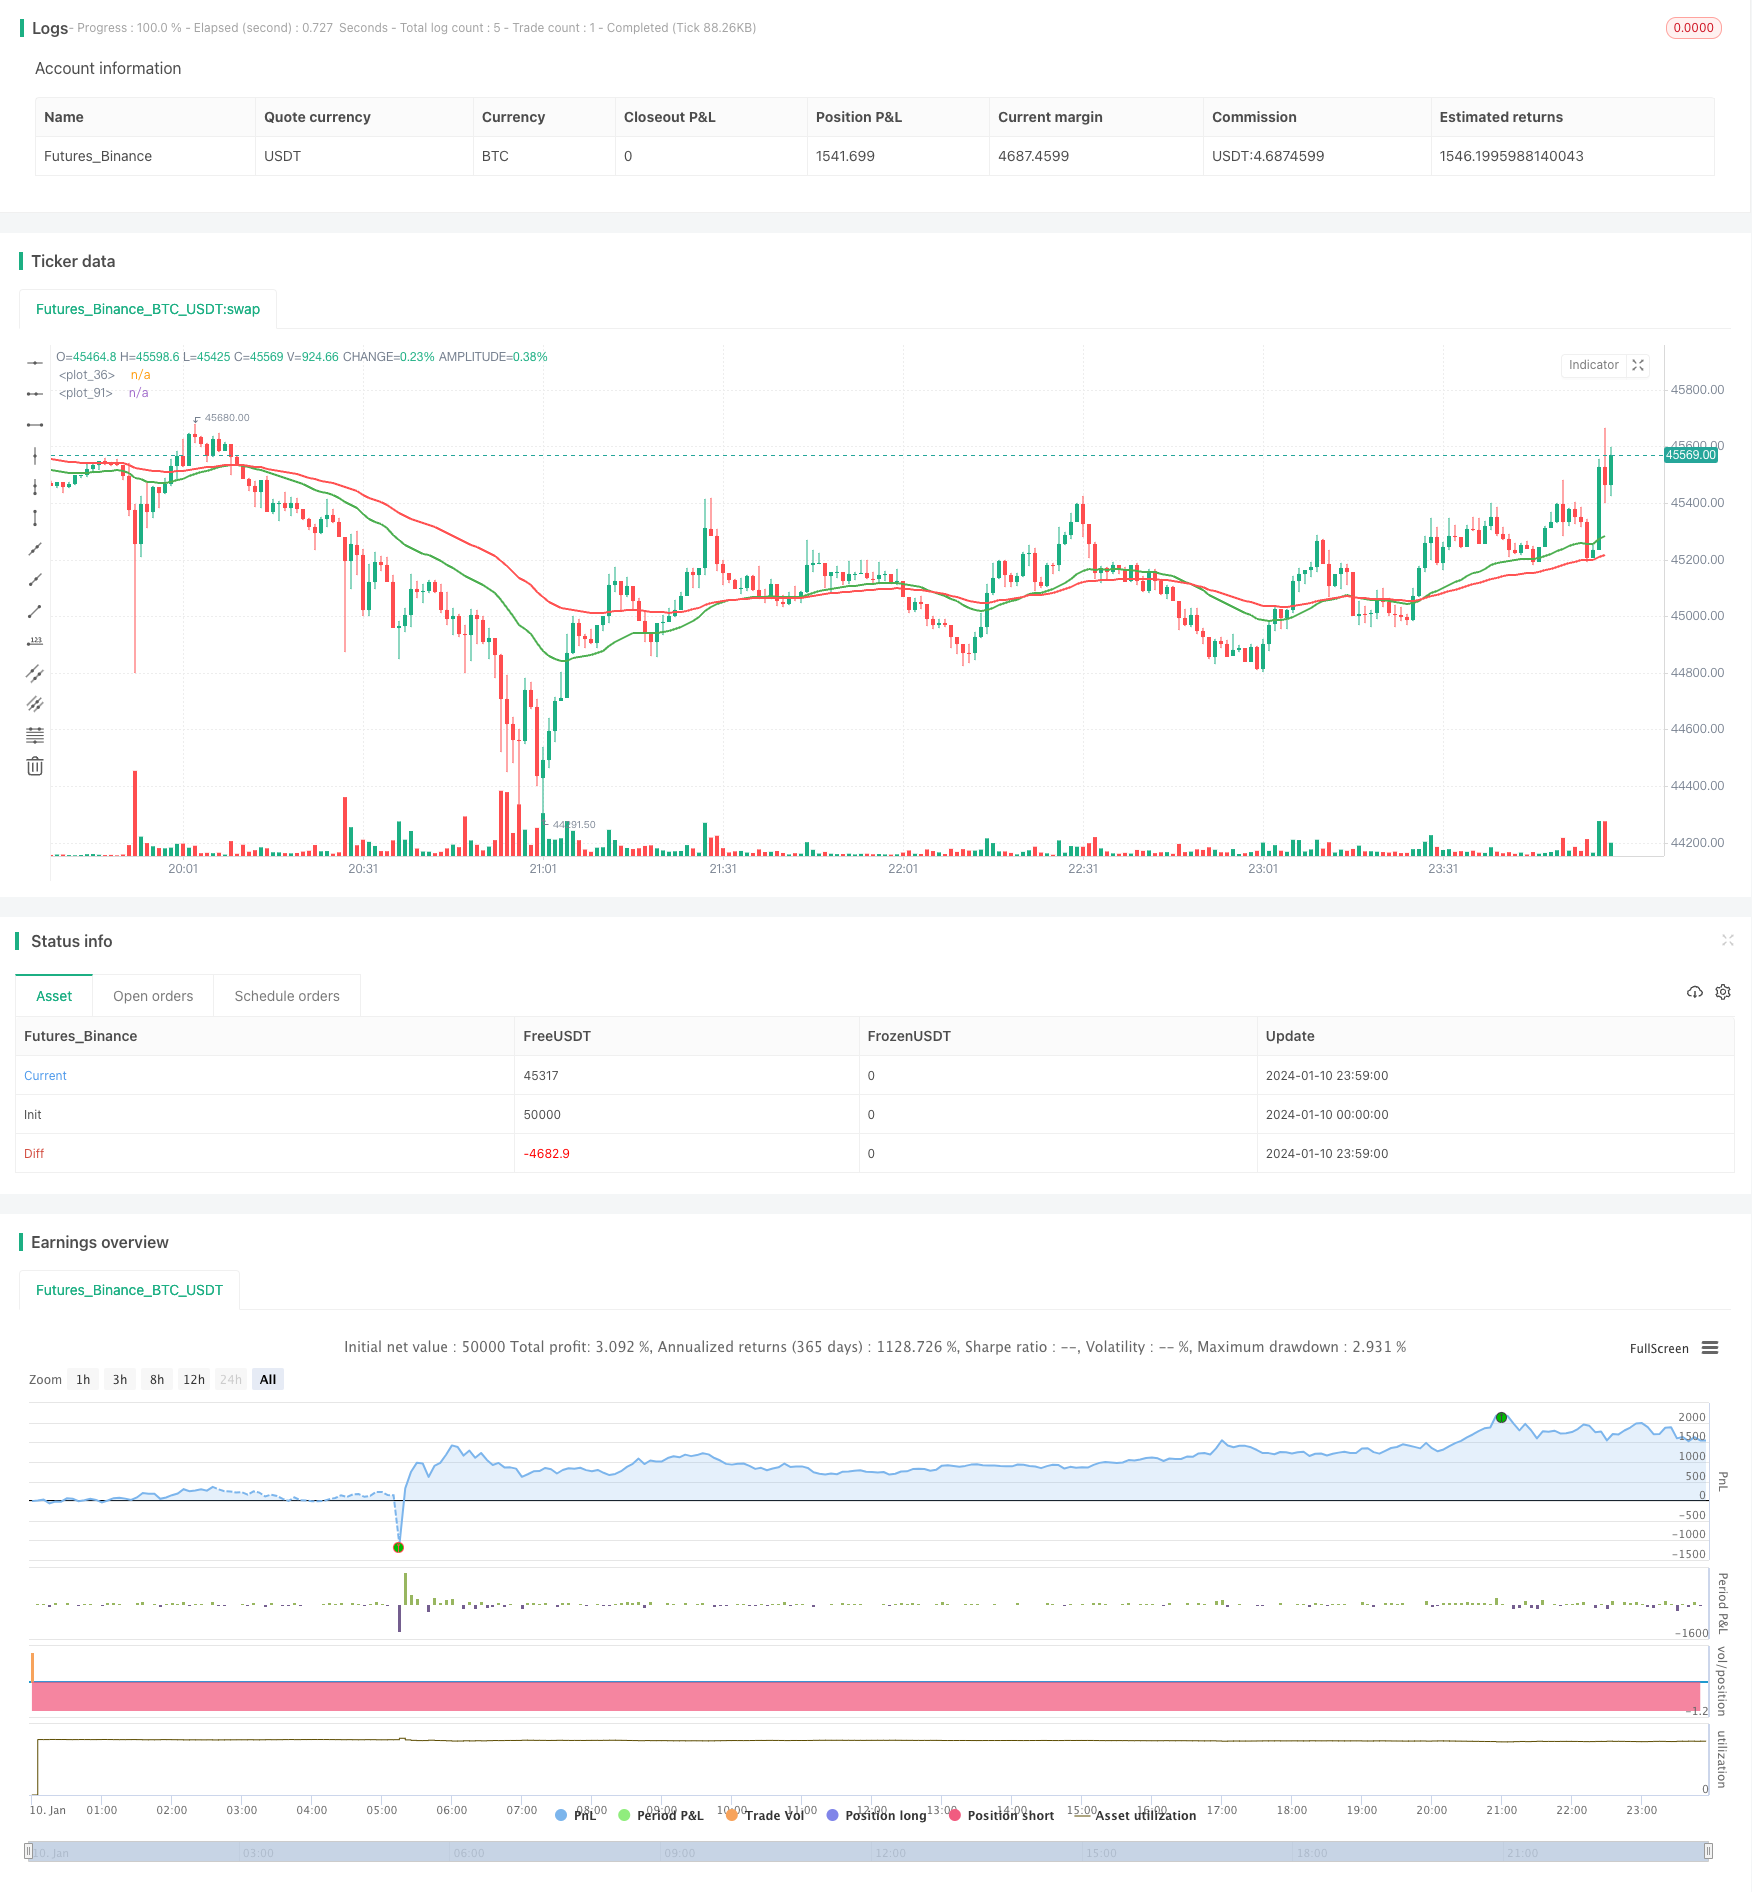
Typische Trendfolgestrategie

Überblick
Eine typische Trend-Tracking-Strategie ist die Doppel-Even-Linien-Kreuz-Strategie. Sie nutzt die EMA-Even-Linien von zwei verschiedenen Perioden, um die Wendepunkte der Preisentwicklung zu erfassen. Sie macht einen Überschuss, wenn die kurze Periode über der langen Periode geht, und macht eine Lücke, wenn die kurze Periode unter der langen Periode geht.
Strategieprinzip
Die Kernindikatoren der Strategie sind zwei EMA-Mittellinien mit 30 und 60 Zyklen. Zwei EMA-Mittellinien werden im Code durch eine benutzerdefinierte Funktion berechnet:
emaLen1 = emaFuncOne(close, lenMA1)
emaLen2 = emaFuncTwo(close, lenMA2)
Das Handelssignal für die Strategie kommt von der Kreuzung zweier EMA-Gleichlinien:
currentState = if emaLen2 > emaLen1
    0
else
    1

previousState = if emaLastLen2 > emaLastLen1
    0
else
    1

convergence = if currentState != previousState
    1
else
    0
Wenn ein kurzfristiger EMA einen langfristigen EMA überträgt, ist der currentState nicht gleich dem previousState, und es tritt ein Kreuzsignal auf. Wenn die kurzfristige EMA die langfristige EMA durchbricht, ist der currentState nicht gleich dem previousState, und es tritt ein Kreuzsignal auf.
Analyse der Stärken
Diese Strategie hat folgende Vorteile:
- Die Strategie ist einfach, intuitiv, leicht zu verstehen und umzusetzen.
- Nutzung der glatten Eigenschaften der EMA-Gleichlinie, um Marktlärm effektiv zu filtern
- Automatische Trendverfolgung, keine Ausfälle
Risikoanalyse
Die Strategie birgt auch einige Risiken:
- Die Signalverzögerung kann zu einer Verzögerung führen, die eine Umkehrung nicht rechtzeitig erfasst.
- Bei Erdbeben kann es zu mehreren Fehlsignalen kommen.
- Die Parameter sind nicht korrekt eingestellt, was zu einer Überempfindlichkeit oder zu einer Verzögerung führen kann.
Optimierung durch Anpassung der EMA-Zyklen oder durch Hinzufügen von Filterbedingungen.
Optimierungsrichtung
Diese Strategie kann in folgenden Bereichen optimiert werden:
- Versuche mit EMA-Zykluskombinationen unterschiedlicher Länge
- Zunahme der Transaktionsmenge oder der Schwankungen der Bedingungen, um falsche Signale zu filtern
- Bestätigung von Trends in Kombination mit anderen Indikatoren, z. B. MACD
- Optimierung der Vermögensverwaltung und Einrichtung von Stop-Loss-Systemen
Zusammenfassen
Die Doppel-Einheitliche-Kreuz-Strategie ist insgesamt eine einfache und praktische Trend-Tracking-Strategie. Sie ist straight-forward, leicht zu implementieren und kann den Trend automatisch verfolgen. Es besteht jedoch auch das Risiko, dass einige Rückstände und falsche Signale auftreten. Durch die Optimierung der Parameter und die Erhöhung der Filterbedingungen kann sie weiterentwickelt werden, so dass sie zu einer der grundlegenden Strategien für den quantifizierten Handel wird.
/*backtest
start: 2024-01-10 00:00:00
end: 2024-01-11 00:00:00
period: 1m
basePeriod: 1m
exchanges: [{"eid":"Futures_Binance","currency":"BTC_USDT"}]
*/

//@version=2
strategy("ParkerMAStrat", overlay=true)

lenMA1=input(title="Length 1", defval=30)
lenMA2=input(title="Length 2",  defval=60)

x = 0

checkLines(current, last) =>

    if current > last
        x = 1
    else
        x = 0
    x


//plot ema based on len1
emaFuncOne(src, time_period) =>

    alpha = 2 / (time_period + 1)
    // we have defined the alpha function above
    ema = 0.0
    // this is the initial declaration of ema, since we dont know the first ema we will declare it to 0.0 [as a decimal]
    ema := alpha * src + (1 - alpha) * nz(ema[1])
    // this returns the computed ema at the current time
    // notice the use of : (colon) symbol before =, it symbolises, that we are changing the value of ema,
    // since the ema was previously declared to 0
    // this is called mutable variale declaration in pine script
    ema
    // return ema from the function

emaLen1 = emaFuncOne(close, lenMA1)


plot(emaLen1, color=green, transp=0, linewidth=2)
// now we plot the _10_period_ema

//plot ema based on len2
emaFuncTwo(src, time_period) =>

    alpha = 2 / (time_period + 1)
    // we have defined the alpha function above
    ema = 0.0
    // this is the initial declaration of ema, since we dont know the first ema we will declare it to 0.0 [as a decimal]
    ema := alpha * src + (1 - alpha) * nz(ema[1])
    // this returns the computed ema at the current time
    // notice the use of : (colon) symbol before =, it symbolises, that we are changing the value of ema,
    // since the ema was previously declared to 0
    // this is called mutable variale declaration in pine script
    ema
    // return ema from the function

//plot ema based on len2
emaFuncOneLast(src, time_period) =>

    alpha = 2 / (time_period + 1)
    // we have defined the alpha function above
    ema = 0.0
    // this is the initial declaration of ema, since we dont know the first ema we will declare it to 0.0 [as a decimal]
    ema := alpha * src + (1 - alpha) * nz(ema[0])
    // this returns the computed ema at the current time
    // notice the use of : (colon) symbol before =, it symbolises, that we are changing the value of ema,
    // since the ema was previously declared to 0
    // this is called mutable variale declaration in pine script
    ema
    // return ema from the function

//plot ema based on len2
emaFuncTwoLast(src, time_period) =>

    alpha = 2 / (time_period + 1)
    // we have defined the alpha function above
    ema = 0.0
    // this is the initial declaration of ema, since we dont know the first ema we will declare it to 0.0 [as a decimal]
    ema := alpha * src + (1 - alpha) * nz(ema[0])
    // this returns the computed ema at the current time
    // notice the use of : (colon) symbol before =, it symbolises, that we are changing the value of ema,
    // since the ema was previously declared to 0
    // this is called mutable variale declaration in pine script
    ema
    // return ema from the function


emaLastLen1 = emaFuncOneLast(close, lenMA1)
emaLastLen2 = emaFuncTwoLast(close, lenMA2)
emaLen2 = emaFuncTwo(close, lenMA2)


plot(emaLen2, color=red, transp=30, linewidth=2)
// now we plot the _10_period_ema

//now we compare the two and when green crosses red we buy/sell (line1 vs line2)

previousState = if emaLastLen2 > emaLastLen1
    0
else
    1

currentState = if emaLen2 > emaLen1
    0
else
    1

convergence = if currentState != previousState
    1
else
    0


lineCheck = if convergence == 1
    checkLines(currentState, previousState)

if lineCheck == 1
    strategy.entry("Long", strategy.long)
else
    strategy.entry("Short", strategy.short)